Oxygen abundance variations in the system of the two blue compact dwarf galaxies SBS 0335–052E and SBS 0335–052W††thanks: Based on observations collected at the European Southern Observatory, Chile, ESO program 76.B-0739.
We present 3.6m ESO telescope spectroscopic observations of the system of the two blue compact dwarf galaxies SBS 0335–052 W and SBS 0335–052 E. The oxygen abundance in SBS 0335–052W is 12 + log O/H = 7.13 0.08, confirming that this galaxy is the most metal-deficient emission-line galaxy known. We find that the oxygen abundance in SBS 0335–052E varies from region to region in the range from 7.20 to 7.31, suggesting the presence of an abundance gradient over a spatial scale of 1 kpc. Signatures of early carbon-type Wolf-Rayet stars are detected in cluster #3 of SBS 0335–052 E, corresponding to the emission of three to eighteen WC4 stars, depending on the adopted luminosity of a single WC4 star in the C iv 4658 emission line.
Key Words.:
galaxies: fundamental parameters – galaxies: starburst – galaxies: abundances1 Introduction
The system of the two blue compact dwarf (BCD) galaxies SBS 0335–052W and SBS 0335–052E is an excellent nearby laboratory for studying star formation in low-metallicity environments. Since its discovery as one of the most metal-deficient star-forming galaxies known (Izotov et al., 1990), with oxygen abundance 12 + log O/H 7.30 (Melnick et al., 1992; Izotov et al., 1997b, 1999; Thuan & Izotov, 2005), SBS 0335–052E has often been proposed as a nearby young dwarf galaxy (Izotov et al., 1990, 1997b; Thuan et al., 1997; Papaderos et al., 1998). This system contains several super-star clusters (Thuan et al., 1997; Papaderos et al., 1998), producing extended regions of ionized gas emission (Melnick et al., 1992; Izotov et al., 1997b; Papaderos et al., 1998; Pustilnik et al., 2004). Its companion galaxy SBS 0335–052W, the lowest metallicity emission-line galaxy known with 12 + log O/H = 7.12 0.03 (Izotov et al., 2005a), is located at a projected distance of 22 kpc from SBS 0335–052E. It was discovered by Pustilnik et al. (1997) as a dwarf emission-line galaxy associated with the brightest of the two intensity peaks of 21 cm emission in the large (66 by 22 kpc) H i envelope surrounding SBS 0335–052E, with which the other H i peak is associated (Pustilnik et al., 2001).


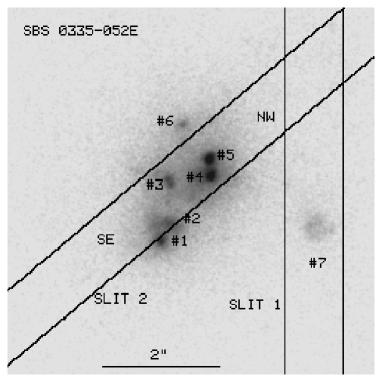
Because of the great interest of the SBS 0335–052 system to studies of dwarf galaxy formation and evolution, we have carried out new spectroscopic observations of both BCDs. Our work has been motivated by the following considerations. First, previous spectroscopic studies of SBS 0335–052E have been focused on the brightest clusters #1,#2 and #4,#5, indicated on the HST/ACS archival UV image111Based on observations made with the NASA/ESA Hubble Space Telescope, obtained from the Data Archive at the Space Telescope Science Institute, which is operated by the Association of Universities for Research in Astronomy, Inc., under NASA contract NAS 5-26555. These observations are associated with programme # 9470. (Fig. 1). No abundance determination has been done for fainter clusters. In this paper we derive for the first time oxygen abundances in the regions around clusters #3 and #7. Second, Izotov et al. (1997b) have found an oxygen abundance gradient along the major axis of SBS 0335–052E, with the highest abundance associated with the brightest cluster #1. We wish to study whether oxygen abundance variations are present in other regions of SBS 0335–052E as well. Third, we wish to check whether SBS 0335–052W is indeed the lowest-metallicity emission-line galaxy known.
| 0335–052E | ||||||
| Line | 0335–052W | NW | #7 | #4,5 | #3 | SE |
| 3727 [O ii] | 0.6460.026 | 0.2560.019 | 0.2590.009 | 0.2140.006 | 0.2820.005 | 0.2510.007 |
| 3750 H12 | … | … | … | … | 0.0270.003 | 0.0400.009 |
| 3771 H11 | … | … | 0.0540.013 | 0.0410.012 | 0.0390.003 | 0.0480.008 |
| 3797 H10 | … | … | 0.0780.011 | 0.0590.008 | 0.0540.003 | 0.0650.008 |
| 3820 He i | … | … | … | … | 0.0110.002 | … |
| 3835 H9 | … | … | 0.0890.009 | 0.0700.006 | 0.0710.003 | 0.0760.008 |
| 3869 [Ne iii] | 0.1220.013 | 0.2160.013 | 0.1730.006 | 0.2720.005 | 0.2710.005 | 0.2020.006 |
| 3889 He i + H8 | 0.1880.028 | 0.2150.019 | 0.1980.008 | 0.2060.006 | 0.1850.004 | 0.1810.008 |
| 3968 [Ne iii] + H7 | 0.2080.023 | 0.2690.020 | 0.2300.010 | 0.2420.006 | 0.2500.005 | 0.2330.008 |
| 4026 He i | … | … | … | … | 0.0170.001 | 0.0230.004 |
| 4101 H | 0.2600.020 | 0.2740.017 | 0.2600.008 | 0.2650.006 | 0.2640.004 | 0.2590.007 |
| 4340 H | 0.4760.021 | 0.4750.018 | 0.4760.010 | 0.4750.008 | 0.4730.007 | 0.4780.009 |
| 4363 [O iii] | 0.0470.010 | 0.0810.008 | 0.0790.004 | 0.1180.003 | 0.1110.002 | 0.0950.004 |
| 4471 He i | 0.0390.010 | … | 0.0370.003 | 0.0310.002 | 0.0360.001 | 0.0390.003 |
| 4658 [Fe iii] | … | … | … | 0.0040.002 | … | … |
| 4686 He ii | … | … | … | 0.0460.002 | 0.0210.001 | 0.0210.004 |
| 4711 [Ar iv] + He i | … | … | 0.0180.004 | 0.0170.002 | 0.0160.001 | 0.0190.003 |
| 4740 [Ar iv] | … | … | … | 0.0120.002 | 0.0110.001 | 0.0150.003 |
| 4861 H | 1.0000.025 | 1.0000.023 | 1.0000.017 | 1.0000.016 | 1.0000.015 | 1.0000.016 |
| 4921 He i | … | … | 0.0120.002 | 0.0100.005 | 0.0070.001 | 0.0120.003 |
| 4959 [O iii] | 0.4650.016 | 0.8010.018 | 0.7900.013 | 1.0840.017 | 1.0750.016 | 0.9390.015 |
| 4988 [Fe iii] | … | … | … | 0.0060.002 | 0.0030.001 | … |
| 5007 [O iii] | 1.4350.033 | 2.4040.046 | 2.4100.037 | 3.1870.048 | 3.2450.047 | 2.8910.044 |
| (H) | 0.025 | 0.160 | 0.140 | 0.260 | 0.430 | 0.000 |
| EW(H)a | 109 | 209 | 299 | 89 | 246 | 382 |
| (H)b | 6.3 | 39.6 | 56.7 | 113.7 | 310.2 | 82.4 |
| EW(abs)a | 3.4 | 1.1 | 5.0 | 1.2 | 0.1 | 2.6 |
a in Å.
b in units 10-16 erg s-1 cm-2.
| 0335–052E | ||||||
|---|---|---|---|---|---|---|
| Property | 0335–052W | NW | #7 | #4,5 | #3 | SE |
| (O iii), K | 197102460 | 199501210 | 19740550 | 21110390 | 20220260 | 19780490 |
| (O ii), K | 155901800 | 15610 870 | 15590400 | 15630260 | 15620190 | 15590360 |
| O+/H+, (105) | 0.5210.153 | 0.2060.033 | 0.2090.015 | 0.1720.009 | 0.2250.008 | 0.2030.013 |
| O2+/H+, (105) | 0.8390.239 | 1.3810.190 | 1.4090.089 | 1.6420.069 | 1.8110.057 | 1.6800.097 |
| O3+/H+, (107) | … | … | 1.9950.664 | 5.0150.102 | 2.1930.274 | 1.9100.794 |
| O/H, (105) | 1.3600.283 | 1.5860.193 | 1.6370.091 | 1.8630.071 | 2.0580.057 | 1.9010.098 |
| 12+log O/H | 7.130.08 | 7.200.05 | 7.210.02 | 7.270.02 | 7.310.01 | 7.280.02 |
| Ne2+/H+, (106) | 1.5910.455 | 2.7560.389 | 2.2570.152 | 3.0450.128 | 3.3430.105 | 2.6210.162 |
| (Ne) | 1.16 | 1.06 | 1.06 | 1.05 | 1.05 | 1.05 |
| Ne/H, (106) | 1.8510.738 | 2.9070.447 | 2.3910.176 | 3.1990.145 | 3.5130.120 | 2.7510.183 |
| log Ne/O | –0.870.20 | –0.740.09 | –0.840.04 | –0.770.03 | –0.770.02 | –0.840.04 |
2 Observations and Data Reduction
New spectra of SBS 0335–052W and SBS 0335–052E were obtained on 6 and 8 October, 2005 with the EFOSC2 (ESO Faint Object Spectrograph and Camera) mounted at the 3.6m ESO telescope at La Silla. The observing conditions were photometric during these two nights. All observations were performed with the same instrumental setup. We used the (3200–5200) grism with the 600 gr/mm grating and a long slit with a width of 12. This resulted in a spatial scale along the slit of 0157 pixel-1, and a spectral resolution of 6.2 Å (FWHM).
Both galaxies were observed at low airmass 1.2, so no correction for atmospheric refraction has been applied. The seeing was 07 – 08. The data were reduced with the IRAF222IRAF is the Image Reduction and Analysis Facility distributed by the National Optical Astronomy Observatory, which is operated by the Association of Universities for Research in Astronomy (AURA) under cooperative agreement with the National Science Foundation (NSF). software package.
The spectrum of the brightest region of SBS 0335–052W was obtained with the slit oriented along the parallactic angle and with an exposure time of 3600 s. SBS 0335–052E was observed in the two slit positions shown in Fig. 1. Slit 1 was centered on the isolated cluster #7 and oriented along the parallactic angle. Slit 2 had a position angle of –50∘ and was centered on clusters #4 and #5. The total exposure times for slits 1 and 2 were respectively 2400 and 2700 sec. We note that the morphology and the location of the clusters are similar in the UV (Fig. 1) and optical wavelengths (cf. Thuan et al., 1997; Papaderos et al., 1998), so that the placement of the slits during the spectroscopic observations, based on short acquisition exposures in , is correctly represented in Fig. 1.
We show in Fig. 2 the distribution of the H emission line flux (solid line) and that of the continuum flux near H (dotted line), together with the regions used to extract one-dimensional spectra. These are shown in panels b) through f) in Fig. 3. Examination of panel b in Fig. 2 reveals that near the axis origin, the flux distribution of the H line is slightly offset (by 1″) relative to that of the continuum, with the first distribution peaking on cluster #3 and the second one peaking on clusters #4 and #5. This shift is also reflected in the equivalent width of the H line of clusters #4 and #5 which, at 89 Å, is almost three times lower than the one of cluster #3 (cf. Table 1). The fact that the maximum of the optical continuum emission coincides with the position of clusters #4 and #5 ensures that the visually chosen center of slit 2 was not offset due to strong off-center nebular line emission.
Despite the small angular separation between the various clusters in SBS 0335–052E, contamination of cluster #3 by the fainter emission from the H ii region around clusters #4 and #5 and from the northeastern periphery of clusters #1 and #2 is relatively low, as can be seen from Figs. 1 and 2b. However, it is likely that contamination of clusters #4 and #5 by the emission from the H ii region associated with cluster #3 is more important, making the abundance determination of the H ii region associated with clusters #4 and #5 less reliable.
The flux-calibrated spectra of the brightest region of SBS 0335–052W and of different regions in SBS 0335–052E are shown in Fig. 3. The aperture within which each spectrum was extracted is given in the upper-left part of each panel. The spectra were corrected for interstellar extinction using the reddening curve of Whitford (1958) and for redshift.
Emission-line fluxes were measured using Gaussian profile fitting. The errors of the line fluxes were calculated from the photon statistics in the non-flux-calibrated spectra. They have been propagated in the calculations of the elemental abundance errors. The extinction-corrected emission line fluxes () relative to the H fluxes, the extinction coefficients (H), the equivalent widths EW(H), the observed H fluxes (H) and the equivalent widths EW(abs) of the hydrogen absorption lines are listed in Table 1.
3 Results
3.1 Physical Conditions and Element Abundances
The electron temperature , the ionic and total heavy element abundances were derived following Izotov et al. (2005b). In particular for the O2+ and Ne2+ ions, we adopt the temperature (O iii) derived from the [O iii] 4363/(4959 + 5007) emission-line ratio. The O+ abundances were derived with the temperature (O ii). The latter was obtained from the relation between (O iii) and (O ii) derived by Izotov et al. (2005b). Observations with the 3.6m telescope were obtained in the blue region, so the [S ii] 6717, 6731 emission lines usually used for the determination of the electron number density were out of the observed spectral range. Therefore for abundance determinations, we have adopted = 100 cm-3. The precise value of the electron number density makes little difference in the derived abundances since in the low-density limit which holds for the H ii regions considered here, the element abundances do not depend sensitively on . The electron temperatures (O iii) and (O ii) respectively for the high- and low-ionization zones in the H ii regions, the ionization correction factors (s), the ionic and total oxygen and neon abundances are given in Table 2.
The oxygen abundance in SBS 0335–052W is 12 + log O/H = 7.13 0.08. Thus, despite the faintness of this galaxy and the large errors in its abundance determination, the derived oxygen abundance is consistent with the value 12 + log O/H = 7.12 0.03 found by Izotov et al. (2005a) from higher signal-to-noise ratio observations. The highest oxygen abundance in SBS 0335–052E, 12 + log O/H = 7.31 0.01, is determined at the H ii region around cluster #3. This region is also characterized by the highest reddening, (H) = 0.43. The derived oxygen abundance is the same as the value 12 + log O/H = 7.31 0.01 found by Thuan & Izotov (2005) for the brightest part (clusters #1 and #2) of SBS 0335–052E. The oxygen abundances in other regions of SBS 0335–052E are lower, with the lowest values occurring in the NW region (7.20 0.05) and in the H ii region around cluster #7 (7.21 0.02). These low values are comparable to the oxygen abundances of 7.17 0.01 and 7.22 0.02 determined respectively by Thuan & Izotov (2005) for the NW and SE components of the BCD I Zw 18. Thus, it is clear that the oxygen abundance in SBS 0335–052E shows variations of up to 0.1 dex on spatial scales of 1 kpc (1″ corresponds to 260 pc at the adopted distance of = 54.3 Mpc to SBS 0335–052E).
Our results suggest a trend for the oxygen abundance in SBS 0335-052E to decrease from the brightest part of the galaxy to its outer fainter parts, in agreement with the finding of Izotov et al. (1997b). Thuan et al. (1997) and Papaderos et al. (1998) have found a systematic increase in the colours of the clusters away from the optically brightest ones (clusters #1 and #2). This trend is probably due to the combined effect of differential extinction by dust and the colour evolution of stellar clusters formed sequentially in a propagating star formation process from the NW region of the galaxy to its SE region. Clusters #1, #2 and #3 are the youngest ones, while clusters #4 and #5 are older, as evidenced by their lower H equivalent width. In that scenario, the larger abundances of clusters #1, #2 and #3 may be interpreted as an effect of self-enrichment (Kunth & Sargent, 1986) in these young clusters.
The Ne/O abundance ratios in the two BCDs are consistent within the errors with the ratios obtained for other metal-deficient galaxies (Izotov & Thuan, 1999).
3.2 Wolf-Rayet Stars
In the spectrum of cluster #3 (Fig. 4), we detect a broad emission feature at 4658 Å (labeled “WR”). This feature is coincident with the [Fe iii]4658 nebular emission line but its width is much larger than those of other nebular emission lines in the spectrum of cluster #3. We interpret therefore the broad feature as due mainly to the stellar Wolf-Rayet (WR) emission line C iv 4658, a signature of WC4 stars. This would make SBS 0335–052E the second most metal-deficient galaxy, after I Zw 18 (Izotov et al., 1997a; Legrand et al., 1997), in which a WR stellar population has been detected. The total 4658 flux, corrected for the interstellar extinction (H) = 0.43, is equal to 4.810-16 erg s-1 cm-2. To correct for the contribution of the [Fe iii] 4658 emission line, we use the flux of another iron emission line seen in the spectrum of cluster #3, [Fe iii] 4988 (Table 1, Fig. 4). Adopting the mean [Fe iii] 4988/4658 flux ratio to be 1.5, as obtained from the BCD sample of Thuan & Izotov (2005), the [Fe iii]4658 flux is about 1.710-16 erg s-1 cm-2. Correcting for it gives (C iv4658) = 3.110-16 erg s-1 cm-2. This corresponds to a luminosity (C iv) = 1.41038 erg s-1 or to an equivalent number of WC4 stars (WC4) = 3, if we adopt 51036 erg s-1 (Schaerer & Vacca, 1998; Guseva et al., 2000) for the luminosity of one WC4 star. The number of O7v stars derived from the H luminosity, following Guseva et al. (2000), is (O7v) 800, giving a WC4-to-O7v number ratio of 0.003. This number ratio is consistent with the one predicted by stellar population synthesis models at the metallicity of SBS 0335–052E (Schaerer & Vacca, 1998). The non-detection of WR features in previous spectroscopic studies of SBS 0335-052E which focused on clusters #1,2 and #4,5, can probably be understood as a result of the very short duration of the WR stage (1 Myr) in low-metallicity stellar clusters, as only the most massive short-lived stars go through this stage. We are therefore just lucky to catch stars going through the WR stage in cluster #3. We note that a similar situation holds in I Zw 18: Brown et al. (2002) have detected WR stars only in two very compact clusters associated with the NW star-forming component of the galaxy, but WR features are not seen in its SE component.
Recently Crowther & Hadfield (2005) have shown that the line luminosities of extremely low-metallicity WC4 stars, such as those observed in cluster #3 and in I Zw 18, are 3 – 6 times lower than those predicted by Schaerer & Vacca (1998). This would result in an increase of (WC4) to 9 – 18. A further search for Wolf-Rayet stellar populations in cluster #3 as well as in other regions of SBS 0335-052E would be of great interest. To confirm the detection of WC4 stars and to better determine their number, better observations of the broad C iv 5808 emission line are necessary. It is also important to search for spectroscopic features of late nitrogen WR (WNL) stars which, from stellar evolutionary considerations, are likely present in cluster #3. The weakness of the N iii 4640 and He ii 4686 emission lines and the absence of appreciably broad emission in those lines (Fig. 4) precludes the determination of (WNL) from the present spectra. Nevertheless, we can conclude from our data that Wolf-Rayet stars are present in cluster #3 of SBS 0335-052E, and that their number is likely greater than 10.

4 Summary
We present 3.6m ESO telescope spectroscopic observations of the system of the two extremely metal-deficient blue compact dwarf (BCD) galaxies SBS 0335–052W and SBS 0335–052E. The oxygen abundance in SBS 0335–052W is 12 +log O/H = 7.13 0.08, confirming the earlier finding by Izotov et al. (2005a) that this BCD is the most metal-deficient emission-line galaxy known. As for SBS 0335–052E, its oxygen abundance varies from region to region between 7.20 and 7.31, suggesting a metallicity gradient over a spatial scale of 1 kpc. We thus confirm and extend the finding by Izotov et al. (1997b) of an abundance gradient in SBS 0335–052E. In cluster #3 of SBS 0335–052E, we find evidence for the presence of early carbon-type Wolf-Rayet (WR) stars, making this galaxy the second most-metal deficient galaxy with a detected WR stellar population, after I Zw 18.
Acknowledgements.
P.P. would like to thank Gaspare Lo Curto, Lorenzo Monaco, Carlos La Fuente, Eduardo Matamoros and the whole ESO staff at the La Silla Observatory for their support. Y. I. I. and N. G. G. thank the hospitality of the Institute for Astrophysics (Göttingen), the support of the DFG grant No. 436 UKR 17/25/05 and of the grant No 02.07.00132 from the Ukrainian Fund of Fundamental Investigations. Y. I. I. and T. X. T. acknowledge the partial financial support of NSF grant AST 02-05785. T. X. T. thanks the hospitality of the Institut d’Astrophysique in Paris and of the Service d’Astrophysique at Saclay during his sabbatical leave. He is grateful for a Sesquicentennial Fellowship from the University of Virginia. The research described in this publication was made possible in part by Award No. UP1-2551-KV-03 of the US Civilian Research & Development Foundation for the Independent States of the Former Soviet Union (CRDF).References
- Brown et al. (2002) Brown, T.M., Heap, S. R., Hubeny, I., Lanz, T. Lindler, D. 2002, ApJ, 579, L75
- Crowther & Hadfield (2005) Crowther, P. A., & Hadfield, L. J. 2005, A&A, in press; preprint astro-ph/0512183
- Guseva et al. (2000) Guseva, N. G., Izotov, Y. I., & Thuan, T. X. 2000, ApJ, 531, 776
- Izotov et al. (1990) Izotov, Y. I., Guseva, N. G., Lipovetsky, V. A., Kniazev, A. Y., & Stepanian, J. A. 1990, Nature, 343, 238
- Izotov et al. (1997a) Izotov, Y. I., Chaffee, F. H., Foltz, C. B., Green, R. F., Guseva, N. G., & Thuan, T. X. 1999a, ApJ, 527, 757
- Izotov et al. (1997b) Izotov, Y. I., Lipovetsky, V. A., Chaffee, F. H., Foltz, C. B., Guseva, N. G., & Kniazev, A. Y. 1997b, ApJ, 476, 698
- Izotov & Thuan (1999) Izotov, Y. I., & Thuan, T. X. 1999, ApJ, 511, 639
- Izotov et al. (1999) Izotov, Y. I., Chaffee, F. H., Foltz, C. B., et al. 1999, ApJ, 527, 757
- Izotov et al. (2005a) Izotov, Y. I., Thuan, T. X., & Guseva, N. G. 2005a, ApJ, 415, 87
- Izotov et al. (2005b) Izotov, Y. I., Stasińska, G., Meynet, G., Guseva, N. G., & Thuan, T. X. 2005b, A&A, in press; preprint astro-ph/0511644
- Kunth & Sargent (1986) Kunth, D., & Sargent, W. L. W. 1986, ApJ, 300, 496
- Legrand et al. (1997) Legrand, F., Kunth, D., Roy, J.-R., Mas-Hesse, J. M., & Walsh, J. R. 1997, A&A, 326, L17
- Melnick et al. (1992) Melnick, J., Heydari-Malayeri, M., & Leisy, P. 1992, A&A, 253, 16
- Papaderos et al. (1998) Papaderos, P., Izotov, Y. I., Fricke, K. J., Thuan, T. X., & Guseva, N. G. 1998, A&A, 338, 43
- Pustilnik et al. (1997) Pustilnik, S. A., Lipovetsky, V. A., Izotov, Y. I., et al. 1997, Ast.L., 23, 308
- Pustilnik et al. (2001) Pustilnik, S. A., Brinks, E., Thuan, T. X., Lipovetsky, V. A., & Izotov, Y. I. 2001, AJ, 121, 1413
- Pustilnik et al. (2004) Pustilnik, S. A., Pramskij, A. G., & Kniazev, A. Y. 2004, A&A, 425, 51
- Schaerer & Vacca (1998) Schaerer, D., & Vacca, W. D. 1998, ApJ, 497, 618
- Thuan & Izotov (2005) Thuan, T. X., & Izotov, Y. I. 2005, ApJS, 161, 240
- Thuan et al. (1997) Thuan, T. X., Izotov, Y. I., & Lipovetsky, V. A. 1997, ApJ, 477, 661
- Whitford (1958) Whitford, A. E. 1958, AJ, 63, 201