Spitzer/MIPS galaxies: the link to near-IR galaxies and the cosmic IR background
Abstract
We present the results of our most recent works on Spitzer/MIPS galaxies. Through a multiwavelength analysis, we study different properties (redshifts, luminosities, stellar masses) characterising the sources which produce the bulk of the mid-IR background. From a comparative study with the total population of -selected galaxies, we determine that sources account for an important fraction of the most massive galaxies present at different redshifts. On the other hand, we determine that galaxies also produce most of the energy contained in the far-IR cosmic background at 70 and . Furthermore, we are able to set tight constraints on the Cosmic Infrared Background (CIB) spectral energy distribution (SED). Our results help to clarify the links between these presumably different IR galaxy populations.
Institut d’Astrophysique Spatiale (IAS), bât. 121, F-91405 Orsay, France; Université Paris-Sud 11 and CNRS (UMR 8617)
1. Introduction
The Cosmic Infrared Background (CIB) accounts for roughly half of the total energy produced by extragalactic sources (e.g. Hauser & Dwek 2001). Since the discovery of the CIB (Puget et al. 1996), it has been recognised that the study of infrared (IR) extragalactic sources is fundamental to understand galaxy formation and evolution. As IR emission is produced by the dust re-processing of UV/optical light, IR sources constitute directly the signposts of star formation or accretion activity in the Universe.
The determination of the properties characterising IR galaxies and the link between the IR and other galaxy populations have been a matter of study since the first IR missions (IRAS, ISO). With the advent of Spitzer (Werner et al. 2004), our comprehension of the nature and composition of the CIB has very much improved. Numerous works presented during this conference have shown how much progress we have made in understanding IR galaxies up to high redshifts .
In this paper, we summarize our recent studies of the properties of mid-IR galaxies and their contribution to other wavelength domains. In particular, in Section 3, we analyze the role of the most luminous mid-IR galaxies in the evolution of the most massive -band galaxies. In Section 4, we constrain the contribution of mid-IR galaxies to the far-IR background and give new estimates for the CIB. Finally, in Section 5, we briefly discuss the implications of our work.
2. Properties of the sources composing the background
Caputi et al. (2006a) studied different properties of the sources composing the bulk of the background in the Great Observatories Origins Deep Survey / Chandra Deep Field South (GOODS/CDFS). Observations of the CDFS have been carried out with the Multiband Imaging Photometer for Spitzer (MIPS; Rieke et al. 2004), as part of the Guaranteed Time Observers (GTO) program. Using a deep (, Vega) galaxy sample, Caputi et al. (2006a) identified of the sources with in the GOODS/CDFS. Taking advantage of the excellent quality multiwavelength photometry and spectroscopic coverage of this field, they determined the redshift distribution, IR luminosities and stellar masses characterising galaxies.
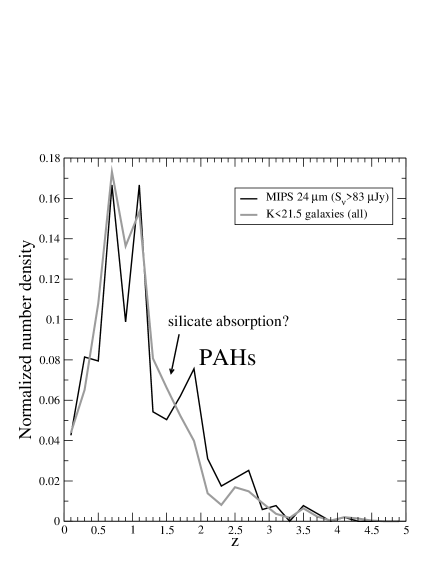
Figure 1 shows the normalized redshift distributions of the galaxies in comparison to the distribution of all the -band galaxies in the GOODS/CDFS. These populations are composed by and 3000 objects, respectively, over an area of 130 arcmin2. Several features are present in both distributions, which are the consequence of known large-scale structure in the GOODS/CDFS. In contrast, we observe the existence of a bump in the redshift distribution of galaxies at redshift , which does not appear for the total galaxy population. This peak in the redshift distribution has been predicted by Lagache et al. (2004) and is the consequence of the selection effect produced by the presence of PAH emission features entering the observed band. Given the width of the filter (whose transmission covers the wavelength range ), both the 7.7 and the PAH lines could contribute to the redshift distribution peak observed at . Our results show that PAH molecules must already be present in a significant amount of star-forming galaxies at high redshifts.
Using the empirical calibrations obtained by Chary & Elbaz (2001) and Elbaz et al. (2002) between mid-IR luminosities and bolometric IR luminosities , Caputi et al. (2006a) computed bolometric IR luminosity estimates for all their star-forming galaxies. On the other hand, they modelled the optical/near-IR spectral energy distributions (SEDs) of these galaxies, including Spitzer/IRAC (Infrared Array Camera) and data. This allowed them to obtain rest-frame -band luminosities and derived stellar masses.
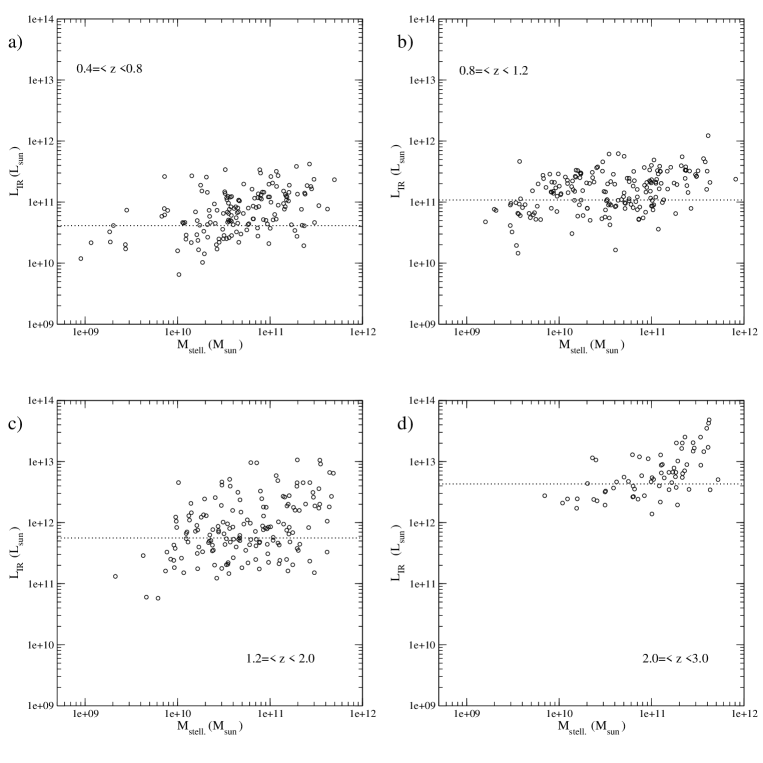
Figure 2 shows the evolution of the IR luminosity () versus stellar mass () plane as a function of redshift. Panel a) shows that most of the galaxies at redshifts have infrared luminosities . The maximum observed infrared luminosities increase with redshift, and luminous infrared galaxies (LIRGs) characterized by are the dominant population at redshifts (cf. also Le Floc’h et al. 2005). The majority of the mid-IR sources at are hosted by intermediate-mass galaxies with stellar masses , although some more massive galaxies could also be classified as LIRGs at these redshifts. Within our surveyed area, there is virtually no ultra-luminous infrared galaxy (ULIRG) with at . ULIRGs might be present at these low redshifts, but are indeed very rare (e.g. Flores et al. 1999). At , ULIRGs start to be the dominant population ( 65% at ). Most of them are intermediate to high-mass galaxies. At , we observe sources with extremely high infrared luminosities mainly harboured by galaxies with stellar masses .
For star-forming galaxies, an IR luminosity corresponds to a star-formation rate (Kennicutt 1998). The analysis of X-ray data and IRAC colour-colour diagrams suggests that only a minor fraction of IR galaxies could be mainly driven by quasar activity (Caputi et al. 2006b). Thus, the bulk of the IR emission in most galaxies must be produced by star-formation activity, whose rates can achieve extremely high values () at high redshifts.
The large characterising some systems at imply that a few starburst episodes lasting yr might be sufficient to build up the stellar mass of some massive () galaxies at these redshifts. Thus, the burst-like mode of star formation appears to have been a very efficient way of constructing massive galaxies in the past. On the contrary, at lower redshifts, the efficiency of the burst-like mode of star-formation to construct entire galaxies is limited to lower mass systems. A significant fraction () of massive galaxies experience star-formation activity at lower redshifts, but this star formation only produces an additional minor amount of the stellar mass already present in these systems (Caputi et al. 2006a,b).
3. The role of sources in the evolution of -band galaxies
Near-IR surveys are traditionally used to trace stellar mass at different redshifts. The study of the role of mid-IR galaxies within the context of the total near-IR-selected galaxy population should allow, then, to understand the importance of star formation and accretion activity in galaxies of different stellar mass.
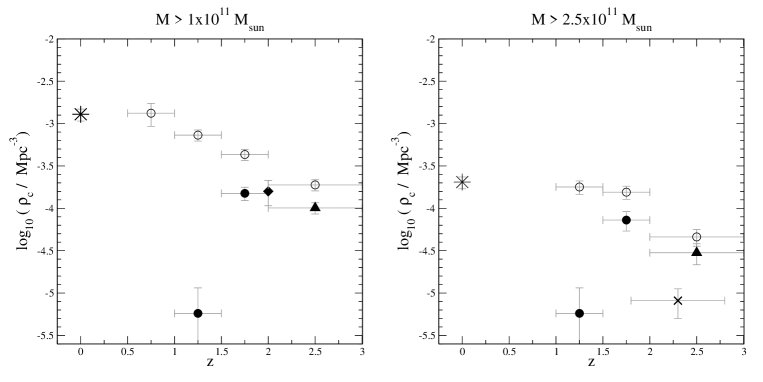
Caputi et al. (2006b) studied the role of the LIRG and ULIRG phases in the evolution of massive -band galaxies, using the same sample in the GOODS/CDFS as analyzed in Section 2. They found that LIRGs and ULIRGs only constitute a fraction of the massive () galaxies present at different redshifts, but this fraction becomes very important () at .
Certainly, from Figure 3 we can see that ULIRGs trace a substantial fraction of massive galaxies at high redshifts. The density of ULIRGs sharply decreases below , but LIRGs still constitute of the galaxies with .
4. The contribution of galaxies to the far-IR background
In the previous section we have explained the importance of 24 m galaxies within the population of massive galaxies. However, one could wonder whether galaxies selected at 24 m are actually representative of the galaxy populations selected at other IR wavelengths.
To explore this issue, Dole et al. (2006) studied the contribution of Spitzer/ MIPS 24 m galaxies to the Far-Infrared (FIR) Background at 70 and 160 m, using stacking analysis over an area of 0.85 deg2. This technique consist in studying the integrated light at 70 and 160 of all the resolved 24 m sources. Resolved 24 m sources make up of the 24 m background (Papovich et al. 2004; Dole et al. 2006). However, due to confusion, resolved 70 and 160 m sources only can explain a minor fraction of the respective 70 and 160 m backgrounds. Dole et al. (2006) showed that the stacking analysis allows to gain an order of magnitude below the confusion level. They determined that 24 m sources account for 92 and 69% of the 70 and 160 m backgrounds, respectively. This is the first measurement of the contribution of 24 m galaxies to the far-IR cosmic background.
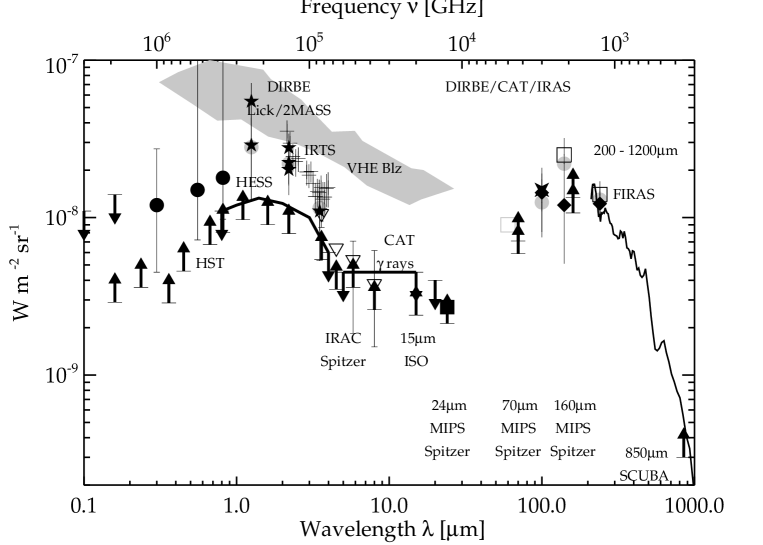
Figure 4 shows the SED of the Extragalactic Background Light (EBL). Surveys conducted with different UV/optical to submillimetre facilities have progressively allowed to put constraints on this SED at different wavelengths. The arrows at 24, 70 and 160 m indicate the lower limits on the IR background determined through the stacking analysis of 24 m sources performed by Dole et al. (2006). Unlike all previous determinations, the stacking analysis allowed to obtain a precise direct measurement of the EBL in this wavelength range.
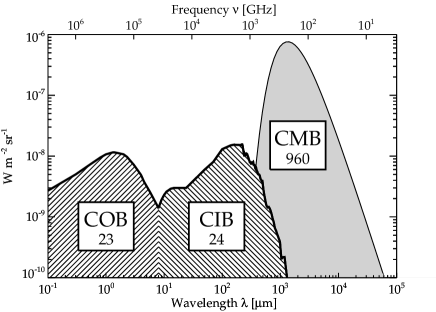
The determined intensity of the CIB is 24 nW m-2 sr-1. This intensity is similar to that of the Cosmic Optical Background (COB). Put another way, half of the energy associated to galaxy formation and evolution directly comes from starlight, while the other half is due to the light reprocessed by the dust. However, altogether, the energy budgets of the COB and the CIB are equivalent to only 5% of the energy contained in the Cosmic Microwave Background (CMB; Dole et al. 2006). This percentage represents the fraction of the energy which has been produced after recombination. The comparison of intensities of the different background SEDs is illustrated in figure 5.
5. Conclusions
Spitzer is making possible an unprecedented study of the mid-IR Universe and to set important constraints on the links between the mid-IR and other galaxy populations. On the one hand, we have shown that mid-IR sources constitute a significant fraction of the already-assembled massive galaxies at different redshifts. This implies that star-formation and accretion processes play a fundamental role in the evolution of massive galaxies through cosmic time. On the other hand, we have determined that those galaxies composing the 24 m background are also responsible for most of the extragalactic energy produced at 70 and 160 m. In conjunction, our results demonstrate that the importance of studying mid-IR galaxies extends beyond the mid-IR domain and this study is necessary to achieve a unified picture of galaxy populations.
References
- (1) Caputi, K. I., Dole, H., Lagache, G., et al., 2006a, ApJ, 637, 727
- (2) Caputi, K. I., Dole, H., Lagache, G., et al., 2006b, A&A, in press
- (3) Chapman, S. C., Blain, A. W., Ivison, R. J., & Smail, I. R. 2003, Nature, 422, 695
- (4) Chary, R., Elbaz, D. 2001, ApJ, 556, 562
- (5) Daddi, E., Dickinson, M., Chary, R., et al., 2005, ApJ, 631, L13
- (6) Dole, H., Lagache, G., Puget, J.-L., et al., 2006, A&A, in press (astro-ph/0603208)
- (7) Elbaz, D., et al. 2002, A&A, 384, 848
- (8) Flores, H., Hammer, F., Thuan, T. X., et al. 1999, ApJ, 517, 148
- (9) Hauser, M. G & Dwek, E., 2001, ARA&A, 37, 249
- (10) Kennicutt, R.C. Jr. 1998, ApJ, 498, 541
- (11) Lagache, G., Dole, H., Puget, J.-L., et al., 2004, ApJS, 154, 112
- (12) Le Floc’h, E., Papovich, C., Dole, H., et al., 2005, ApJ, 632, 169
- (13) Papovich, C., Dole, H., Egami, E., et al., 2004, ApJS, 154, 70
- (14) Puget, J.-L, Abergel, A., Bernard, J.-P, et al., 1996, A&A, 308, L5
- (15) Rieke, G. H., Young, E. T., Engelbracht, C. W., et al. 2004, ApJS, 154, 25
- (16) Werner, M. W., Roellig, T. L., Low, F. J., et al., 2004, ApJS, 154, 1