A Strong X-Ray Flux Ratio Anomaly in the Quadruply Lensed Quasar PG 1115+0801
Abstract
PG 1115+080 is a quadruply lensed quasar at whose image positions are well fit by simple models of the lens galaxy (at ). At optical wavelengths, the bright close pair of images exhibits a modest flux ratio anomaly (factors of 1.2–1.4 over the past 22 years) with respect to these same models. We show here that as observed in X-rays with Chandra, the flux ratio anomaly is far more extreme, roughly a factor of 6. The contrasting flux ratio anomalies in the optical and X-ray band confirm the microlensing hypothesis and set a lower limit on the size of the optical continuum emission region that is 10–100 times larger than expected from a thin accretion disk model.
Subject headings:
gravitational lensing — quasars: individual (PG 1115+080)1. Introduction
PG 1115+080 was the second gravitationally lensed quasar to be discovered, and the first found to be quadruple (Weymann et al., 1980). It has been the subject of numerous studies at wavelengths ranging from radio to mid-infrared to optical to UV to X-ray. The lensing galaxy is a member of a small group of galaxies, the tide from which produces the quadrupole moment needed to produce four images (Kundic et al., 1997). It was the first gravitationally lensed system to yield multiple time delays (Schechter et al., 1997). The optical images show uncorrelated flux variations on a timescale of order one year, presumably the result of microlensing by stars in the lensing galaxy (Foy et al., 1985).
PG 1115+080 is an example of what Saha & Williams (2003) call an “inclined quad,” a system with a close, bright pair of images that results when a lensed source lies just inside a “fold” caustic (Keeton, Gaudi, & Petters, 2005). Several very similar systems have subsequently been discovered (Hewitt et al., 1992; Morgan et al., 2004; Reimers et al., 2002; Inada et al., 2003). In each case, one of the two close images is a minimum of the light travel time surface, and the other is a saddlepoint. From quite general considerations, if the gravitational potential is smooth, one expects the close, bright pair to be mirror images of each other and therefore very nearly equal in brightness (Metcalf & Zhao, 2002). All of the known inclined quads violate this prediction, despite the fact that such models fit the observed image positions to within a few percent. This phenomenon has come to be known as the “flux ratio anomaly” problem.
In this regard PG 1115+080 is the least anomalous among the inclined quads. In the earliest images that resolved the close pair, the ratio of the flux of the saddlepoint () to that of the minimum () was very nearly unity (Vanderriest et al., 1986). By the mid-1980s the ratio had decreased to . Recent optical observations (see §2.2) give a ratio closer to . By contrast the corresponding optical ratios for inclined quads WFI J20264536, HS 0810+2554, MG 0414+0534, and SDSS J0924+0219 are approximately , , , and , respectively (Morgan et al., 2004; Reimers et al., 2002; Schechter & Moore, 1993; Inada et al., 2003). For this last case, Keeton et al. (2005) argue that microlensing by stars (rather than millilensing by dark matter subcondensations) is responsible for the anomaly. Peeples et al. (2004) and Morgan et al. (2006) predict a substantial brightening of the faint saddlepoint in SDSS J0924+0219 on a timescale of roughly one decade if the microlensing hypothesis is correct.
Peeples et al. (2004) argue that the saddlepoint in PG 1115+080 would likewise be expected to get substantially (a factor of 2 or more) fainter on a similar timescale. But over the course of a quarter century PG 1115+080 has declined to cooperate, at least at optical wavelengths.
In the present paper we report that PG 1115+080 has indeed been exhibiting microlensing of the expected amplitude, but at X-ray wavelengths rather than at optical wavelengths. In §2 we describe the X-ray and optical observations and our analysis. In §3 we discuss implications for the lensing galaxy and for the relative sizes of the quasar’s optical and X-ray emitting regions. We summarize our conclusions in §4. Throughout, we assume a “concordance” cosmology with , , and .
2. Observations and Analysis
2.1. X-ray observations
PG 1115+080 was observed for 26.5 ks on 2000 Jun 02 (ObsID 363) and for 9.8 ks on 2000 Nov 03 (ObsID 1630) with the Chandra X-ray Observatory’s Advanced CCD Imaging Spectrometer (ACIS). These observations were used by Grant et al. (2004) to study the X-ray properties of the lensing group of galaxies. The data were taken in timed-exposure mode with an integration time of 3.24 s per frame, and the telescope aimpoint was on the back-side illuminated S3 chip. The data were telemetered to the ground in faint mode.
The data were downloaded from the Chandra archive, and reduction was performed using the CIAO 3.3 software provided by the Chandra X-ray Center111http://asc.harvard.edu. The data were reprocessed using the CALDB 3.2.1 set of calibration files (gain maps, quantum efficiency, quantum efficiency uniformity, effective area) including a new bad pixel list made with the acis_run_hotpix tool. The reprocessing was done without including the pixel randomization that is added during standard processing. This omission slightly improves the point spread function. The data were filtered using the standard ASCA grades and excluding both bad pixels and software-flagged cosmic ray events. Intervals of strong background flaring were searched for, but none were found.
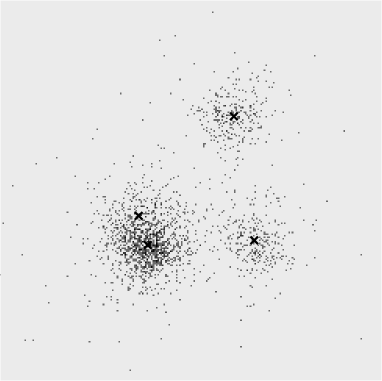
For each observation, an image was produced in the 0.5–8 keV band with a resolution of 00246 per pixel (see Figure 1). To determine the intensities of each lensed quasar image, a two-dimensional model consisting of four Gaussian components plus a constant background was fit to the data. The background component was fixed to a value determined from a source-free region near the lens. The relative positions of the Gaussian components were fixed to the separations determined from Hubble Space Telescope observations (Kristian et al., 1993), but the absolute position was allowed to vary. Each Gaussian was constrained to have the same full-width at half-maximum, but this value was allowed to float. The fits were performed in Sherpa (Freeman et al., 2001) using Cash statistics (Cash, 1979) and the Powell minimization method. The intensity ratios (relative to image C) are listed in Table 1. The best-fit full-width at half maximum (fwhm) was for ObsID 363 and for ObsID 1630; both consistent with the overall width of the instrumental point spread function (PSF) as found in the Chandra PSF Library (Karovska et al., 2001) supplied by the Chandra X-ray Center. In addition to the Gaussians, models of the form were also tried; these gave similar results to the values in Table 1.
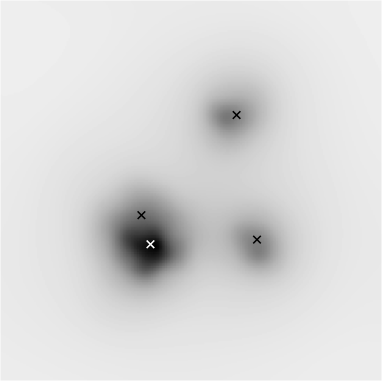
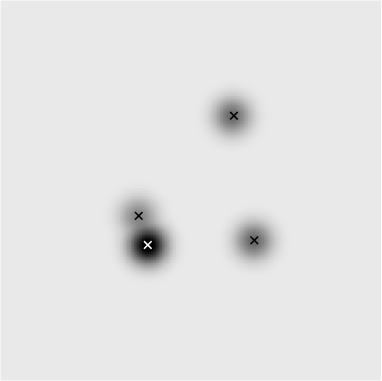
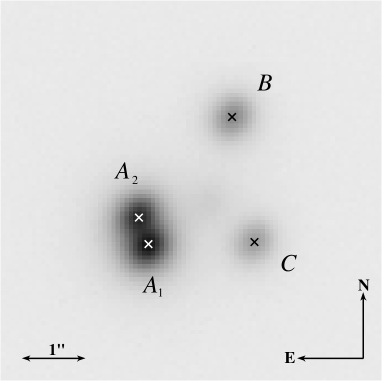
Based on the best fit Gaussian shape and the relative intensities, we constructed a “pseudo” maximum entropy method (MEM) representation of the data. Here we have simply plotted Gaussians of a common width (fwhm = ), with the fitted intensities and at the fitted locations (see Table 1). We used the largest source width consistent (at 3 confidence) with no blurring of the intrinsic Chandra PSF. A maximum likelihood deconvolution of the image is presented by Chartas et al. (2004) and appears consistent with our “pseudo” MEM image.
| Ratio | ObsID 363 | ObsID 1630 | Model |
|---|---|---|---|
| 3.91 | |||
| 3.73 | |||
| 0.67 | |||
| 0.96 |
Spectra of the quasar images were extracted using the ACIS Extract package v3.94 (Broos et al., 2002). A single spectrum of and was extracted because of the significant overlap, but and were extracted separately. Both the Chandra effective area and PSF are functions of energy, and ACIS Extract corrected the effective area response for each spectrum based on the fraction of the PSF enclosed by the extraction region (at 1.5 keV, these fractions were 0.9 for , 0.8 for , and 0.9 for ). The spectra were grouped to contain at least ten counts per bin, and fitting was performed in Sherpa using a simple absorbed power law model. The column density was fixed at the Galactic value of cm-2 (Dickey & Lockman, 1990). The individual fits were all acceptable and yielded consistent results, so joint fits were performed with the power law indices tied to each other and the normalizations allowed to float. The best fit photon index for ObsID 363 is and for ObsID 1630 is , which compares well with the values found from the fits of image C alone ( and , respectively). Based on the individually fitted power laws, the unabsorbed 0.5–8 keV flux of image C is in ObsID 363 and in ObsID 1630. These serve as useful reference fluxes since image C is fairly uncontaminated by flux from the other images and is also a minimum image and therefore less susceptible to fluctuations.
ACIS Extract was also used to obtain light curves from the above extraction regions for each observation. No significant signs of short-term variability were found within either observation; Kolmogorov-Smirnov tests showed that each light curve had a greater than 10% chance of being consistent with a constant count rate. The light curve for the region is plotted in Figure 2.
Given the time delays among the lensed images, it is fair to ask if intrinsic short-term quasar variability combined with a time delay could masquerade as a genuine X-ray flux ratio anomaly. We can rule this out in the X-ray band for ObsID 363. The time delay between and from our lens model (see §3.1) is ks (with leading). The 26.5 ks observation therefore covers 1.8 time delay cycles. If we split the observation into two equal parts, we obtain the same ratio as in Table 1. To produce this ratio as well as the constant lightcurve in Figure 2 purely by variability is highly implausible.

2.2. Optical observations
PG 1115+080 has been observed repeatedly with the Magellan 6.5-meter Baade and Clay telescopes at Las Campanas Observatory between 2001 March and 2006 February using the Raymond and Beverly Sackler Magellan Instant Camera (MagIC). The instrument has a scale of 00691 per pixel and a 2.36 arcminute field. We present here results from three epochs for which the seeing was especially good, making the decomposition of and easier and less uncertain, and reducing the contamination from the lensing galaxy. Three 60-second exposures were obtained with a Johnson V filter on UT 2001 March 26. Two 60-second exposures each were obtained obtained with a Sloan filter on UT 2004 Feb 22 and 2005 June 07.
The data were flattened using standard procedures. ClumpFit, an empirical PSF-fitting photometry program based on DoPHOT, was used to measure fluxes and positions for the four quasar images and for the lensing galaxy. The profile for the galaxy was taken to be an elliptical pseudo-Gaussian. As we presently concern ourselves only with flux ratios, we have not put our photometry onto a standard system. The fluxes for the , and images are given relative to the image, for which the microlensing fluctuations are expected to be smallest. It should be remembered that variations of 0.1 mag have been seen on a timescale of weeks and that image leads the images and the image by 10 and 25 days, respectively (Schechter et al., 1997; Barkana, 1997). The results of our photometry are given in Table 2, along with selected results (typically those obtained in the best seeing) from prior epochs.
We note that the flux ratios for contemporaneous observations appear to be consistent to within a few percent over the optical wavelength region. We therefore make no attempt to account for bandpass in presenting the present and past optical results.
| Magnitude differences | Flux ratios | |||||
|---|---|---|---|---|---|---|
| UT date | Filter | FWHM | ||||
| 1984 Mar 26aaVanderriest et al. (1986) | B | 075 | 0.41 | |||
| 1985 Mar 19aaVanderriest et al. (1986) | V | 062 | 0.49 | |||
| 1986 Feb 19bbChristian et al. (1987) | V | 06 | 0.48 | |||
| 1986 Feb 19bbChristian et al. (1987) | B | 06 | 0.48 | |||
| 1991 Mar 03ccKristian et al. (1993) | F785LP | HST | 0.50 | |||
| 1991 Mar 03ccKristian et al. (1993) | F555W | HST | 0.50 | |||
| 1995 Dec 20d,ed,efootnotemark: | V | 085 | 0.47 | |||
| 2001 Mar 26eepresent work | V | 056 | 0.42 | |||
| 2004 Feb 22eepresent work | 048 | 0.42 | ||||
| 2005 Jun 07eepresent work | 043 | 0.42 | ||||
| \colrule | ||||||
| Lens Model | 0.44 | 0.96 | ||||
3. Discussion
3.1. Modeling the lens
Using Keeton’s (2001) Lensmodel software, we modeled the lensing potential as a singular isothermal sphere accompanied by a second, offset singular isothermal sphere, which provides a quadrupole moment. This choice of model was motivated by the presence of a group of galaxies to the southwest of the lensing galaxy. We used the image positions provided by the CASTLES Lens Survey222http://www.cfa.harvard.edu/castles/, and did not constrain the fluxes. Our best-fit model predicts an Einstein radius of 10 for the primary lensing galaxy, with a second mass having an Einstein radius of 26 located 125 away at a position angle west of north. This places it close to the observed location of the associated group of galaxies. The model yields a total reduced of 3, with the greatest contribution coming from the position of the primary lensing galaxy. The flux ratios predicted by this model are listed in Tables 1 and 2, and may be expected to vary between different plausible models of the lens at the 10% level.
3.2. Anomalous flux ratios and microlensing
Simple smooth analytic models (Metcalf & Zhao, 2002) predict that the flux ratio should be very nearly equal to unity. For our lens model, the ratio is 0.96. Chiba et al. (2005) observe a mid-infrared flux ratio of , consistent with this prediction. In 1984, Vanderriest et al. (1986) measured a flux ratio of , but since then, as seen in Table 2, the optical flux ratio has varied on a timescale of years between 0.66 and 0.81. As noted in §2.1, the contemporaneous X-ray flux ratio is less than 0.2, inconsistent not only with the predictions of the smooth models, but with the optical observations as well.
Microlensing by stars in the lensing galaxy could in principle account for such flux ratios, but only if the source is small compared to the Einstein radii of the microlensing stars. Our simple model has convergence, , and shear, , roughly equal at the image positions, with magnifications of 19.9 for the image and 19.0 for the image. Examples of point source magnification histograms for pairs of images very much like those in PG 1115+080 are presented by Schechter and Wambsganss, with magnifications for and of 10 and 16, respectively (Schechter & Wambsganss, 2002). They present histograms both for the case when 100% of the convergence is due to stars and for the case when only 20% of the convergence is due to stars and the rest is due to a smooth dark component. The X-ray flux ratio rules out neither hypothesis but is considerably more likely if dark matter is present.
Until now, it was a bit of a puzzle why the optical flux anomalies had failed to deviate from unity as much as was predicted by these histograms. Now it appears that it was because the optical region is too large to be strongly microlensed (see §3.4). As Schechter & Wambsganss note, the determination of the dark matter fraction of lensing galaxies using the statistics of flux ratio anomalies is made considerably more difficult if the source size is comparable to that of a stellar Einstein ring. It seems now that the X-ray flux ratio anomalies offer a cleaner determination of the dark matter fraction than the optical anomalies.
3.3. Long-term X-ray variability
According to the microlensing model for flux-ratio anomalies, discussed below, is expected to brighten in X-rays on a timescale of 10 years, and follow-up Chandra observations will be able to directly test this. As brightens, the unresolved flux will also increase. To look for past signs of this effect, we searched the High Energy Astrophysics Science Archive Research Center, provided by NASA’s Goddard Space Flight Center, for other X-ray observations of PG 1115+080 and found two ROSAT observations and three relevant XMM-Newton observations. The ROSAT observations and an earlier Einstein observation are analyzed in Chartas (2000).
The ROSAT count rates were converted to unabsorbed 0.5–2 keV fluxes using WebPIMMS (Mukai, 1993) with the assumptions of an absorbed power law of photon index 1.65 and a column density of cm-2. For the XMM observations, we extracted spectra of PG 1115+080 from the EPIC-PN and both EPIC-MOS detectors. We performed joint spectral fits (on all quasar images added together) in the 0.5–10 keV band for each observation with simple absorbed power laws with the column density fixed at the Galactic value. These gave acceptable fits, from which we computed the unabsorbed 0.5–2 keV fluxes. We also used our previous Chandra joint fits to compute the total 0.5–2 keV fluxes (from all quasar images added together) from the Chandra observations. The long-term X-ray light curve is shown in Figure 3.
From the seven measurements of the lensed flux from PG 1115+080 over the course of 12.5 years, the mean is , and the sample standard deviation is , or 40%. There is no evidence for strong short term variability from the individual lensed images in the Chandra data, nor is there evidence for strong short term variability within the three XMM observations (in which the individual images are unresolved).
As discussed above, if the demagnification of is due to microlensing, the unresolved flux will rise as becomes less demagnified. The observed relative X-ray fluxes of the four images are (based on ObsID 363; see Table 1). If were to rise in flux to match , the overall change in flux would be 50%. The recent XMM observations show that the X-ray flux has risen 30% since the Chandra observations from six years ago (Figure 3). However, there is an obvious degeneracy between a rise in the flux of and typical quasar variability over the course of many years.

3.4. Sizes of quasar emission regions
The size scales of the emission regions in quasars are difficult to probe directly since they are on the microarcsecond scale or smaller. The use of temporal variability for inferring sizes is indirect and becomes impractical for distant quasars. By contrast, microlensing directly explores angular scales of (by definition) microarcseconds. Of the emission features of the quasar, only those which subtend smaller angles on the sky than the Einstein radius of the microlenses will exhibit strong variations in flux.
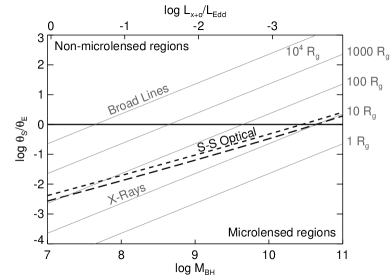
Figure 4 displays the results from our study of PG 1115+080. Here we have plotted the ratio of angular scale for different regions of the quasar, , to the Einstein radius of a solar-mass microlens, . For ratios greater than unity, microlensing should be strongly suppressed (for a detailed analysis see Mortonson et al., 2005). The ratio is plotted against the assumed mass of the central black hole, . For every value of there is a corresponding Eddington luminosity which can be compared to the observed values of ( ; 0.5–8 keV; this work) and ( , from a sum of the V-, I-, and H-band data provided by the CASTLES Lens Survey) for PG 1115+080 (see the top axis label). Within the vs. plane we plot contours of constant size in units of , the gravitational radius of the black hole (). As is evident from the plot, the X-rays, which should arise deep in the gravitational potential well of the black hole, should be microlensable for any . This is in clear agreement with the large X-ray flux ratio anomalies observed for PG 1115+080 and for two other quad lenses: RX J0911+0554 and RX J11311231 (Morgan et al., 2001; Blackburne et al., 2006). By contrast, the broad-line emission region should not be microlensable, except for a lower mass black hole (i.e., ). Finally, the dotted and dashed curves mark the radii within which 50% of the power in the and bands emerge, respectively, for a simple thin accretion disk model (e.g. Shakura & Sunyaev, 1973). According to these curves, the optical continuum ought to be microlensed by approximately the same amount as in the X-ray band, in agreement with Mortonson et al. (2005). But clearly it is not!
Using HST spectra, Popović & Chartas (2005) found that the ratio in the ultraviolet continuum is 0.5 and decreases to shorter wavelengths, indicating that the UV is more severely microlensed than the optical but less microlensed than the X-rays.
Therefore, within the microlensing scenario, we can conclude that the continuum optical emission from PG 1115+080 comes from much further out than the UV, which in turn comes from further out than the X-rays. In particular, we find that the optical emission comes from a region 10–100 times larger than expected for a thin accretion disk model (for in the range ). Since dominates in PG 1115+080 (and for many other luminous quasars), this is difficult to understand from an energetics point of view, since the energy released goes as . Of course the optical light could be scattered by a large-scale plasma region; however, in that case one would expect the X-rays to be scattered as well, and hence share a similar effective emission region. Thus, while the X-ray images clearly appear to be microlensed, the bulk of the optical emission must be coming from 100–3000 from the central black hole (for in the range ).
In coming to these conclusions, we have neglected special- and general-relativistic effects in the emissions from the accretion disk, except for cosmological redshift. In addition, we have followed Mortonson et al. (2005) in assuming a Kerr black hole with a large spin parameter (). This is consistent with estimates for a typical quasar (Wang et al., 2006), and implies an innermost disk radius of and a binding energy per mass . We have also set the bolometric luminosity to 33% of the Eddington luminosity, as advocated by Kollmeier et al. (2005). Neither of these parameter assumptions has a strong effect on the size of the predicted optical emission region for a thin accretion disk model.
4. Conclusions
We have made use of optical data collected over the past 22 years to demonstrate that the bright, close pair of lensed images of PG 1115+080 has a consistent flux ratio () of 0.7–0.8. X-ray observations with Chandra, covering two epochs separated by 5 months, indicate a much more extreme flux ratio of 0.2. Both the optical and X-ray ratios are anomalous with respect to smooth lensing models, which predict a flux ratio of 0.96. We used a comparison of the optical and X-ray flux ratio anomalies to argue in favor of the microlensing origin of the anomalies, and to show that the optical emission region is much larger (i.e., ) than predicted by a simple thin accretion disk model.
References
- Barkana (1997) Barkana, R. 1997, ApJ, 489, 21
- Blandford (1990) Blandford, R. D. 1990, QJRAS, 31, 305
- Blackburne et al. (2006) Blackburne, J. A., Pooley, D., & Rappaport, S. 2006, ApJ, 640, 569
- Broos et al. (2002) Broos, P. S., Townsley, L. K., Getman, K., & Bauer, F. E. 2002, ACIS Extract, An ACIS Point Source Extraction Package (University Park: Pennsylvania State Univ.)
- Cash (1979) Cash, W. 1979, ApJ, 228, 939
- Chartas (2000) Chartas, G. 2000, ApJ, 531, 81
- Chartas et al. (2004) Chartas, G., Dai, X., & Garmire, G. P. 2004, in Carnegie Observatories Astrophysics Series, Vol. 2: Measuring and Modeling the Universe, ed. W. L. Freedman (Cambridge: Cambridge University Press), in press.
- Chiba (2002) Chiba, M. 2002, ApJ, 565, 17
- Chiba et al. (2005) Chiba, M., Minezaki, T., Kashikawa, N., Kataza, H., & Inoue, K. T. 2005, ApJ, 627, 53
- Christian et al. (1987) Christian, C. A., Crabtree, D., & Waddell, P. 1987, ApJ, 312, 45
- Dalal & Kochanek (2002) Dalal, N., & Kochanek, C. S. 2002, ApJ, 572, 25
- Dickey & Lockman (1990) Dickey, J. M., & Lockman, F. J. 1990, ARA&A, 28, 215
- Freeman et al. (2001) Freeman, P., Doe, S., & Siemiginowska, A. 2001, Proc. SPIE, 4477, 76
- Foy et al. (1985) Foy, R., Bonneau, D., & Blazit, A. 1985, A&A, 149, L13
- Grant et al. (2004) Grant, C. E., Bautz, M. W., Chartas, G., & Garmire, G. P. 2004, ApJ, 610, 686
- Hewitt et al. (1992) Hewitt, J. N., Turner, E. L., Lawrence, C. R., Schneider, D. P., & Brody, J. P. 1992, AJ, 104, 968
- Inada et al. (2003) Inada, N., et al. 2003, AJ, 126, 666
- Karovska et al. (2001) Karovska, M., et al. 2001, ASP Conf. Ser. 238: Astronomical Data Analysis Software and Systems X, 238, 435
- Keeton (2001) Keeton, C. R. 2001, ArXiv Astrophysics e-prints, arXiv:astro-ph/0102340
- Keeton, Gaudi, & Petters (2005) Keeton, C. R., Gaudi, B. S., & Petters, A. O. 2005, ApJ, 635, 35.
- Keeton et al. (2005) Keeton, C. R., Burles, S., Schechter, P. L., & Wambsganss, J. 2005, ApJ, 639, 1
- Kochanek & Dalal (2004) Kochanek, C. S., & Dalal, N. 2004, ApJ, 610, 69
- Kollmeier et al. (2005) Kollmeier, J. A. et al. 2005, ArXiv Astrophysics e-prints, arXiv:astro-ph/0508657
- Kristian et al. (1993) Kristian, J., et al. 1993, AJ, 106, 1330
- Kundic et al. (1997) Kundic, T., Cohen, J. G., Blandford, R. D., & Lubin, L. M. 1997, AJ, 114, 507
- Metcalf & Madau (2001) Metcalf, R. B., & Madau, P. 2001, ApJ, 563, 9
- Metcalf & Zhao (2002) Metcalf, R. B., & Zhao, H. 2002, ApJ, 567, L5
- Morgan et al. (2004) Morgan, N. D., Caldwell, J. A. R., Schechter, P. L., Dressler, A., Egami, E., & Rix, H.-W. 2004, AJ, 127, 2617
- Morgan et al. (2001) Morgan, N. D., Chartas, G., Malm, M., Bautz, M. W., Burud, I., Hjorth, J., Jones, S. E., & Schechter, P. L. 2001, ApJ, 555, 1
- Morgan et al. (2006) Morgan, C. W., Kochanek, C. S., Morgan, N. D., & Falco, E. E. 2006, ArXiv Astrophysics e-prints, arXiv:astro-ph/0601523
- Mortonson et al. (2005) Mortonson, M.J., Schechter, P.L., & Wambsganss, J. 2005, ApJ, 628, 594
- Mukai (1993) Mukai, K. 1993, Legacy, vol. 3, p.21-31, 3, 21
- Narayan & Bartelmann (1999) Narayan, R., & Bartelmann, M. 1999, Formation of Structure in the Universe, 360
- Peeples et al. (2004) Peeples, M. S., Schechter, P. L., & Wambsganss, J. K. 2004, American Astronomical Society Meeting Abstracts, 205
- Popović & Chartas (2005) Popović, L. Č., & Chartas, G. 2005, MNRAS, 357, 135
- Reimers et al. (2002) Reimers, D., Hagen, H.-J., Baade, R., Lopez, S., & Tytler, D. 2002, A&A, 382, L26
- Saha & Williams (2003) Saha, P., & Williams, L. L. R. 2003, AJ, 125, 2769
- Schechter & Moore (1993) Schechter, P. L., & Moore, C. B. 1993, AJ, 105, 1
- Schechter & Wambsganss (2002) Schechter, P. L., & Wambsganss, J. 2002, ApJ, 580, 685
- Schechter & Wambsganss (2004) Schechter, P. L., & Wambsganss, J. 2004, IAU Symposium, 220, 103, also astro-ph/0309163
- Schechter et al. (1997) Schechter, P. L., et al. 1997, ApJ, 475, L85
- Shakura & Sunyaev (1973) Shakura, N. I., Sunyaev, R. A. 1973, A&A, 24, 337
- Vanderriest et al. (1986) Vanderriest, C., Wlerick, G., Lelievre, G., Schneider, J., Sol, H., Horville, D., Renard, L., & Servan, B. 1986, A&A, 158, L5
- Wang et al. (2006) Wang, J.-M., Chen, Y.-M., Ho, L. C., & McLure, R. J. 2006, ArXiv Astrophysics e-prints, arXiv:astro-ph/0603813
- Weymann et al. (1980) Weymann, R. J., et al. 1980, Nature, 285, 641
- Witt et al. (1995) Witt, H. J., Mao, S., & Schechter, P. L. 1995, ApJ, 443, 18