The Star-Forming Torus and Stellar Dynamical Black Hole Mass in the Seyfert 1 Nucleus of NGC 3227111Based on observations at the European Southern Observatory VLT (074.B-9012).
Abstract
We report Very Large Telescope SINFONI adaptive optics integral field K-band spectroscopy of the nucleus of the Seyfert 1 galaxy NGC 3227 at a spatial resolution of 0.085″ (7 pc). We present the morphologies and kinematics of emission lines and absorption features, and give the first derivation of a black hole mass in a Seyfert 1 nucleus from spatially resolved stellar dynamics. We show that the gas in the nucleus has a mean column density of order – cm-2 and that it is geometrically thick, in agreement with the standard ‘molecular torus’ scenario. We discuss which heating processes may be responsible for maintaining the vertical height of the torus. We have also resolved the nuclear stellar distribution, and find that within a few parsecs of the AGN there has been an intense starburst. The most recent episode of which began 40 Myr ago but has now ceased. The current luminosity of stars within 30 pc of the AGN, , is comparable to that of the AGN. Based on a comparison of the respective size scales, we argue that the star formation has been occuring in the obscuring torus. Finally, we present the first derivation of a black hole mass in a Seyfert 1 nucleus from stellar dynamics which marginally spatially resolve the black hole’s sphere of influence. We apply Schwarzschild orbit superposition models to our full 2-dimensional data and derive the mass of the black hole, paying careful attention to the input parameters which are often uncertain: the contribution of the large scale bulge and its mass-to-light ratio; the recent star formation in the nucleus and its mass-to-light ratio; the contribution of the gas mass to the potential; and the inclination. Our models yield a 1 range for the black hole mass of M– .
1 Introduction
Three issues concerning active galactic nuclei (AGN) which are currently receiving considerable attention, and which we address in this paper, are: the relationship of the AGN to the surrounding star formation, the central black hole mass, and the physical properties of the obscuring torus.
The issue of star formation in AGN has long been contentious, although it is now clear that on 0.1–1 kpc scales star formation is an important process in all types of AGN (Cid Fernandes, 2004). In particular empirical population synthesis of Seyfert 2 nuclei (Cid Fernandes et al., 2001; González Delgado, et al., 2001; Storchi-Bergmann et al., 2001) reveals evidence for recent (1 Gyr) star formation within a few hundred parsecs of the nuclei in about 40% of Seyfert 2 nuclei. While some authors (e.g. Joguet et al., 2001; Gu et al., 2001) reach similar conclusions, not all concur (Ivanov et al., 2000). Mid- and Far- infrared ISO data (Verma et al., 2005) also have much to offer on this issue. The situation regarding Seyfert 1 nuclei is rather more uncertain, and a criticism (equally applicable to Seyfert 2s) often levelled is that it lies so far from the AGN that it cannot be associated with or strongly influencing the characteristics of the AGN (Heckman et al., 1997). Nevertheless, Davies et al. (2004a, b) report two cases where powerful starbursts do exist within the central few tens of parsecs of type 1 AGN.
Beyond this debate is the fundamental question concerning the physics linking the two phenomena through a causal relationship (Shlosman & Begelman, 1989; Goodman & Tan, 2004; Thompson et al., 2005) – which is related to, although more complex than, driving gas to small scales. While observation and theory provide strong indications linking gas inflow and circumnuclear starbursts to AGN and nuclear starbursts, the statistical evidence is tenous (Knapen, 2004; Wada, 2004; Shlosman, 2003). For example, HST imaging shows no dependence of AGN activity on the presence of a nuclear spiral (Martini et al., 2003). Similarly, AGN are equally common in galaxies with and without a compact nuclear gas component (García-Burillo et al., 2003).
A parallel theme is the molecular obscuring torus (Antonucci & Miller, 1985; Antonucci, 1993), the heart of the unification scheme. Many models of the thermally re-radiated spectrum of the putative torus have been constructed, both as a uniform ring (Pier & Krolik, 1992a, 1993; Granato & Danese, 1994; Schartmann et al., 2005), and also as a clumpy medium (Nenkova et al., 2002) as was proposed for NGC 1068 a decade earlier by Cameron et al. (1993). In all cases, the crucial properties are a spatial scale of tens (to perhaps hundreds) of parsecs, a vertically extended geometry, and a high column density. In the last few years, models have begun to consider star formation within the torus (Wada & Norman, 2002; Thompson et al., 2005), giving credence – albeit with a different perspective – to some early ideas about stellar light in AGN spectra.
The mass of the central supermassive black hole is the third issue we address. The masses of black holes in nearby AGN are most commonly estimated by reverberation mapping (Onken et al., 2004), a technique that can be extended to higher redshift via additional scaling relations (Kaspi et al., 2000, 2005; Vestergaard, 2002, 2004). Providing an independent measure of for reverberation masses would allow one to begin to understand the geometry of the broad line region, which is the limiting factor in the accuracy of the method (Horne et al., 2004).
Estimates of such masses are important with respect to the relation between the in the center of a stellar spheroid and the velocity dispersion (Ferrarese & Merritt, 2000; Gebhardt et al., 2000). This relation has superseded similar ones using the luminosity or mass of the spheroid (Kormendy & Richstone, 1995; Magorrian et al., 1998) to become a cornerstone in the cosmological context of galaxy evolution and black hole growth. It is generally accepted that the relation should be valid for all spheroids irrespective of whether the black hole is quiescent or active, whether the spheroid in which it lies is a globular cluster or a giant elliptical galaxy, whether the spheroid is embedded in a gaseous disk or not, and so on. However, almost without exception the black hole masses that are considered ‘reliable’ – typically those based on stellar kinematics and for which the radius of influence of the black hole has been resolved – have been derived only for nearby bulge dominated E/S0 galaxies (Tremaine et al., 2002; Marconi & Hunt, 2003; Ferrarese & Ford, 2005). The smaller bulges of spiral galaxies imply lower , making it difficult to spatially resolve the stellar kinematics. And for AGN, where the black hole is by definition active rather than quiescent, the glare of the AGN itself is an added obstruction. To date there is only one such published mass, M⊙ for Cen A (Silge et al., 2005). Despite this galaxy’s proximity, seeing limited observations are only able to resolve the radius of influence of the black hole because the black hole is at least 5 times more massive than expected from the relation. Given this result, it is crucial that black hole masses are derived using stellar kinematics at high spatial resolution for more AGN.
In this paper we look in detail at these topics for the Seyfert 1 nucleus of NGC 3227. We probe the star formation and molecular gas in the central 80 pc at a spatial resolution of only a few parsecs. In particular we discuss how the young stars and gas relate to our understanding of the canonical torus. In addition we derive the mass of the black hole from Schwarzschild modelling of the stellar dynamics. This is the first time that this has been possible for a Seyfert 1 galaxy, where using integral field capability we measure the kinematics across the full 2-D field. We pay careful attention to issues which are often rather uncertain in Schwarzschild orbit superposition models: the inclination of the system, the mass-to-light ratio, and the contribution of gas to the gravitational potential.
The distance to NGC 3227 of 17 Mpc (for H–75 km s-1 Mpc-1) is estimated from the 1250 km s-1 luminosity weighted average velocity of the 13 galaxies in the group of which it is a member (Garcia, 1993). Its infrared (8–1000µm) luminosity is then . However, this does not represent the bolometric luminosity since the spectral energy distribution is approximately flat in the range 0.3–1000µm, and perhaps to even shorter wavelengths. Taking this into account we estimate the bolometric luminosity to be .
2 Observations and Data Reduction
The data presented here were obtained on 21 Dec 2004 using SINFONI (Eisenhauer et al., 2003a; Bonnet et al., 2004) on the VLT UT4. The instrument consists of a cryogenic near infrared integral field spectrometer SPIFFI (Eisenhauer et al., 2003a, b) coupled to a visible curvature adaptive optics (AO) system (Bonnet et al., 2003). The AO module was able to correct on the nucleus of NGC 3227 (for which it measured R=13.9 mag) in seeing of 0.6″, to reach nearly the diffraction limit of the telescope in the K-band (an estimated 15% Strehl). With the appropriate pixel scale selected, the spectrograph was able, in a single shot, to obtain spectra covering the whole of the K-band (approximately 1.95–2.45µm) at a spectral resolution of for each pixel in a field of view. A total of 3 sky and 6 on-source exposures of 600 sec each, dithered by up to 0.2″, were combined to make the final data cube.
The data were reduced using the SINFONI custom reduction package SPRED. This performs all the usual steps needed to reduce near infrared spectra, but with additional routines for reconstructing the data cube. Because the sky airglow did not vary much during the observations and is low compared to the read noise at such small pixel scales, it was possible to make a combined sky frame which could be subtracted from all the on-source frames without leaving OH line residuals. Following this step, the frames were flatfielded and corrected for dead/hot pixels. The data were then interpolated to linear wavelength and spatial scales, after which the slitlets were aligned and stacked up to create a cube. Finally the atmospheric absorption was compensated using the B9 star HD 83434; and flux calibration was performed using HD 83434 (K=6.917) and HD 87015 (K=6.144), which both yielded a zeropoint of 16.08 mag.
Spatial Resolution
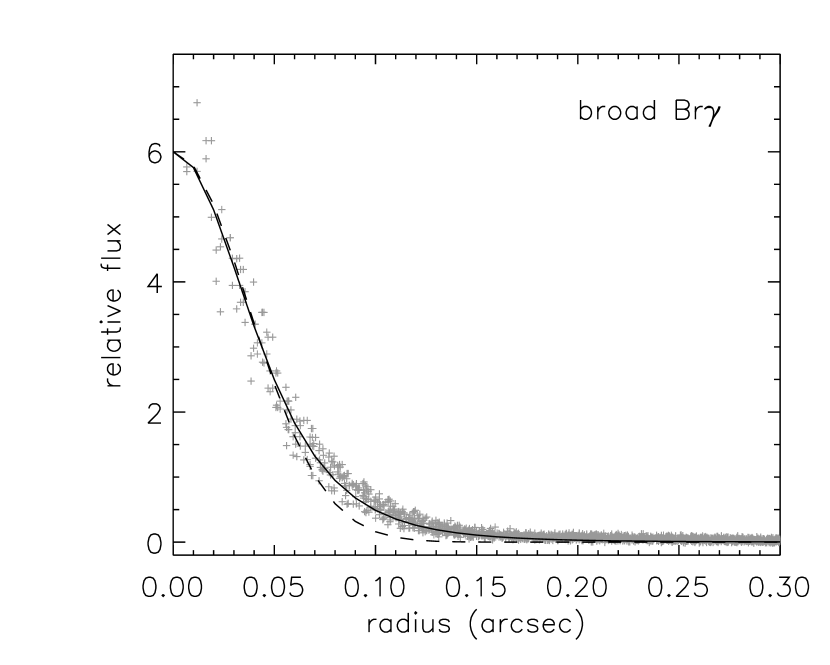
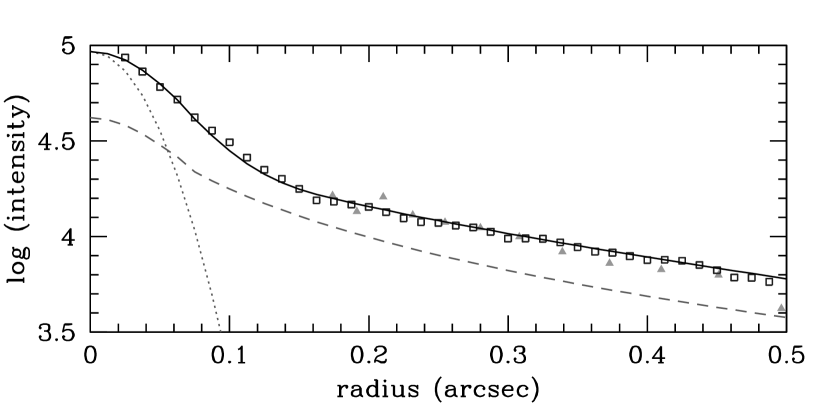
No additional point-spread function (PSF) calibration frames using stars were taken. This is primarily because, although in principle one can match the brightness of a calibration star on the wavefront sensor to the AGN, it is not possible to replicate either the spatial extent of the AGN or the background galaxy light associated with it. Together with changes in the ambient seeing which can occur on relatively fast timescales, this can result in a potentially considerable mismatch between the science and calibration PSFs (Davies et al., 2004c). Since, for the analysis presented here, a highly accurate PSF is not needed, we have instead made use of the broad Br emission which is unresolved: it has been measured to be of order 0.02 pc by Salamnca et al. (1994) and Onken et al. (2003). This has the advantage of providing the resolution directly from the science frames, and includes all effects associated with shifting and combining the cube, and also smoothing (a median filter was applied to the final cube). The PSF we use for convolving our models is then approximated by a symmetrical fit to the broad Br emission as shown in Fig. 1. In this figure we have plotted the value for every pixel within 0.3″ of the centre, from which it can be seen there are no asymmetric artifacts resulting from the AO correction. Overdrawn are both Gaussian and Moffat profiles. The latter, as expected, matches the faint extended wings in the profile; but both reproduce the core of the profile equally well. They yield a FWHM resolution of 0.085″.
Derivation of the Kinematics and their Uncertainties
The velocity and dispersion of the emission lines is found by simultaneously fitting the continuum level with a linear function and the line itself with a Gaussian. The uncertainty of the fit is estimated using Monte Carlo techniques assuming that the noise is uncorrelated and the line is well represented by a Gaussian. The method involves adding a Gaussian with the measured properties to a spectral segment with the same noise statistics as the data, and re-fitting the line to yield a new set of Gaussian parameters. After repeating this 100 times, the standard deviation of the center and dispersion are used as the uncertainties for the velocity and line width.
The shape of the CO absorption bandheads in a galaxy spectrum arises from the intrinsic spectral profile of the stars themselves convolved with a broadening profile which carries the information about the kinematics. The use of template stars (we chose the K0 I star HD 179323) allows one to separate these two components. One technique commonly used is deconvolution with the Fourier cross-correlation quotient method. The principal advantage of this method is that it allows one to recover the full broadening profile even if it is not well represented by a function such as a Gaussian (plus Hermite terms). However, because the Fourier transform of the object is divided by that of the template, the noise is amplified; and while it can be reduced by Wiener filtering, setting the optimal parameters of the filter is only possible if the noise and signal can be properly distinguished in Fourier space. If this is not done correctly, it can be difficult to obtain the correct object dispersion. The alternative is to convolve the template with an analytical function and iteratively minimise its difference to the object using a criterion. The limitation of this technique is its speed and the fact that the convolution function needs to be relatively simple. On the other hand, it is less adversely affected by noisy data and one can easily reject bad data values. In addition it provides a clear path to estimating the uncertainties using standard techniques. One can estimate the confidence level for each parameter separately by finding the value for which, with all the other parameters re-optimised, increases by 1.
It is the latter method which we have used because the individual spectra for each spatial pixel are rather noisy, and we only extract the usual three parameters for a Gaussian fit. Tests have shown that for these data it is not possible to determine coefficients for the Hermite polynomials which would indicate the deviations from a Gaussian.
We have only made use of the first (i.e. CO 2-0) bandhead, because [Ca viii] emission at the edge of the CO 3-1 strongly biasses the derived velocities (making them much more positive where the line emission is strongest) when this second bandhead is used. The third CO 4-2 bandhead adds very little because it is strongly affected by residual atmospheric features.
Smoothing
All the images presented in this paper have been smoothed using optimal Voronoi tessellations, as described and implemented by Cappellari & Copin (2003). This scheme uses adaptive binning to group pixels so that the combined signal to noise of each group is above a minimum threshold. Pixels which are already above the threshold are not binned. Thus the final resolution varies across the image, although at no point is it improved beyond the original resolution in the data.
The algorithm bins pixels together into groups by accreting new pixels to each group according to how close they are to the centroid of the current group. Checks ensure that each time a pixel is added to a group, both the group remains ‘round’ and the signal to noise increases. The resulting groups then provide a set of positions (centroids) and mean fluxes which are used as the initial ‘generators’. A further algorithm optimises the generator configuration based on a centroidal Voronoi tessellation. The final set of generators are the positions of the flux-weighted centroids of each binned group, and have the property that each pixel in the original image is assigned to the group corresponding to the nearest generator. Thus the positions of the generators provide all the information necessary to re-create the binned image.
Since it can be hard for the human eye to comprehend the binned images created in this way, we have – for the purposes of presentation only – applied a final step of interpolating all the pixel values from the generators of the Voronoi tessellation using a minimum curvature spline surface (as implemented in IDL version 6.0). In the resulting smooth images, pixels with high signal to noise (i.e. unbinned pixels) have very nearly the same value as the original image.
3 The Circumnuclear Stellar Ring
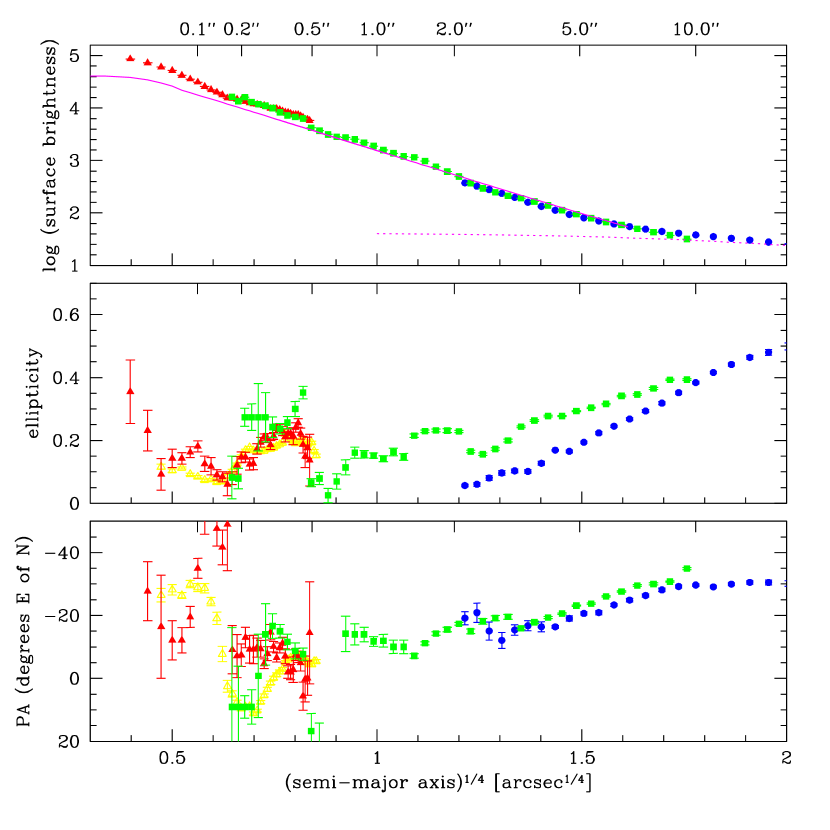
When the pixel scale of SINFONI is matched to the diffraction limit of the VLT, its field of view is only 1″. An important step is therefore to understand the larger scale context in which these data reside. To facilitate this we have used H-band data – which trace the stellar light with less bias to recent star formation than optical data – from both the 2MASS large galaxy atlas (Jarrett et al., 2003) on scales of 2–100″, and the Hubble Space Telescope (HST) archive on scales of 0.2–10″ (proposal 7172, Rieke). Before analysing the HST F160W image, it was deconvolved using a PSF generated by Tiny Tim 6.2, rotated to the standard orientation and trimmed to 13.5″ on a side. Isophotal fitting (using the ellipse task in iraf) was performed on both these images and the resulting profiles scaled according to their overlapping region. Additionally, a bulge-plus-disk model (the parameters of the disk being fixed at the values determined from the large scale 2MASS data) was fit to the F160W image, excluding radii smaller than 1.6″, using a minimisation. This model was then divided into the F160W image in order to investigate the excess continuum emission apparent at radii of 1–1.5″.
On the largest scales there is an almost perfect exponential profile with a disk scale length of 26.8″ (2.1 kpc) and an axis ratio of 0.4–0.6 (corresponding to an inclination of 55–65∘) at a position angle (PA) of . At smaller scales, there is a smooth transition to an profile with an effective radius of ″ (270 pc), which dominates the emission at radii 2–9″. This is rather larger than the 2.6″ found by Nelson et al. (2004) from optical data, probably because we have less bias from nuclear star formation and the AGN.
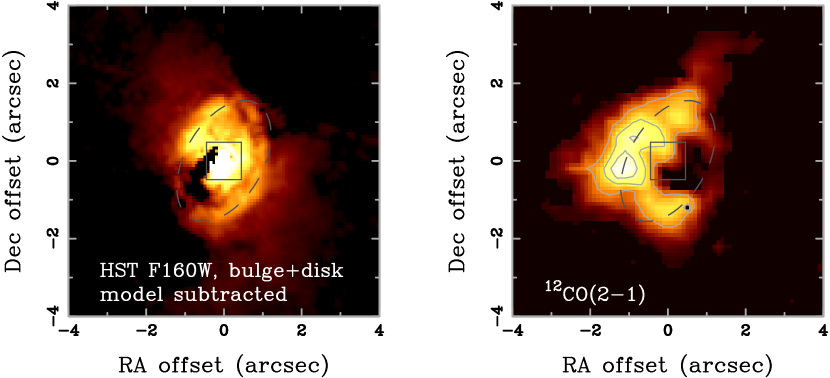
What was previously reported by Chapman et al. (2000) as a possible knotty one-armed spiral is now revealed in Fig. 2 as a ring of excess continuum with radius 1.7″ (140 pc). Its axis ratio of 0.6 and PA of ) are consistent with both the large scale disk and also the circumnuclear molecular gas ring reported by both Schinnerer et al. (2000) and Baker (2000). The kinematics of the CO (2-1) indicate that the gas lies in a disk; and the stellar ring indicates that the stars also lie in a disk, since resonances such as these are features of disk dynamics. The similarity of the loci traced in both cases suggests that the stellar and gas disks are in fact the same. The ring was hypothesised by Schinnerer et al. (2000) to be at the location of an inner Lindblad resonance (ILR) associated with a secondary inner bar on scales smaller than 20″, which is itself the ILR for the primary bar. Evidence for such a secondary bar was presented by Baker (2000) who noted elongated molecular structures along the major axis at radii of 10–15″, which he suggests may be concentrations of gas at the leading edges of a bar. However, he cautions that the velocities are different to those expected for gas inflow along the bar.
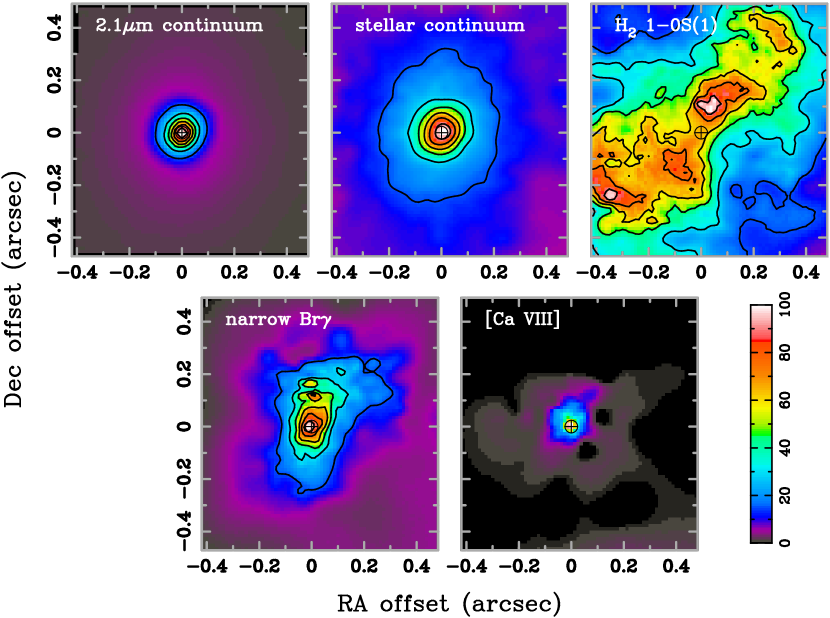
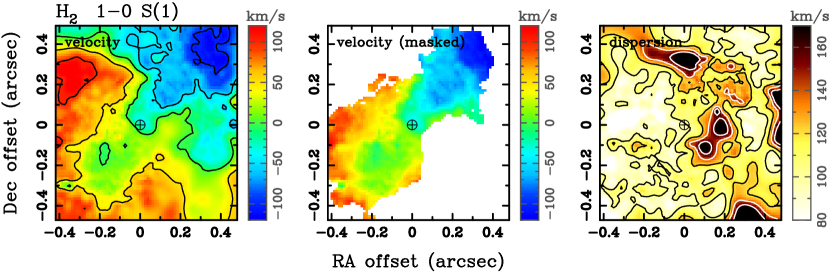
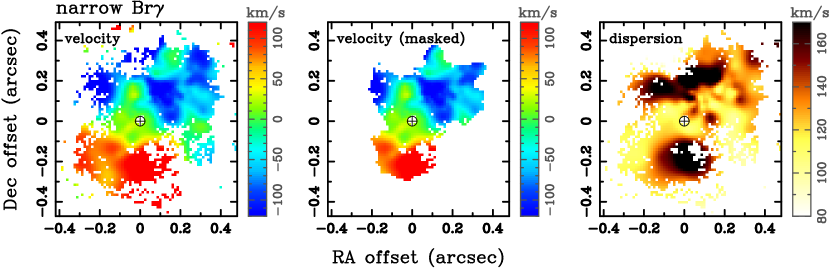
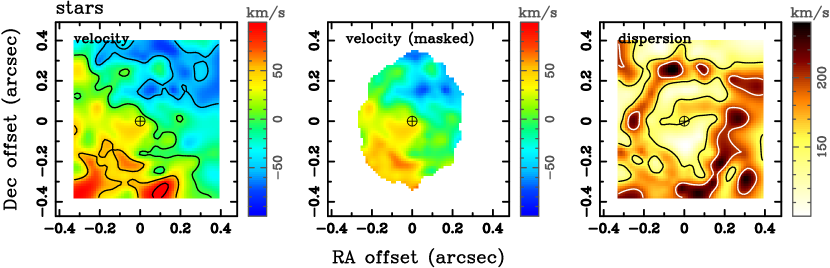
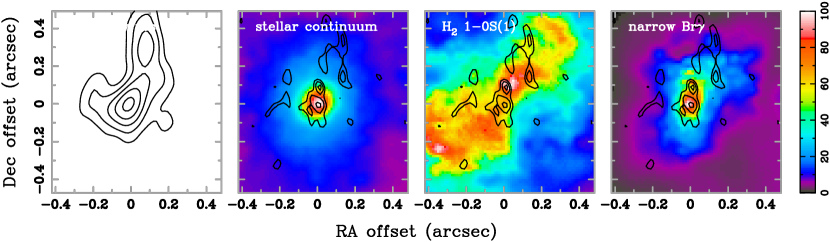
The 1″ field of view of SINFONI lies entirely inside the 140 pc ring, as indicated on Fig. 2. Its view is presented in Fig. 3, where we show images of the 2.1µm continuum, the stellar continuum measured from the CO 2-0 absorption bandhead, the 2.12µm H2 1-0 S(1) line, the 2.17µm Br line, and the coronal [Ca viii] line at 2.32µm. Fluxes and flux densities are summarised in Table 1. The corresponding kinematics for the 1-0 S(1) and Br lines and the stellar CO 2-0 absorption are shown in Fig. 4. In the lefthand panels we show the full field that can be measured. In the centre panels we have applied a mask to show only velocities associated with the brightest pixels: those that contribute 2/3 of the total flux, and hence the bulk of the emitting medium, in the field. Velocity dispersions are shown in the righthand panels.
4 Nuclear Star Formation
There is some evidence in the literature that points to a scenario involving recent vigorous star formation in the nucleus of NGC 3227. Based on an analysis of seeing limited near infrared integral field spectroscopy, Schinnerer et al. (2001) argued that there was a 25–50 Myr cluster present, although they could not rule out a much older population. In addition, there is the detection of the 3.3µm polycyclic aromatic hydrocarbon (PAH) feature in a 0.8″1.7″ slit aperture by Rodríguez-Ardila & Viegas (2003). They reported that the ratio is lower than the mean for starbursts but typical of Seyfert 2s. PAHs have also been detected in AGN where star formation is also active, perhaps most notably Mkn 231 (Rigopoulou et al., 1999) and NGC 7469 (Mazzarella et al., 1994); Davies et al. (2004a, b) have shown beyond doubt that these galaxies host massive nuclear star formation. In this Section we address the questions of the presence and age of a distinct stellar component in the nucleus. We consider evidence from the stellar absorption features (Sections 4.1 and 4.2), the narrow Br (Section 4.3), and radio continuum (Section 4.4). Finally we apply population synthesis models in Section 4.5.
4.1 Late Type Stars and Stellar Luminosity
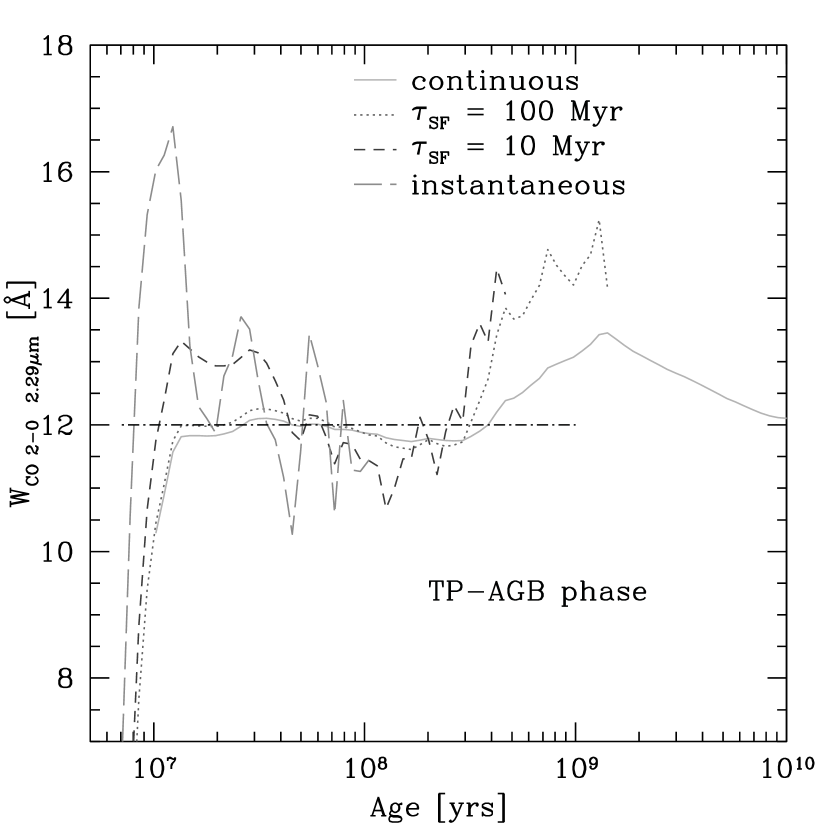
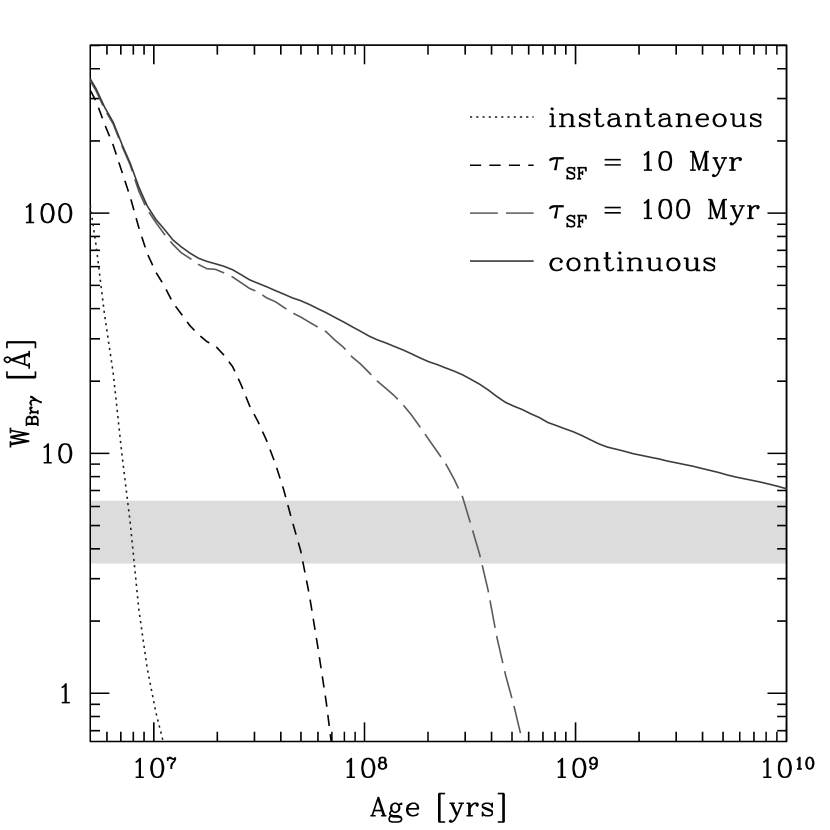
The CO bandheads at µm are often used as tracers of star formation in the K-band since, once they first appear, late type stars dominate the near infrared stellar continuum. Under the assumption that either the equivalent width of the CO 2-0 bandhead, , is independent of stellar population or that the stellar population does not change across the region of interest, the absolute absorption in the bandhead provides a direct tracer of stellar luminosity. However, given that Förster Schreiber (2000) and others have shown that in individual stars can vary from 0–20Å depending on stellar type (effective temperature), the validity of this assumption is far from clear. Fortunately, there is observational and theoretical evidence that it is valid. Oliva et al. (1995) found very little variation in between elliptical, spiral, and Hii galaxies. In addition, star cluster models indicate that for ensembles of stars, is much more stable, reaching a value close to 12Å once the age of the cluster has exceeded 10 Myr. This is demonstrated in Fig. 5 which shows how varies as a function of age for various star formation histories. The data were generated using the population synthesis code STARS (Sternberg, 1998; Thornley et al., 2000; Davies et al., 2003; Sternberg et al., 2003; Davies et al., 2005), which calculates the distributions of stars in the Hertzsprung-Russell diagram as a function of age for exponentially decaying star formation rates. Using empirically determined from library spectra (Förster Schreiber, 2000), the code then computes the time-dependent for the entire cluster of stars. The code includes the thermally pulsing asymptotic giant branch (TP-AGB) stars which have a very significant impact on the depth of the absorption features at ages of 0.4-2 Gyr (Förster Schreiber et al., 2003; Maraston, 2005). Throughout this work, we adopt a solar metallicity Salpeter IMF in the range 1–100 M⊙.
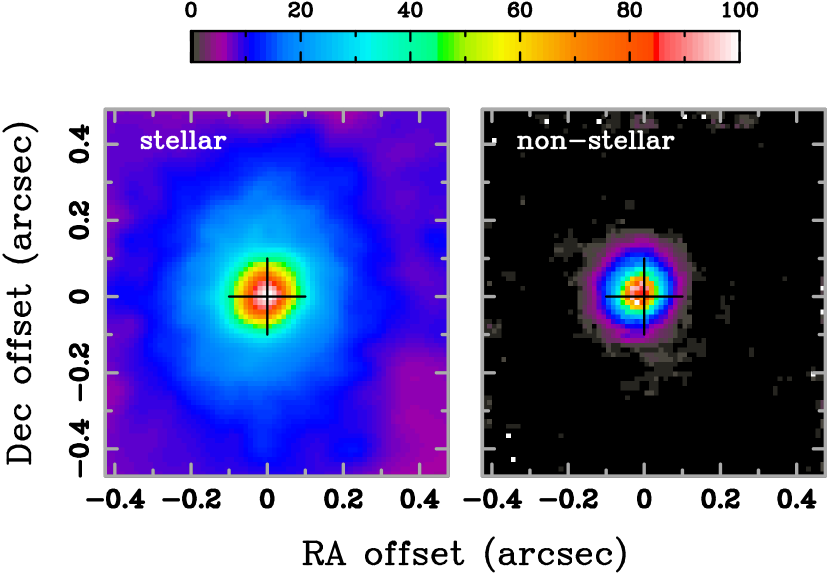
Fig. 5 shows that once CO absorption is present, does not deviate from 12Å by more than 20% except in the special case of instantaneous star formation with an age of less than 15 Myr. This insenitivity of to star formation history means that, although it cannot differentiate between young and old stellar populations, it can be used to distinguish the stellar and non-stellar continuum and to trace the total stellar luminosity profile. The observed Å (measured in the bandpass prescribed by Förster Schreiber 2000) implies a mean dilution (i.e. ratio of total continuum to stellar continuum) in a 0.8″ aperture of 3.3 at 2.3µm. The average dilution over the whole K-band will be less – as small as 2.3 if the hottest dust associated with the AGN is at a typical temperature of 500 K within this aperture (or hotter but also reddened). We have adopted an intermediate value of 2.8 corresponding to a characteristic temperature of 1000 K. Within the aperture, we find a K-band magnitude of 10.28 (a little brighter than that given by Schinnerer et al. 2001, perhaps due to their lower resolution or because of the wings often associated with the PSF of shift-and-add data), which implies a stellar magnitude of 11.4 or equivalently a 1.9–2.5µm luminosity of .
This luminosity includes both a possibly young population as well as the old bulge population. Fortunately, the respective contributions from these two components can be disentangled, as the top panel of Fig. 6 shows. This figure includes data at different scales from various sources, all of which have pros and cons: 2MASS H-band covers the largest scales but cannot probe scales less than 2–3″ due to limited resolution; HST F160W image covers intermediate and small scales at high resolution, but cannot probe radii smaller than 0.2″ due to the bright point source associated with the AGN; SINFONI total K-band continuum covers the central arcsec at high spatial resolution, but is limited by the AGN at radii less than 0.05″; SINFONI stellar K-band continuum probes the very smallest scales without being affected by the AGN, but is noisier (see Fig. 3). The large scale disk and bulge models discussed in Section 3 reveal an excess of emission at radii less than 0.5″ that increases to become very significant closer than 0.2″ from the centre. Presumably this excess is associated with the recent star formation that is also the origin of the narrow Br flux. It accounts for 60% of the continuum in a 0.8″ aperture. Hence the luminosity of the young stellar population is .
When compared to the luminosities of star clusters predicted by STARS (e.g. see Davies et al. 2003) or to individual clusters in other nearby galaxies, this suggests a very significant (probably young) stellar component within 30 pc of the AGN.
4.2 Nuclear Stellar Luminosity Profile
The 2.1µm continuum (similar to a broadband K image) is dominated by the non-stellar continuum associated with the AGN and is barely resolved, with a FWHM of 0.10″ (cf the resolution of 0.085″). On the other hand, a simple size measurement of the stellar continuum yields a FWHM of 0.17″ indicating that the nuclear stellar component is easily resolved, having an intrinsic size scale of 12 pc.
The axis ratio of 0.8 and PA evident in the outer isophotes of the total stellar distribution – also apparent in the faintest levels of the 2.1µm image – differ only slightly from those of the 140 pc scale ring. This can be seen in Fig. 6: from radii of 10″ where the bulge begins to dominate down to a scale of 2″, the ellipticity of the isophotes decreases; but, as measured in the HST F160W data as well as the SINFONI continuum and stellar bandhead data, it increases again briefly at both the 1.7″ radius of the ring and also at radii 0.2–0.5″. The stellar kinematics (Fig. 4) show ordered rotation, albeit with a very large velocity dispersion, at PA to .
It may be, as appears to be the case in NGC 7469 (Davies et al., 2004a), that the nuclear stellar cluster is triaxial, leading to an offset between the major (isophotal) axis and the kinematic axis. A triaxial potential could conceivably arise in a situation where a nested bar – perhaps associated with the 140 pc ring – is dynamically heated and forms a mini pseudobulge (Kormendy & Kennicutt, 2004). The timescale for such heating is of the order of 109 yr for kpc-scale bulges and presumably shorter for nested bars where the pattern speed is faster and significant energy may be injected either by star formation or the AGN. If the heating is due to buckling instability, then it will result in the bar becoming weaker and more centrally compact (Raha et al., 1991), at least qualitatively consistent with what we are seeing here.
However, in interpreting the stellar data one needs to bear in mind that it comprises similar contributions from the bulge and the nuclear component, the observed properties being the combination of these two components. As discussed above, the top panel of Fig. 6 disentangles these; and the excess emission revealed is drawn in more detail in Fig. 7. At radii ″ the data show a clear break at about 0.15″ characterised by a change in the radial luminosity gradient that is independent of the underlying bulge light (extrapolated from radii 2–10″ and marked by a dashed line). The profile of the excess can be fit by an profile whose effective radius changes at 0.10–0.15″. However, the two radii are ″ and ″, which are rather larger than the size scales over which the respective regions extend, leading to some doubt about whether they are physically meaningful fits. On the other hand, under the assumption that the excess continuum arises in a disk, it can be fit equally well by an exponential whose scale length (note that disk scale length is related to effective radius by ) changes at a radius of 0.11″. At smaller radii ″, while at larger radii ″.
In summary, the radial profile and rotational signature suggest a disk-like distribution for the nuclear component. On the other hand, the high dispersion and isophotal position angle (although both are biassed by the bulge component) indicate a thicker more spheroidal or even triaxial geometry. Taken together, these results suggest a thickened disk is the appropriate interpretation for the nuclear stellar light.
4.3 Ionised Gas and Young Stars
The Br map in the right hand panel of Fig. 3 shows only the narrow (FWHM 200–300 km s-1) component of the line, achieved by fitting out the broad (3000 km s-1) component. The resulting emission is resolved along all PAs. The crucial question here is whether the bulk of the Br originates from an outflow in the narrow line region (NLR) or from OB stars. On scales of 1–7″ the [O iii] emission is extended on PAs of to (Mundell et al., 1995; Schmitt & Kinney, 1996), roughly along the galaxy’s minor axis. However, Schmitt & Kinney (1996) also note a knot of emission ″ from the nucleus that they suggested could be associated with the double-peaked radio continuum source in Mundell et al. (1995). Indeed, approximately 0.2″ north and south of the nucleus, the dispersion of the Br line is much larger than elsewhere, which could be indicative that these features are related and originate in the NLR. On the other hand, both the morphology and primary velocity gradient of the Br are oriented to the north-west – which is strong evidence for a direct relation to the stars and molecular gas. A quantitative discrimination can be made by assigning emission with a dispersion greater than 150 kms to the NLR, and the rest (which lies along the major axis) to star formation. We find that % of the Br flux most probably originates in star formation. Section 4.5 and Fig. 8 address the consequences on our starburst models of the uncertainty of this conclusion.
4.4 Radio Continuum and Supernova Remnants
A map of the 6 cm radio continuum at a resolution of 0.05″0.07″, comparable to that we have achieved, was published by Mundell et al. (1995). This showed a 0.3″ long structure, composed of knots of emission, elongated at PA . In the 0.14″0.17″ resolution 18 cm map these features were visible only as a bright compact source and a tail to the north; but an additional bright knot was also apparent 0.4″ to the north. Mundell et al. (1995) suggested that these features might be radio jets – either one or, if the nucleus actually sits between the brightest knots, two sided. However, they noted a number of difficulties with this interpretation: lateral extensions were detected well above the noise level; and the jet orientation differs from that of the narrow line region, as traced by [Oiii]. They suggested that as in NGC 4151 (e.g. Pedler et al., 1993), misalignment may be expected between the radio axis, which lies along the collimation axis of the UV ionisation cone, and a density bounded extended narrow line region (ENLR). However, they also realised that the line widths of the [Oiii] are indicative of a NLR rather than an ENLR, and in addition for such a model to apply, the NE side of the disk would have to be closer and hence the spiral arms would have to be leading rather than trailing. To circumvent these difficulties, they suggested that the radio collimation and [Oiii] outflow may not be due to the same mechanism.
These discrepancies cease to be issues – indeed, actually are expected – if instead one attributes the radio continuum to supernova remnants (SNRs). In this scenario, the knotty morphology could arise from the superposition of many SNRs, some of which are perhaps bright enough to be detected as individual radio supernovae. Supporting this, the bright northern knot apparent in the 18 cm map is a result of the low resolution of that map: Fig. 9 shows that the same knot seen in a low resolution 6 cm map breaks up into discrete structures at higher resolution. For such an interpretion, the details of the morphology have no more significance than tracing the locations of these stochastic events.
The flux density of the individual 6 cm knots in NGC 3227 is variable, with the brightest being 1–2 mJy (excluding the extended nuclear knot which probably comprises many SNR). This implies luminosities up to 3– W Hz-1, fully consistent with the range of 1– W Hz-1 for the peak 6 cm flux density of galactic radio supernovae given by Weiler et al. (2002). For comparison, in Arp 220, 16 radio supernovae with 18 cm luminosities 20– W Hz-1 (a factor 3 lower at 6 cm, assuming a spectral index ) were reported by Smith et al. (1998); and for the 24 sources monitored in the nucleus of M 82, 6 cm luminosities are in the range 0.1– W Hz-1 (Kronberg et al., 2000). In both these galaxies, most of the SNRs appear to have varied rather little in flux over respectively 5 and 12 year periods (Rovilos et al., 2005; Kronberg et al., 2000). The flux densities of the knots in NGC 3227 are therefore certainly consistent with their being radio supernovae.
We have superimposed the radio continuum data (naturally weighted, beam size, kindly made available and re-reduced by C. Mundell) and SINFONI data, as shown in Fig. 9. Since no astrometrical alignment is possible, we have assumed that the brightest 6 cm emission coincides with the peak in the K-band stellar continuum – justifiable if, as we suspect, the 6 cm emission is due to star formation. For this interpretation, the exact astrometrical alignment is not critical. An alternative alignment could be for the near infrared nucleus to lie between the two main emission knots seen in the 18 cm map of Mundell et al. (1995). However, this seems unlikely because, as we have shown, the jet-like structure is in fact small spread-out knots seen at low resolution. There is perhaps some correspondance between these off-nuclear 6 cm continuum knots, which tend to lie to the northwest, and the Br line which is also more extended in the same direction. Both of these can be understood in terms of a slight tendency for more, or more recent, star formation there. On the other hand, it is clear that there is little one-to-one correspondance between the 6 cm continuum and 1-0 S(1) line.
To estimate the emission within 0.8″, we take two extreme limits: that for the nucleus (i.e. southern component) only, as well as the total, both given by Mundell et al. (1995). We estimate the maximum AGN contribution by measuring the flux in the central 0.090″ (to include the full beam) as no more than 10% of the total. We have made no correction for this. Using the conversion given in Condon (1992) for these 6 cm and 18 cm flux densities, we estimate the supernova rate to lie within the range 0.008-0.019 yr-1.
4.5 Star Cluster Models
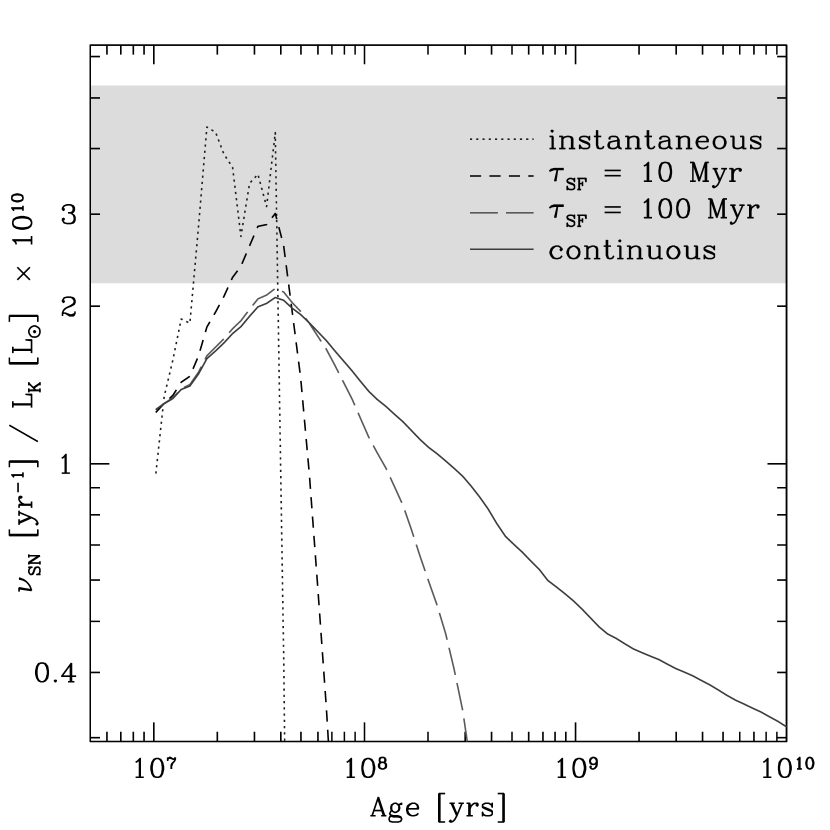
The discussion above has yielded two independent diagnostics which can be used to constrain the star formation history in the central arcsec of NGC 3227. The first is the (classical) equivalent width of Br. We use the ratio of the narrow Br associated with young stars (i.e. excluding the NLR contribution) to young stellar continuum, thus removing any bias associated with the AGN or bulge. The ratio we adopt is therefore Å, with an uncertainty of no more than 1.5 Å. The second is the ratio of the supernova rate to stellar continuum luminosity, which is –5.3. These ratios are presented graphically together with models for various star formation histories in Fig. 8, allowing some conclusions to be drawn immediately.
The is too low for the star formation to be continuous, a result supported by the which is sufficiently large that it permits only young ages. This conclusion is robust even to large uncertainties in the two parameters. In particular Fig. 8 shows that the conclusion is valid even if either is overestimated by insufficient corretion for the NLR contribution, or if is overestimated by not correcting for a possible AGN component. Thus any star formation that did occur has now ceased. On the other hand, because there are already supernova remnants, at least 10 Myr must have elapsed since star formation began. Thus an instantaneous burst is ruled out, because of the steepness with which falls. For the intermediate histories, the age of the star formation is strongly constrained by , even if the ratio itself is rather uncertain, to be at most 50 Myr. Even if one allows the uncertainty in the conversion from continuum flux density to supernova rate, it would be hard to reach ages greater than 100 Myr. With this in mind, the low requires a short but finite burst timescale. The best model is for a burst with an e-folding decay time of 10 Myr which began 40 Myr ago. However, we emphasise that a unique match is not the aim of this modelling; the important result is that the star formation is very young, and that the active episode lasted for a finite time but is now finished. This is in interesting result, begging the questions: since stars form in cold quiescent environments, how did such intense star formation occur in this environment which is clearly extremely turbulent (as evidenced by the 1-0 S(1) morphology in Fig. 3 and the velocity dispersion of 100–125 km s-1, which is significantly higher than the rotational velocity of 50–100 km s-1)? Once started, what is it that caused the star formation to cease while the gas is still so plentiful? We address these questions in Section 6.
The properties we find for the star formation scenario given above for the measurements in a 0.8″ aperture are summarised in Table 2. The star formation has an initial rate of 3 yr-1, and a current rate of 0.05 yr-1. The current mass to K-band light ratio is , where the mass of refers to the current live stars rather than the total gas consumed during the active phase which is almost 50% greater. Remarkably, the current bolometric luminosity attributable to these stars is . This is a crucial result, since it implies that the extinction to the stars cannot be very great.
Fig 7 shows that within the central 0.8″ we discuss above, the intensity increases dramatically at ″ (9 pc). Within this smaller radius, the star formation models show that the mean stellar mass surface density is pc-2. Averaged over the last 40 Myr (i.e. since the burst began) the mean absolute star formation rate is only 0.13 yr-1, but the rate per unit area has been phenomenally high: typically 500 yr-1 kpc-2, and reaching rates 10 times higher intensity at its peak when it was active This is more like what one typically expects of ultraluminous galaxies, and suggests that during active star forming phases, which appear to last for similar timescales of a few 107 yr, the local (i.e. 10–100 pc) environment around AGN is comparable to that in ULIRGs.
4.6 Extinction
So far we have implicitly assumed that there is negligible extinction, and already we account for 20% of the bolometric (i.e. 0.3–1000µm) luminosity of the entire galaxy.
If we take the reasonable stance that the gas and stars are mixed (rather than the gas lying in front of the stars as a foreground screen), then when considering the effects of extinction we should use the appropriate mixed model for which the reduction in observed intensity depends on optical depth through the gas and stars as . The usual scaling of the optical depth with wavelength still applies, as does the definition of the reddening . This means that in contrast to the screen model for which , in the mixed model a modest observable reddening can hide the existence of a very large optical depth of gas and dust since (for ). Note, however, that often extinctions for mixed models are given as a sort of ‘screen equivalent’, giving rise to very large values. To avoid this confusion when discussing flux attenutation, in the remainder of this paper we refer to the more physical quantity optical depth rather than the observationally motivated extinction .
As an illustration, a reasonable optical depth of for the mixed model would mean that 90% of the UV and optical light, which dominate the spectral energy distribution, would be re-radiated in the mid- to far-infrared. Additionally, the scale of the starburst would increase since becomes 1.6 times that observed. Thus the net effect is that the bolometric luminosity of the starburst would be and account for approximately 50% of the infrared (8–1000µm) luminosity (although none of the optical luminosity). Similarly, one can derive the maximum possible mixed model optical depth, for which the starburst accounts for all the 8–1000µm luminosity, to be . This is a strong constraint on the extinction, and we return to this point in Section 6.3.
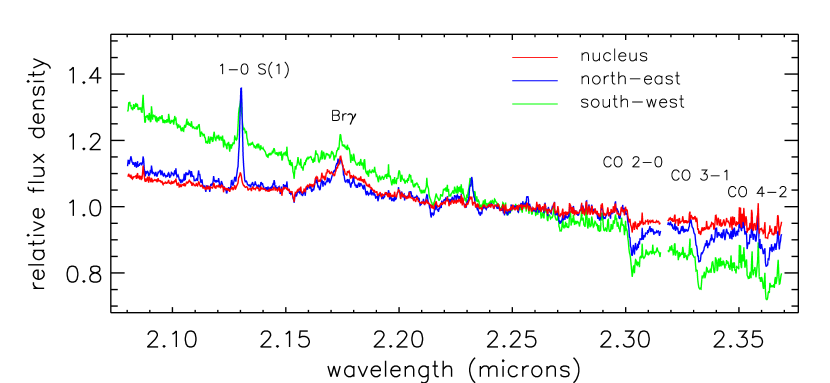
Do we see evidence for any extinction? The F160W image in Fig. 2 highlights a curious feature in the central arcsec. In addition to the bright point source associated with the AGN, there is a strong contrast in brightness between the SW and NE sides of the nucleus – corresponding respectively to near and far sides of the galactic disk for the orientation above. This is reflected in the corresponding spectra extracted from the SINFONI data cube, as Fig. 10 shows. The nuclear spectrum is characterised by a flat slope and shallow CO bandheads indicative of dilution by hot dust and perhaps also extinction. The spectrum to the south-west has a bluer slope and deeper bandheads, both consistent with pure un-reddened stellar light. In contrast, the north-eastern spectrum has deep bandheads but a flatter slope, suggesting it is reddened (but not diluted). A differential extinction (screen model) of would produce the observed change in spectral slope. On the other hand, for the mixed model, any (largish) extinction is possible. For a mixed model, the differential extinction between 2.1 and 2.3µm saturates at this level, and cannot make the slope redder. One might conclude that while the star formation on the south west side might be predominantly unobscured, that on the north east side is probably mixed with considerable dust and gas. Conversely on larger scales of 1–2″, Chapman et al. (2000) found evidence from optical and infrared colour maps for greater extinction on the south west side.
5 Stellar Kinematics and the Black Hole Mass
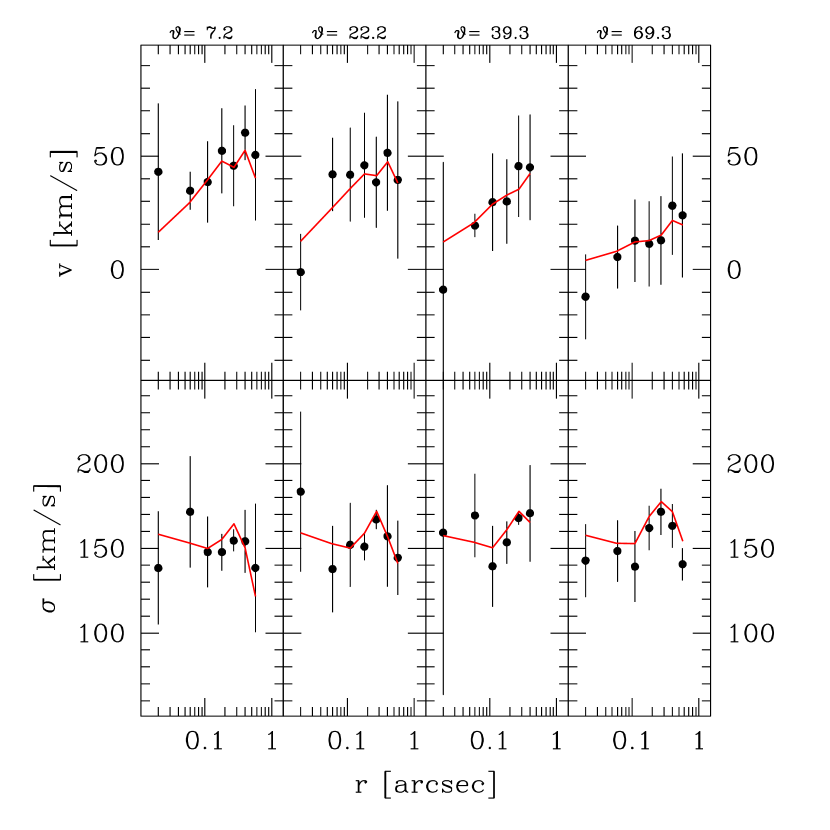
None of the velocity fields in Fig. 4 show evidence for the extreme warp proposed by Schinnerer et al. (2000) based on their 0.6″ resolution CO (2-1) data. The existence of a small warp would not be surprising since very high spatial resolution mapping of masers indicate that on small spatial scales warps may be common in galaxy nuclei – for example NGC 4258 (Herrnstein et al., 1996), NGC 1068 (Greenhill et al., 1996), and Circinus (Greenhill et al., 2003). The reason for the apparent discrepancy is that Schinnerer et al. 2000 had interpreted the high gas dispersion as spatially unresolved rotation or inflow – whereas our data show that the gas dispersion km s-1 is intrinsically high. This is not very different from the stellar dispersion of 140–160 km s-1, which indicates that random motions rather than ordered rotation dominate the kinematics of the stars. As indicated above, the observed data are the superposition of kinematics of the bulge and nuclear component, and this may be responsible for some of the unusual characteristics of the dispersion most easily seen in Fig. 11. This shows that is constant at larger radii (out to our radial limit) but decreases at 0.1–0.2″. This is exactly the radius at which Fig. 7 shows an increase in the intensity of the stellar light from the nuclear component. It is therefore possible that at larger radii the observable is dominated by the older bulge, but at smaller radii is more strongly affected by the stars in the nuclear region. If this is indeed the case, then the subsequent increase of very close to the nucleus could be due to the influence of the black hole.
To test whether the behaviour of is consistent with what one might expect from the nuclear star cluster and black hole, we have made a simple dynamical model. This is realised as an edge-on thin disk for which the mass profile follows the luminosity profile given in Fig. 7, and accounts for both the gas and stellar mass. For this purpose, we have ignored the luminosity from the large scale bulge (denoted by the dashed line in the figure). To simulate the random motions which we have shown are important, we have convolved the model spectrally with a Gaussian having km s-1. The model is then convolved with the effective spatial resolution and finally ‘observed’ (see Davies et al. 2004a, b for more details of how the model is generated). Although this model does not represent the true 3-dimensional mass distribution, the radial distribution is correct and hence it is able to provide a first estimate of the way in which the velocity dispersion changes with radius. In addition it can, at least quantitatively, show how the rotation velocity is expected to change with radius. The first conclusion is that the increase in at ″ is indeed consistent with the nuclear mass distribution and presence of a black hole with mass of order M⊙. The second conclusion confirms that, as expected, the system cannot be rotationally supported: the measured velocities in Fig. 11 are only 60–65% of those needed for this. Nevertheless, the steep increase in Vrot out to ″ and subsequent more gradual rise do match the shape of the model rotation curve.
In order to understand the kinematic behaviour more fully and to determine from the stellar kinematics, we have constructed an appropriate Schwarzschild orbit superposition model, which is described and discussed below. NGC 3227 is a good candidate for such an analysis because it has already been the focus of other efforts to derive . These include reverberation mapping, which yielded M⊙ (Peterson et al., 2004); X-ray variability measurements, giving M⊙ (Nikolajuk et al., 2004); and the relation itself, leading to M⊙ (Nelson et al., 2004). Based on these masses and the velocity dispersion of 136 km s-1 measured by (Nelson et al., 2004), one can estimate the ‘radius of influence’ of the black hole to be 8 pc. Hence the black hole dominates the dynamics in the central 16 pc, a region which is easily resolved at our 7 pc FWHM spatial resolution.
5.1 Schwarzschild Modelling
Schwarzschild’s (1979) orbit superposition technique has become the standard tool for deriving MBH from the kinematics of the surrounding stellar spheroid. The procedure commonly involves four steps: (1) the photometry is deprojected to get the luminosity distribution of the stars; (2) a gravitational potential is constructed from trial values for the stellar mass-to-light ratio and the black hole mass ; (3) thousands of orbits in this potential are combined to match the stellar luminosity distribution and the kinematical constraints; (4) and are systematically varied to find the optimal solution in a sense. The specific implementation of the method we use here is detailed in Thomas et al. (2004). The program is based on the code of the Nuker team (Richstone et al. in preparation) that has been used to measure black hole masses in numerous elliptical galaxies (Gebhardt et al. 2003), including Cen A (Silge et al., 2005). We apply these models here with the aim of constraining the black hole mass rather than necessarily deriving uniquely the kinematic structure of the entire system.
The validity of our models rests on two major assumptions: that the central region of NGC 3227 is (1) stationary and (2) axisymmetric. The first assumption is difficult to verify independently. From the quality of our fits to the data (cf. Fig. 16) we can however conclude that – within the uncertainties – this assumption is consistent with the data. To which degree the second assumption holds for NGC 3227 can be estimated from variations in the kinematics from quadrant to quadrant (cf. Sec. 5.1.2). Providing means to measure such variations is one of the advantages of using a full 2-dimensional field of view as we do here. The other advantage is that such data constrain the kinematics of all kinds of orbits that are needed to map the system.
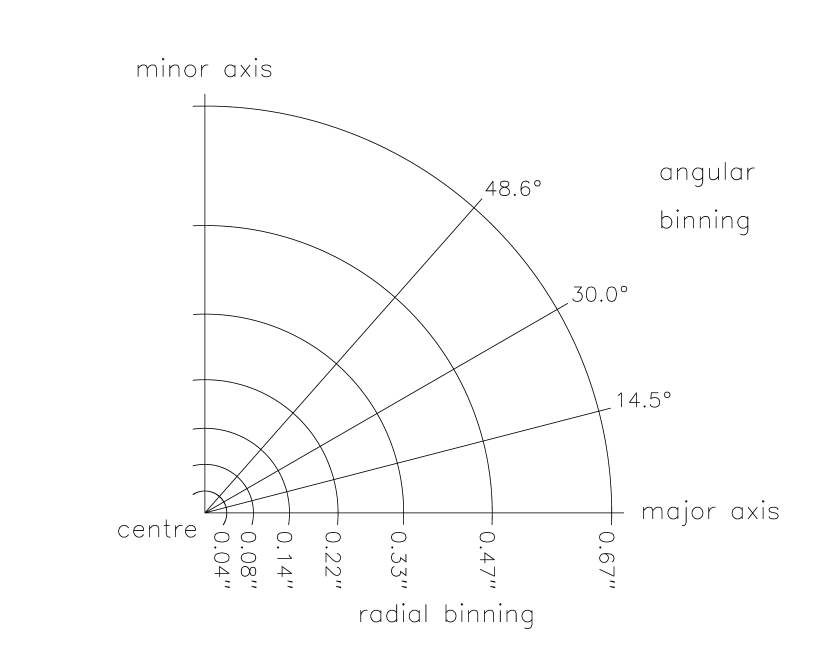
The present models for NGC 3227 are calculated on a grid with 7 radial and 4 angular bins in each quadrant (Fig. 12), giving a total which is comparable to the number of spatially independent regions in the data. The binning resolution is matched to sample more frequently the regions where the greatest variations in and are expected to lie. For each mass model about orbits are tracked (the initial factor 2 due to the inclusion of a prograde and retrograde version of each orbit) which, based on the criterion in Richstone et al. (2004) is easily sufficient.
We now discuss how the observations are prepared for the models.
5.1.1 Photometry
As we have shown, the luminosity distribution comprises two parts: the bulge and the nuclear star forming region.
The bulge, which has an profile with an effective radius in the K-band of 3.4″, contributes 40% of the nuclear K-band luminosity and outside of this immediate region dominates the K-band luminosity to a radius of 9″. Due to its high mass-to-light ratio (), it has an important effect on the model. We are unable to constrain its ratio directly, but from a literature search Förster Schreiber et al. (2003) found that empirical determinations lie in the range 10–30 M⊙/L⊙ – similar to those predicted by population synthesis models for old ( Gyr) populations.
The nuclear star forming region contributes 60% of the nuclear K-band luminosity and has a K-band luminosity profile that is well matched by an exponential profile with a change in scale length from 0.037″ to 0.38″ at 0.11″. Its ratio is well constrained via population synthesis models to be 0.5 M⊙/L⊙. However, its mass could be dwarfed by that of the molecular gas which lies in the same region and which we assume has the same radial profile. The gas clearly contributes significantly to the gravitational potential, and implies that the effective ratio should probably be rather higher.
As a novel feature of our models, and due to the uncertainties in the ratios, we allow the contributions of the two components to the total (stellar) mass-profile to be varied independently. To this end the nucleus and the bulge are deprojected separately using the program of Magorrian (1999) and combined via
| (1) |
Thereby, the (K-band) mass-to-light ratios and of nucleus and bulge ( and are the corresponding deprojections) are assumed constant with radius. We set the ellipticity of nucleus and bulge . The inclination can be varied arbitrarily, but must be equal for both components (to ensure axisymmetry).
5.1.2 Kinematics
The velocity and dispersion were found for each radial and angular bin shown in Fig. 12, by calculating the mean of all spatial pixels within each bin, weighted according to the uncertainty of each measurement. The uncertainties were combined in a similar fashion to estimate the standard error of these means. The position angle which defines the major axis, and hence the orientation of the bins, is relatively well constrained. We have shown that on scales of 140 pc and more, there is no doubt that it is at . On the scales we consider here, less than 50 pc, the data indicate a preference towards . We have therefore adopted , which is sufficiently close to both limits that, given the size of the angular bins, the small uncertainty will have no impact on the resulting model. As input to the orbit models binned line profiles are generated from the measured kinematical parameters (see, for example, Thomas et al. 2005). Uncertainties in these parameters are propagated on the basis of Monte Carlo simulations.
The stellar dynamical determination of the black hole mass for NGC 3227 suffers from two difficulties: Firstly, due to the constraints of signal-to-noise, it was not possible to derive the Hermite terms and from the spectra in any meaningful way. These higher order moments, however, contain important information about the distribution of stellar orbits (Dehnen & Gerhard, 1993). Unfortunately, due to the so-called “mass-anisotropy degeneracy” uncertainties in the orbit distribution directly translate into uncertainties in the derived black-hole masses. Anyway, in order not to bias our models we allow for a rather large range of and by using when deriving the line profiles and their uncertainties.
The second limitation originates in the quadrant-to-quadrant variations of and , which are generally larger than the statistical errors. This indicates that the modelled region is not exactly axisymmetric. When averaging the kinematics from the four quadrants these variations are taken into account in the error bars.
In summary, the assigned error bars to the kinematical input parameters are rather large and mostly reflect (1) systematic uncertainties related to central deviations from axisymmetry and (2) our ignorance about the higher order Gauss-Hermite moments.
5.2 The Black Hole Mass of NGC 3227
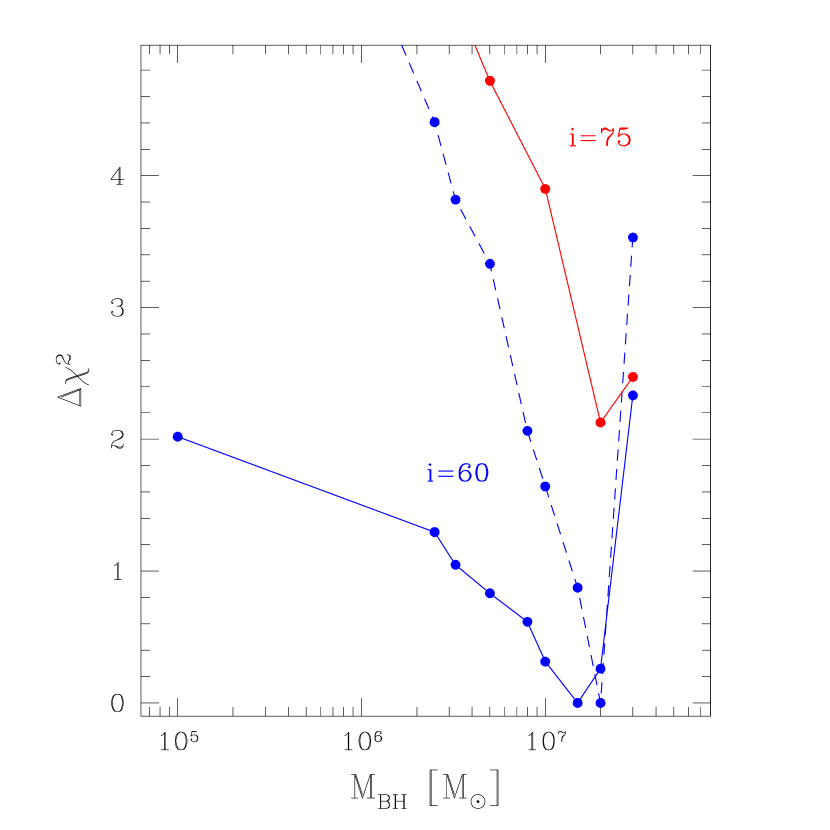
The results of the modelling are shown in Figs. 13–16. The best fitting model has an inclination of (fully consistent with that of the isophotes) and its black hole mass is M (Fig. 13). The corresponding stellar mass-to-light ratios are and , respectively. As Fig. 13 shows, the difference between and is formally only at the one sigma level. In any case, the best-fit black-hole mass does not depend strongly on the assumed inclination.
It turned out after the modeling that the uncertainties assigned to and probably overestimate the actual freedom in the orbit distribution. From all calculated models we found the 68 percentiles and , respectively. Consequently, the variations in the fitted models are much smaller than the orignially allowed . To illustrate the effect this has on the derived confidence intervals we have rescaled these error bars to a third of their original value and recalculated . The result for the case is shown as the dashed line in Fig. 13. As apparent, it does not alter the best-fit black-hole mass significantly, but changes the confidence intervals drastically.
In the discussion above, we have allowed the Schwarzschild model to find the best mass to light ratios as free parameters. On the other hand, as previously intimated, these are in fact already limited by external constraints based on other arguments, leaving MBH as the only truly free parameter. In particular for the bulge is unlikely to exceed 30 M⊙/L⊙ (Förster Schreiber et al., 2003); and the effective (stars plus gas) for the nuclear component is likely to be in the range 1–5M⊙/L⊙ (Sec. 6.3). It is for this reason that in Fig. 14, which shows the dependencies between the three dynamical parameters, we have calculated confidence intervals for each pair of parameters assuming that the third is fixed. The combination of the degeneracies and the external constraints puts stronger limits on the range of possible black hole masses than the Schwarzschild modelling alone.
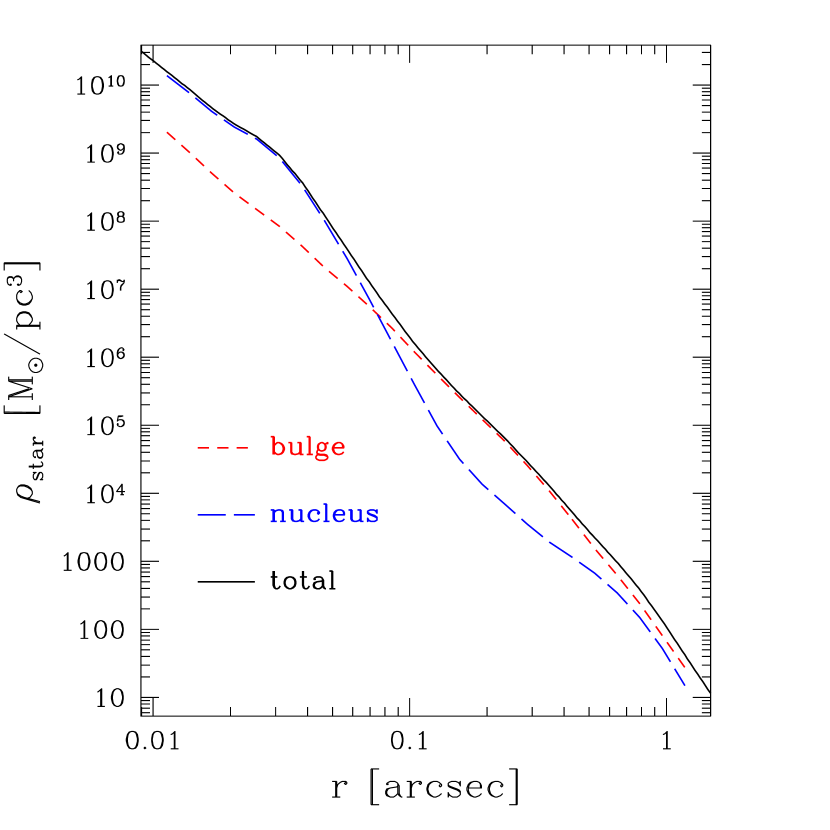
The figure shows a degeneracy between and MBH. Black hole masses of M M⊙ can be fit with . The reason for the degeneracy is illustrated in Fig. 15: the nuclear component dominates the stellar mass density in the centre inside 0.1″ and a larger can therefore compensate a lower MBH. Since its contribution to the central mass density is lower, the bulge is less dependent on the black-hole mass. But due to their similar light-profiles around 1.0″, the bulge and nuclear mass-to-light ratios are coupled strongly to each other. From Fig. 14, we find that the ratio for the bulge should lie in the range /L⊙; and much higher ratios are unlikely. This is within the range mentioned above, and gives us confidence that the model is converging on a physically meaningful solution.
In summary, we conclude that the range of MBH we derive – which we stress again is rather large due to the uncertainties discussed in Sec. 5.1.2 – is reasonably robust to the uncertainties in the input parameters. The limits of the range are set not only by the Schwarzschild models themselves but also by additional constraints on the mass to light ratios which, through degeneracies between the parameters, affect the black hole mass. The upper end is consistent with, although still less than, the other mass estimates mentioned at the start of the Section; while the lower end is an order of magnitude smaller, suggesting that these techniques may tend to overestimate the black hole mass. Nevertheless, that the preferred black hole mass we derive via Schwarzschild modelling is within a factor of 2–3 of the masses found by other means and suggests that all methods are reasonable at least to this level of accuracy. With respect to the relation, it is interesting that in contrast to NGC 3227 where we have found above that the stellar dynamical mass is a factor of a few less than the relation predicts, the equivalent mass for Cen A (Silge et al., 2005) is a factor of several greater. This suggests that, while the relation may be useful for order-of-magnitude estimates, the scatter for active galaxies may be significantly larger than that for quiescent galaxies.
6 Molecular Gas and the Torus in NGC 3227
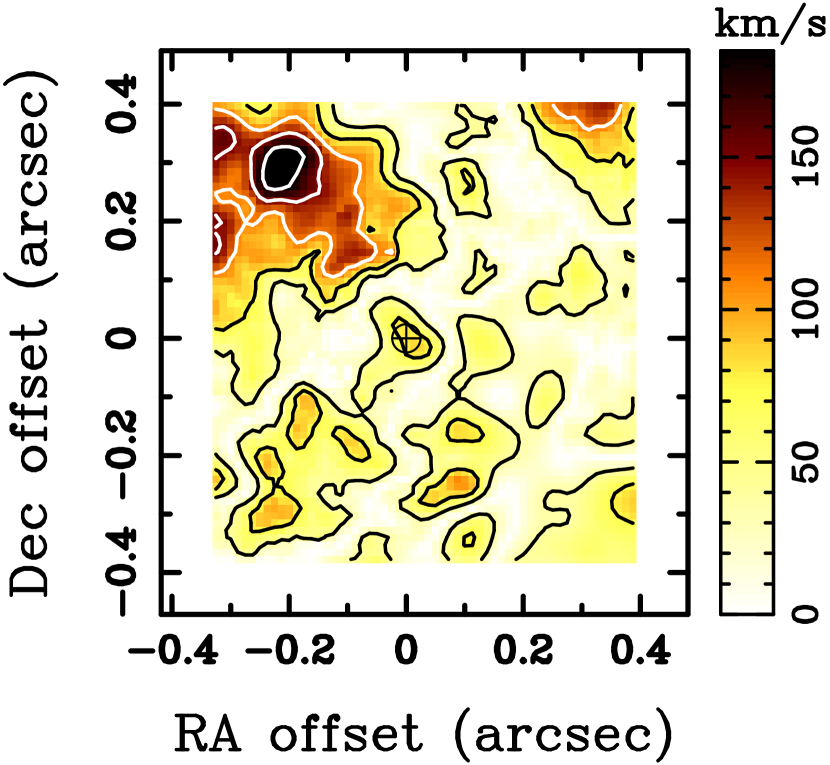
The 1-0 S(1) morphology in Fig. 3 is remarkably complex. As has been noted by Schinnerer et al. (2000) and Baker (2000) on larger scales for the cold molecular gas, we now find on smaller scales for the hot molecular gas that the nucleus itself is not identified with the strongest emission. The distribution is rather elongated at a position angle of (we note that there are inherent uncertainties and difficulties due to the continuum subtraction associated with the reported by Quillen et al. (1999) and the 45–70∘ from Fernandez et al. (1999)). It is tempting to interpret the emission in terms of a bar and arclets. However, the kinematics and particularly the surprisingly high velocity dispersion of 100–125 km s-1 argue against it; a more natural interpretation is in terms of a highly turbulent medium, in which nevertheless the bulk of the gas follows uniform rotation. There do appear to be some non-rotational motions, but associated only with weaker 1-0 S(1) emission and restricted to the galaxy’s minor axis. This may indicate that some of the hot H2 is influenced by outflows, or that the emission from hot gas which we see here does not reflect well the distribution of the cold gas. Fig. 4 shows that the velocity field of the brighter emission – corresponding to 2/3 of the flux in our field of view, and hence also the bulk of the gas mass – exhibits pure rotation. These facts leads one towards the conclusion that most of the gas in the nucleus probably exists in a thick rotating disk.
Fig. 18 supports this interpretation. It shows the rotation velocity , corrected for inclination, and the dispersion for the molecular gas. The data from the CO (2-1) data (Schinnerer et al., 2000) at larger scales and the SINFONI data on smaller scales are fully consistent. Also shown is the local ratio (rather than the global version which compares the maximum rotation velocity to the central dispersion). At ″ the ratio clearly implies that the gas lies in a thin disk. At smaller radii, the ratio decreases smoothly, indicating that the gas distribution becomes geometrically thicker with respect to the radial scales.
6.1 Star Formation, Molecular Gas, and the Torus
Above we argue that the gas lies in a thick disk, and in Section 4.2 that this is also the most likely distribution for the stars. Although the morphologies appear different – the stellar continuum is more centrally concentrated and the isophotal position angle is closer to north – much of this arises from the bulge contibution to the light. Crucially, the kinematics for the gas and stars are remarkably similar: the clear velocity gradient at PA -30 to -45∘, and the high dispersion of more than 100 km s-1. Because they exist on similar spatial scales of a few tens of parsecs and exhibit similar kinematics, we conclude that the stars and gas are physically mixed.
Scales of a few tens of parsecs are exactly those on which theoretical models predict the obscuring torus should lie (Pier & Krolik, 1992a, 1993; Granato & Danese, 1994; Nenkova et al., 2002; Schartmann et al., 2005). In addition, an important property of the torus is its ability to collimate the UV radiation from the AGN to produce ionisation cones whose apex lies close to the AGN, i.e. it is geometrically thick. We have argued that our data show the gas and stellar distributions are thick. Our further conclusion is therefore that the gas and stars we see in the nucleus of NGC 3227 represent much of what is understood by the term ‘obscuring torus’.
The idea of a star forming torus is not new, and has already been modelled by Wada & Norman (2002) and Wada (2005) in response to the evidence that about half of Seyfert 2 nuclei have a nuclear starburst. However, from this work and that presented by Davies et al. (2004a, b), it is now becoming clear also for type 1 Seyfert nuclei that star formation on scales associated with the torus is an energetically important process.
If the gas associated with the 1-0 S(1) emission were indeed part of the obscuring torus, it would need to have a third crucial property: a high column density. We address this issue in Section 6.3, but first consider below how the vertical height of the gas distribution might be maintained.
6.2 Supporting the Vertical Thickness of the Torus
That the torus in NGC 3227 is vertically extended is clear from Fig 18: the km s-1 velocity dispersion of the gas is larger than its inclination corrected rotational velocity out to radii of 30–40 pc. Even the lower CO (2-1) dispersion of km s-1 is still significat compared to the rotation velocity to these radii. Thus the kinetic energy is dominated by random motions and implies a more spheroidal structure rather than simple ordered rotation in a thin disk. Its constituent molecular clouds will undergo cooling via collisions on short timescales, comparable to the orbital period of a few million years. As a result energy must be constantly injected into the interstellar medium in order to maintain the vertical structure. The sources available to supply this energy are the AGN and the starburst, the latter via both radiation pressure and mechanically through supernovae. Such a situation may also provide, at least qualitatively, an answer to why the star formation should have stopped while there is still a large gas reservoir.
The effect of radiation pressure from the AGN itself has been explored by Pier & Krolik (1992b), and in their model depends primarily on the Eddington ratio of the black hole and the clumpiness of the torus. For the black hole mass, we adopt a value commensurate with our range foudn in Section 5.1, and those from X-ray variability (Nikolajuk et al., 2004) and reverberation mapping Onken et al. (2004), that is M M⊙. For the AGN luminosity, we take half the bolometric luminosity since the other half is supplied by the nuclear starburst, that is LL⊙. Since the Eddington luminosity LMBH in solar units, this yields an Eddington ratio of LBH/L. This value is an order of magnitude smaller than the ratio of 0.1 that Pier & Krolik (1992b) found, was needed for a smooth torus to be thick and static. On the other hand, for tori consisting of large clumps, they found that in the range an equilibrium would exist for thick tori with where is the inner radius and is the full height in the body of the torus. In the case of NGC 3227 this could explain a thickness of up to a few parsecs but not the ten to a few tens of parsecs implied by the velocity dispersion, unless the AGN was much more active in the recent past.
The possibility that supernovae might heat the molecular torus is treated specifically in the models of Wada & Norman (2002). However, because the coupling from supernova energy to kinetic energy of the ISM is rather weak, they used a very large supernova rate of yr-1. This is two orders of magnitude larger than the current rate in the central 60 pc of NGC 3227, which is already close to the maximum for our best fitting star formation history. Hence, although they were able to reach scale heights for the torus of 10–20 pc, it seems unlikely that this could work for NGC 3227.
Recently, Thompson et al. (2005) have addressed the issue of whether radiation pressure from the starburst itself can provide the vertical support. For NGC 3227 it is not clear that their optically thick model can be applied, since we have argued in Section 4.6 that the extinction must be low enough that even in the near infrared the optical depth cannot exceed and is probably no more than . In their optically thin limit – where the optical depth to UV photons is 1 while to infrared photons from dust reprocessing it is 1 – they derive the star formation rate necessary to maintain marginal Toomre stability (), which for their model would give a scale height of 10 pc at a radius of 30 pc. If we assume a gas fraction of unity, and km s-1 as measured for the 1-0 S(1) line we find a star formation rate 20 M⊙ yr-1 would be needed. This is two orders of magnitude greater than the current rate derived in Section 4.5 but only a factor of 6–7 more than the peak rate when the star formation was active. There are two ways to reconcile this difference. Using the 60 km s-1 dispersion of the CO (2-1) data of Schinnerer et al. (2000), one finds the star formation rate necessary to maintain it is only 2.5 M⊙ yr-1. One could then argue that the higher dispersion of the 1-0 S(1) line is due to the fact that this line traces only the hot gas, and therefore will be strongly influenced by small scale turbulence. Alternatively, one could argue that the gas fraction is less than unity: for , one derives a star formation rate of 5 M⊙ yr-1.
Either of these alternative estimates are reasonably consistent with the peak rate derived from the observations. However, they are both still far greater than the current rate. It is perhaps conceivable that the molecular gas and star formation do not reach an equilibrium state. Instead, we speculate that what we are seeing is evidence for marginal Toomre stability: that once the gas cools, star formation may begin; but that once radiation pressure from the young stars is sufficiently high to heat the gas disk so that its turbulence increases and it thickens, star formation can no longer proceed. The molecular gas will then cool as the stars age, and sink back into a thinner configuration, allowing the process to start again. To investigate this in a more quantitative sense, we have calculated the Toomre parameter, which defined in the usual way as
where, using the data in Fig. 18, is the velocity dispersion and is the epicyclic frequency. The mass surface density we have estimated as follows. For the CO (2-1) data it is derived from the velocity curve under the approximation of Keplerian rotation in a thin disk. For our SINFONI 1-0 S(1) data, we have considered two cases: is constant within the area considered; and follows the stellar light distribution, being centrally concentrated. For both of these we have assumed a total mass out to ″ of M⊙ (see Section 6.3). The true distribution will lie somewhere between these two extremes. The resulting estimates of are shown in Fig. 19. The difference in derived from the 1-0 S(1) and CO (2-1) data is a direct result of the differing apparent in Fig. 18 and to which depends on the details of the rotation curve. What the figure shows is that as one approaches the nucleus from large radii of 1–2″, increases; and within 0.5″of the nucleus, on average . Thus, the nuclear region does appear to be too dynamically hot to form stars. Based on the star formation timescale we derived earlier, we suggest that cycle of heating and cooling probably occurs on relatively short timescales of order 100 Myr. Thus time-dependent modelling may be necessary if the geometry of the torus changes as the star formation or AGN fuelling pass through successive active and quiescent phases.
6.3 Mass and Column Density of the Gas
The final thread in our analysis of whether the molecular gas in the nucleus of NGC 3227 can be identified with the obscuring torus concerns its column density. Our data trace only the hot 1000 K H2 through the 1-0 S(1) line, for which our flux of 1.1 W m-2 in a 0.8″ aperture is consistent with that in Rodríguez-Ardila et al. (2004) and Quillen et al. (1999). Remarkably, it is possible to use this to make a reasonable estimate of the total molecular gas mass.
That there exists a relation between molecular mass and 1-0 S(1) luminosity in actively star forming galaxies should not be surprising, given that relations are already known between 1-0 S(1) and infrared luminosity (Goldader et al., 1997), and between and CO luminosity which traces gas mass (Young & Scoville, 1991). By comparing the 1-0 S(1) line luminosities of 17 luminous and ultraluminous galaxies experiencing intense star formation (some of which also host an AGN) to gas masses derived from millimetre CO 1-0 luminosities, Mueller Sánchez et al. (2006) found that
with a standard deviation of about a factor of 2. The exception to this was NGC 6240 which is known to be overluminous in 1-0 S(1) and for which the scaling factor is by far the lowest, about an order of magnitude less than the typical value. The most likely reason for this is that the line does not originate in star formation, but is due to cloud collisions resulting from the extreme turbulence in the gas (Sugai et al., 1997; Tacconi et al., 1999). This particular case therefore provides us with a way to estimate a conservative lower limit on the gas mass using
For NGC 3227 this relation implies a gas mass in the central 0.8″ (65 pc) exceeding 4 and perhaps as much as (2–8) .
We now compare this range of estimates to three other constraints on the mass. In Section 4.5 we found that the mass-to-light ratio of the stars in this same nuclear region is , with a young stellar mass of . On the other hand, the Schwarzschild modelling in Section 5.1 implies that the most likely effective mass-to-light ratio including gas, is . And this result would imply a gas mass in the nuclear region of , and a most likely mass of about half this.
The mass estimated by Schinnerer et al. (2000) is rather less, but did not include any correction to take into account the random motions inferred from the large velocity dispersion. We can make a rough estimate of the dynamical mass by including with the Keplerian the contribution of these random motions so that (where the factor 3 comes from a simple comparison of the kinetic energies associated with the two quantities). Taking from the CO (2-1) data in Fig. 18 that km s-1 at 0.4″ radius and km s-1, we find M⊙.
Finally, in Section 6.2 we argued that, if radiation pressure does support the vertical thickness of the gas distribution, then the gas fraction may be only , implying equal masses of stars and gas. Thus could perhaps be as low as .
All the estimates above point to the same range of masses, and so we can conservatively claim that the gas mass is most likely 2– . While there is an order of magnitude uncertainty, this still has important implications. Assuming the gas is uniformly distributed over the 0.8″ aperture, the mean column density through the entire region would be –8) cm-2. If the gas does represent the torus, then such a large column should not be unexpected since there are many examples of type 2 AGN for which hard X-ray observations indicate that the AGN itself is hidden behind similar amounts of gas – although it should be noted that the X-ray absorption may occur on very small scales. Two particularly well known cases are: NGC 4945, for which the bright nuclear emission below 10 keV is completely blocked, implying an absorbing column of cm-2 (Iawasawa et al., 1993; Done et al., 1996); and Circinus, for which the absorbing column was estimated to be cm-2 based on the direct detection of X-rays at energies greater than 10 keV (Matt et al., 1999).
For a standard gas-to-dust ratio with , the column density implies an optical depth in the visual of . Since we are implicitly assuming that the stars are mixed with the gas rather than hidden behind a foreground screen, we must again use the mixed extinction model which we have used previously. Hence we can compare directly the optical depth estimate here with the maximum possible to the stars of from Section 4.5. The two estimates are totally inconsistent with each other. The solution to this contradiction lies in the gas, instead of having a uniform distribution, being concentrated into clumps. If the clumps are sufficiently compact then most lines of sight will not be intersected – and hence the stellar light will suffer little extinction. The degree of clumpiness need not be extreme: even local increases in density of a factor of a few would be sufficient to reduce the covering factor of the gas to half, consistent with the maximum stellar extinction.
The gas density in these clumps will be high: the mean density over the whole region for a uniform distribution and assuming the gas is extended vertically as much as it is laterally (i.e. by 60 pc) is (4–40) cm-3. This is already comparable to the typical densities in parsec-scale cores of molecular clouds. It is therefore no surprise that, as reported by Rodríguez-Ardila et al. (2004), the near infrared H2 line ratios indicate that the hot gas is thermalised.
In summary, we have used several independent mass estimates to put limits on the gas mass within 30 pc of the AGN. This mass implies very significant column densities of gas, easily sufficient to fulfil the third criterion of the obscuring torus mentioned in Section 6.1. Thus, we can conclude that the gas we have observed via the 1-0 S(1) is likely to be associated with the molecular torus. If so, then we have demonstrated that the gas in the torus is clumpy in nature, and that the torus supports episodes of active star formation.
6.4 The Inner Edge of the Torus
A curious result from the datacube is that the 2.1 and 2.3µm continuum centroids do not coincide. Since the stellar continuum increases to shorter wavelengths, while the non-stellar continuum (i.e. hot dust emission associated with the AGN) increases to longer wavelengths, this can be most easily explained if these two continua are offset from one another. However, the scales involved are similar to those expected for differential refraction between the two wavelengths, about 0.01″, and this makes the two phenomena difficult to disentangle.
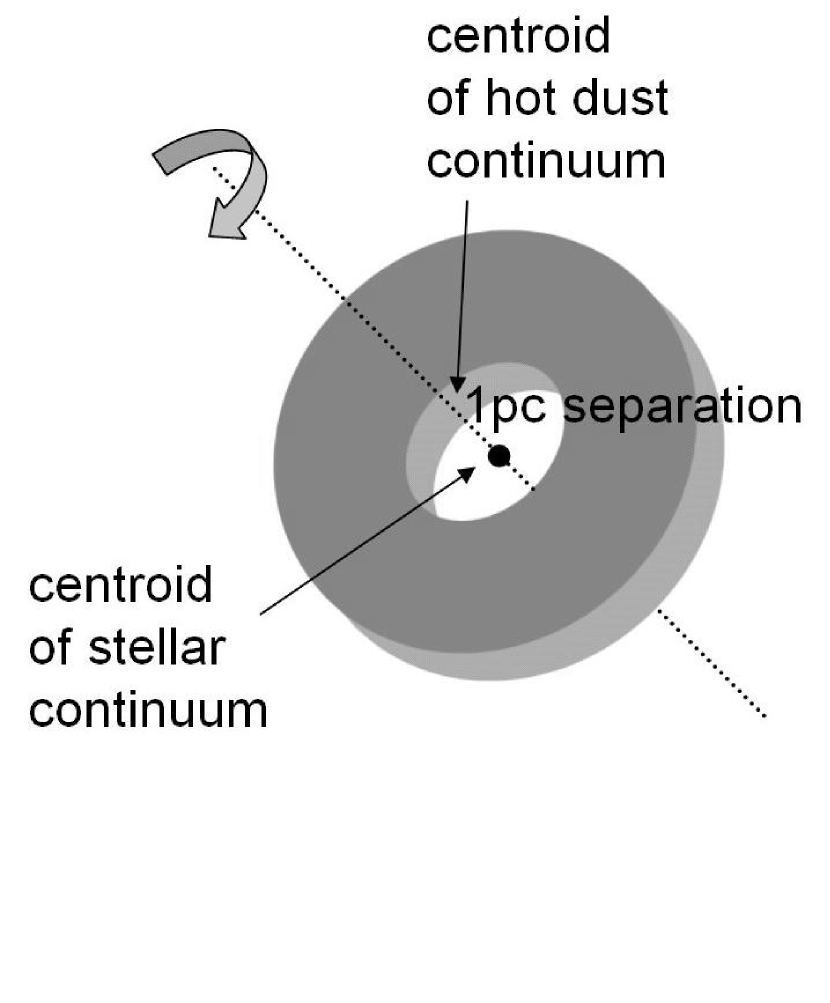
Instead, we can consider the separation of the continuum into its stellar and non-stellar components via the CO bandheads longward of 2.3µm. Because the two components are derived at the same wavelength, they are not susceptible to differential refraction. Yet the offset clearly remains, as shown in Fig. 20: the non-stellar continuum is shifted by about 1 pixel (0.0125″ or 1 pc, approximately 1/8 of the PSF size) to the north-east. This effect is not due to a few pixels which happen by chance to be brighter or fainter, but is a systematic global shift of the entire feature; and is significant with respect to the pixel formal errors in each axis from a Gaussian fit to the respective profiles.
Our interpretation is that we are seeing directly the inner edge of the torus. We have shown this schematically with the cartoon in the right panel of Fig. 20, where for simplicity we have drawn the torus as a uniform ring with sharp edges; this representation should not be taken too literally. If the torus is oriented in the same way as the larger (i.e. 100 pc) scales, it will be inclined with its major axis on a line from south-east to north-west. As a result, the inner edge will only be visible on the far side; the near side will be hidden by the outer layers, since the torus is presumably optically thick. Regardless of whether the torus is modelled as a uniform or clumpy medium, its inner boundary is always expected to be a radius of 1 pc (e.g. Schartmann et al., 2005). This distance is set by the sublimation temperature of the dust grains, since they cannot exist any closer to the AGN. Depending on the thickness and inclination of the torus, one then would expect the centroid of the observable emission from the hottest dust grains (i.e. those at K, heated by the AGN rather than by stars) to lie at a projected distance of 1 pc from the AGN itself. In contrast, since star formation occurs throughout the torus, the centroid of the stellar continuum is centered on the AGN. Hence one would expect to find, and indeed Fig. 20 shows, an offset between the stellar and hot dust continua.
7 Conclusions
We have presented new near infrared integral field spectroscopic data at 70 km s-1 FWHM spectral resolution of the Seyfert 1 nucleus in NGC 3227, making use of adaptive optics to reach a spatial resolution of 0.085″ (7 pc). In this paper we have addressed the issues of star formation and molecular gas around the AGN and their relation to the canonical obscuring torus; and we have analysed the stellar kinematics using Schwarzschild models to determine the black hole mass. Our main conclusions are:
-
•
The nuclear star forming region around the Seyfert 1 nucleus is spatially resolved, on scales of a few parsecs to a few tens of parsecs. The most recent episode of intense star formation began 40 Myr ago but has now ceased. Within 30 pc of the AGN this starburst still accounts for 20–60% of the galaxy’s bolometric luminosity. Despite showing evidence for moderate rotation, the stars’ kinetic energy is dominated by random motions indicating that they lie in a thick disk.
-
•
Schwarzschild modelling of the stellar kinematics lead to a black hole mass in the range M M⊙. The upper end is consistent with (although still less than) previous estimates made using other techniques. The large range arises through a degeneracy in whether mass is attributed to the black hole or the stars and gas, which can be resolved with better kinematic line profiles.
-
•
The gas in the central 80 pc of NGC 3227, exhibits several critical properties that are expected of a molecular obscuring torus: its spatial extent is a few tens of parsecs, it is geometrically thick, and it has column density of order – cm-2. This argues that the gas we have observed is the torus. Moreover, based on the similarity of their spatial extents and their kinematics, it is likely that the gas and stars are physically mixed. Thus the torus also supports episodes of active star formation.
-
•
It seems unlikely that the current level of AGN or star forming activity can inject sufficient energy into the ISM to maintain the vertical thickness of the torus. However, this was possible when the star formation rate was at its peak value. We speculate that the torus may heat and subsequently cool, changing its vertical profile, as the star formation and AGN go through active and quiescent phases.
References
- Antonucci & Miller (1985) Antonucci R., Miller J., 1985, ApJ, 297, 621
- Antonucci (1993) Antonucci R., 1993, ARAA, 31, 473
- Baker (2000) Baker A., PhD thesis, 2000, California Institute of Technology
- Begeman (1989) Begeman K., 1989, A&A, 223, 47
- Bonnet et al. (2003) Bonnet H., et al., 2003, in Adaptive Optical System Technologies II, eds Wizinowich P., Bonaccini D., Proc. SPIE, 4839, 329
- Bonnet et al. (2004) Bonnet H., et al., 2004, in The ESO Messenger, 117, 17
- Cameron et al. (1993) Cameron M., et al., 1993, ApJ, 419, 136
- Cappellari & Copin (2003) Cappellari M., Copin Y., 2003, MNRAS, 342, 345
- Chapman et al. (2000) Chapman S., Morris S., Walker G., 2000, MNRAS, 319, 666
- Cid Fernandes et al. (2001) Cid Fernandes R., Heckman T., Schmitt H., González Delgado R., Storchi-Bergmann T., 2001, ApJ, 558, 81
- Cid Fernandes (2004) Cid Fernandes R., 2004, in The Interplay among Black Holes, Stars, and ISM in Galactic Nuclei, eds. Storchi-Bergmann T., Ho L., Schmitt H., Proc. IAU Symp. 222, p.127
- Condon (1992) Condon J., 1992, ARA&A, 30, 575
- Davies et al. (2003) Davies R., Sternberg A., Lehnert M., Tacconi-Garman L., 2003, ApJ, 597, 907
- Davies et al. (2004a) Davies R., Tacconi L., Genzel R., 2004a, ApJ, 602, 148
- Davies et al. (2004b) Davies R., Tacconi L., Genzel R., 2004b, ApJ, 613, 781
- Davies et al. (2004c) Davies R., Tacconi L., Genzel R., Ott T., Rabien S., 2004c, in Advancements in Adaptive Optics, eds Bonnacini D., Ellerbroek B., Raggazoni R., Proc. SPIE, 5490, 473
- Davies et al. (2005) Davies R., Sternberg A., Lehnert M., Tacconi-Garman L., 2005, ApJ, 633, 105
- Davies et al. (2006) Davies R., Thomas J., Genzel R., Tacconi R., Mueller Sánchez F., 2006, to be submitted to ApJ
- Dehnen & Gerhard (1993) Dehnen W., Gerhard O. E., 1993, MNRAS, 261, 311
- Done et al. (1996) Done C., Madjeski G., Smith D., 1996, ApJ, 463, L63
- Eisenhauer et al. (2003a) Eisenhauer et al., 2003a, in Instrument Design and Performance for Optical/Infrared Ground-based Telescopes, eds Iye M., Moorwood A., Proc. SPIE, 4841, 1548
- Eisenhauer et al. (2003b) Eisenhauer et al., 2003b, in The ESO Messenger, 113, 17
- Fernandez et al. (1999) Fernandez B., Holloway A., Meaburn J., Pedlar A., Mundell C., 1999, MNRAS, 305, 319
- Ferrarese & Merritt (2000) Ferrarese L., Merritt D., 2000, ApJ, 539, L9
- Ferrarese & Ford (2005) Ferrarese L., Ford H., 2005, SSRv, 116, 523
- Förster Schreiber (2000) Förster Schreiber N., 2000, AJ, 120, 2089
- Förster Schreiber et al. (2003) Förster Schreiber N., Genzel R., Lutz D., Sternberg A., 2003, ApJ, 599, 193
- Garcia (1993) Garcia A., 1993, A&AS, 100, 47
- García-Burillo et al. (2003) García-Burillo S., et al., 2003, in Active Galactic Nuclei: from Central Engine to Host Galaxy, eds Collin S., Combes F., Shlosman I., ASP Conf. Ser., 290, p.423
- Gebhardt et al. (2000) Gebhardt K., et al., 2000, ApJ, 539, L13
- Gebhardt et al. (2003) Gebhardt K. et al., 2003, ApJ, 583, 92
- Genzel et al. (1995) Genzel R., Weitzel L., Tacconi-Garman L.E., Blietz M., Cameron M., Krabbe A., Lutz D., Sternberg A., 1995, ApJ, 444, 129
- Goldader et al. (1997) Goldader J., Joseph R., Doyon R., Sanders D., 1997, ApJ, 474, 104
- González Delgado, et al. (2001) González Delgado R., Heckman T., Leitherer C., 2001, ApJ, 546, 845
- Goodman & Tan (2004) Goodman J., Tan J., 2004, ApJ, 608, 108
- Granato & Danese (1994) Granato G., Danese L., 1994, MNRAS, 268, 235
- Greenhill et al. (1996) Greenhill L., Gwinn C., Antonucci R., Barvainis R., 1996, ApJ, 472, L21
- Greenhill et al. (2003) Greenhill L., et al., 2003, ApJ, 590, 162
- Gu et al. (2001) Gu Q., Dultzin-Hacyan D., de Diego J., 2001, RMxAA, 37, 3
- Heckman et al. (1997) Heckman T., González Delgado R., Leitherer C., Meurer G., Krolik J., Wilson A., Koratkar A., Kinney A., 1997, ApJ, 482, 114
- Herrnstein et al. (1996) Herrnstein J., Greenhill L., Moran J., 1996, ApJ, 468, L17
- Horne et al. (2004) Horne K., Peterson B., Collier S., Netzer H., 2004, PASP, 116, 465
- Iawasawa et al. (1993) Iwasawa K., Koyama K., Awaki H., Kuneda H., Makishima K., Tsuru T., Ohashi T., Nakai N., 1993, ApJ, 409, 155
- Ivanov et al. (2000) Ivanov V., Rieke G., Groppi C., Alonso-Herrero A., Rieke M., Engelbracht C., 2000, ApJ, 545, 190
- Jarrett et al. (2003) Jarrett T., Chester T., Cutri R., Schneider S., Huchra J., 2003, AJ, 125, 525
- Joguet et al. (2001) Johuet B., Kunth D., Melnick J., Terlevich R., Terlevich E., 2001, A&A, 380, 19
- Kaspi et al. (2000) Kaspi S., Smith P., Netzer H., Maoz D., Jannuzi B., Giveon U., 2000 ApJ, 533, 631
- Kaspi et al. (2005) Kaspi S., Maoz D., Netzer H., Peterson B., Vestergaard M., Jannuzi B., 2005, ApJ, 629, 61
- Kormendy & Richstone (1995) Kormendy J., Richstone D., 1995, ARA&A, 33, 581,
- Knapen (2004) to appear in Penetrating Bars Through Masks of Cosmic Dust: The Hubble Tuning Fork Strikes a New Note, eds Block D., Freeman K., Puerari I., Groess R, Block E., (Kluwer)
- Kormendy & Kennicutt (2004) Kormendy J., Kennicutt R., 2004, ARA&A, 42, 603
- Kronberg et al. (2000) Kronberg P., Sramek R., Birk G., Dufton Q., Clarke T., Allen M., 2000, ApJ, 535, 706
- Magorrian et al. (1998) Magorrian J., et al., 1998, AJ, 115, 2285
- Magorrian (1999) Magorrian J., 1999, MNRAS, 302, 530
- Maiolino et al. (1998) Maiolino R., Krabbe A., Thatte N., Genzel R., 1998, ApJ, 493, 650
- Maraston (2005) Maraston C., 2005, MNRAS in press, astro-ph/0410207
- Marconi & Hunt (2003) Marconi A., Hunt L., 2003, ApJ, 589, L21
- Martini et al. (2003) Martini P., Regan M., Mulchaey J., Pogge R., 2003, ApJ, 589, 774
- Matt et al. (1999) Matt G., et al., 1999, A&A, 341, L39
- Mazzarella et al. (1994) Mazzarella J., Voit G., Soifer B., Matthews K., Graham J., Armus L., Shupe D., 1994, AJ, 107, 1274
- Mundell et al. (1995) Mundell C., Holloway A., Redlar A., Meaburn J., Kukula M., Axon D., 1995, MNRAS, 275, 67
- Mueller Sánchez et al. (2006) Mueller-Sánchez F., Davies R., Genzel R., Tacconi L., Friedrich S., 2006, in prep.
- Nelson et al. (2004) Nelson C., Green R., Bower G., Gebhardt K., Weistrop D., 2004, ApJ, 615, 652
- Nenkova et al. (2002) Nenkova M., Ivezíc Ž., Elitzur M., 2002, ApJ, 570, L9
- Nikolajuk et al. (2004) Nikolajuk M., Papadakis I., Czerny B., 2004, MNRAS, 350, L26
- Oliva et al. (1995) Oliva E., Origlia L., Kotilainen J., Moorwood A., 1995, A&A, 301, 55
- Onken et al. (2003) Onken C., Peterson B., Dietrich M., Robinson A., Salamanca I., 2003, ApJ, 585, 121
- Onken et al. (2004) Onken C., Ferrarese L., Merritt D., Peterson B., Pogge R., Vestergaard M., Wandel A., 2004, ApJ, 615, 645
- Pedler et al. (1993) Pedlar A., Kukula M., Longley D., Muxlow T., Axon D., Baum D., O’Dea C., Unger S., 1993, MNRAS, 263, 471
- Peterson et al. (2004) Peterson B., et al., 2004, ApJ, 613, 682
- Pier & Krolik (1992a) Pier E., Krolik J., 1992a, ApJ, 401, 99
- Pier & Krolik (1992b) Pier E., Krolik J., 1992b, ApJ, 399, L23
- Pier & Krolik (1993) Pier E., Krolik J., 1993, ApJ, 418, 673
- Quillen et al. (1999) Quillen A., Alonso-Herrero A., Rieke M., Rieke G., Ruiz M., Kulkarni V., 1999, ApJ, 527, 696
- Raha et al. (1991) Raha N., Sellwood J., James R., Kahn F., 1991, Nature, 352, 411
- Richstone & Tremaine (1988) Richstone D., Tremaine S., 1988, ApJ, 327, 82
- Richstone et al. (2004) Richstone D., et al., 2004, astro-ph/0403257
- Rigopoulou et al. (1999) Rigopoulou D., Spoon H., Genzel R., Lutz D., Moorwood A., Tran Q., 1999, AJ, 118, 2625
- Rodríguez-Ardila & Viegas (2003) Rodríguez-Ardila A., Viegas S., 2003, MNRAS, 340, L33
- Rodríguez-Ardila et al. (2004) Rodríguez-Ardila A., Pastoriza M., Viegas S., Sigut T., Pradhan A., 2004, A&A, 425, 457
- Rovilos et al. (2005) Rovilos E., Diamond P., Lonsdale C., Smith H., Lonsdale C., 2005, MNRAS, 359, 827
- Salamnca et al. (1994) Salamanca I., et al., 1994, A&A, 282, 742
- Schinnerer et al. (2000) Schinnerer E., Eckart A., Tacconi L., 2000, ApJ, 533, 826
- Schinnerer et al. (2001) Schinnerer E., Eckart A., Tacconi L., 2001, ApJ, 549, 254
- Schartmann et al. (2005) Schartmann M., Meisenheimer K., Camenzind M., Wolf S., Henning Th., 2005, A&A, 437, 861
- Schmitt & Kinney (1996) Schmitt H., Kinney A., 1996, ApJ, 463, 498
- Schwarzschild’s (1979) Schwarzschild M., 1979, ApJ, 232, 236
- Shlosman & Begelman (1989) Shlosman I., Begelman M., 1989, ApJ, 341, 685
- Shlosman (2003) in AGN: From central engine to host galaxy, eds Collin S., Combes F., Shlosman I., ASP conf. ser. 290
- Silge et al. (2005) Silge J., Gebhardt K., Bergmann M., Richstone D., 2005 AJ, 130, 406
- Smith et al. (1998) Smith H., Lonsdale C., Lonsdale C., Diamond P., 1998, ApJ, 493, L17
- Sternberg (1998) Sternberg A., 1998, ApJ, 506, 721
- Sternberg et al. (2003) Sternberg A., Hoffmann T., Pauldrach A., 2003, ApJ, 599, 1333
- Storchi-Bergmann et al. (2001) Storchi-Bergmann T., González Delgado R., Schmitt H., Cid Fernandes R., Heckman T., 2001, ApJ, 559, 147
- Sugai et al. (1997) Sugai H., Malkan M., Ward M., Davies R., McLean I., 1997, ApJ, 481, 186
- Tacconi et al. (1999) Tacconi L., Genzel R., Tecza M., Gallimore J., Downes D., Scoville N., 1999, ApJ, 524, 732
- Thomas et al. (2004) Thomas J., et al., 2004 MNRAS, 353, 391
- Thomas et al. (2005) Thomas J., Saglia R., Bender R., Thomas D., Gebhardt K., Magorrian J., Corsini E., Wegner G., 2005, MNRAS, 360, 1355
- Thompson et al. (2005) Thompson T., Quartaert E., Murray N., 2005, ApJ, accepted
- Thornley et al. (2000) Thornley M., Förster Schreiber N., Lutz D., Genzel R., Spoon H., Kunze D., Sternberg A., 2000, ApJ, 539, 641
- Tremaine et al. (2002) Tremaine et al., 2002, ApJ, 574, 740
- Verma et al. (2005) Verma A., Charmandaris V., Klaas U., Lutz D., Haas M., 2005, SSRv., 119, 355
- Vestergaard (2002) Vestergaard M., 2002, ApJ, 571, 733
- Vestergaard (2004) Vestergaard M., 2004, ApJ, 601, 676
- Wada & Norman (2002) Wada K., Norman C., 2002, ApJ, 566, L21
- Wada (2004) Wada K., in Carnegie Observatories Astrophysics Series, Vol. 1: Coevolution of Black Holes and Galaxies, ed. Ho L. (Cambridge: Cambridge Univ. Press)
- Wada (2005) Wada K., 2005, in Superunification of AGN, held on Elba Island, Italy, May 2005
- Weiler et al. (2002) Weiler K., Panagia N., Montes M., Sramek R., 2002 ARA&A, 40, 387
- Young & Scoville (1991) Young J., Scoville N., 1991, ARAA, 29, 581
| Item | Measurementaa All measurements are given for a 0.8″ aperture centered on the continuum peak. | unit |
|---|---|---|
| H2 1-0 S(1) | 10.9bb Uncertainties are approximately W m-2 (3 times larger for the broad Br), and are dominated by calibration and from the stellar continuum features. | W m-2 |
| narrow Br | 4.6b,cb,cfootnotemark: | W m-2 |
| broad Br | 42bb Uncertainties are approximately W m-2 (3 times larger for the broad Br), and are dominated by calibration and from the stellar continuum features. | W m-2 |
| [Ca viii] | 1.5bb Uncertainties are approximately W m-2 (3 times larger for the broad Br), and are dominated by calibration and from the stellar continuum features. | W m-2 |
| total K-band continuum | 32 | W m-2 µm-1 |
| 3.6dd The dilution at 2.3µm implied by is greater than the mean dilution over the K-band which is centered at 2.18µm. | Å | |
| young stellar K-band continuum | 7.0ee Assuming a dilution over the K-band of 2.8; the uncertainty in this corresponds to no more than 20% uncertainty in stellar the continuum flux density. The division between young and old populations is based on the bulge and excess continua as shown in Fig. 6. | W m-2 µm-1 |
| old stellar K-band continuum | 4.5ee Assuming a dilution over the K-band of 2.8; the uncertainty in this corresponds to no more than 20% uncertainty in stellar the continuum flux density. The division between young and old populations is based on the bulge and excess continua as shown in Fig. 6. | W m-2 µm-1 |
| Item | Measurementaafootnotemark: | unit |
|---|---|---|
| (stellar) | 7.8 | |
| 2– | M⊙ | |
| young stellar component: | ||
| 7.6 | ||
| 9.5 | ||
| initial star formation rate | 3 | M⊙ yr-1 |
| current star formation rate | 0.05 | M⊙ yr-1 |
| age | 40 | Myr |
| e-folding decay time | 10 | Myr |
| 0.5 | M⊙/L⊙ | |
| M⊙ | ||