A Correlation Between Pre-Main Sequence Stellar Rotation Rates and IRAC Excesses in Orion
Abstract
Early observations of T Tauri stars suggested that stars with evidence of circumstellar accretion disks rotated slower than stars without such evidence, but more recent results are not as clear. Near-IR circumstellar disk indicators, though the most widely available, are subject to uncertainties that can result from inner disk holes and/or the system inclination. Mid-infrared observations are less sensitive to such effects, but until now, these observations have been difficult to obtain. The Spitzer Space Telescope now easily enables mid-infrared measurements of large samples of PMS stars covering a broad mass range in nearby star-forming regions. Megeath and collaborators surveyed the Orion Molecular Clouds (1 Myr) with the IRAC instrument (3.6, 4.5, 5.8, 8 ) as part of a joint IRAC and MIPS GTO program. We examine the relationship between rotation and Spitzer mid-IR fluxes for 900 stars in Orion for stars between 3 and 0.1 M☉. We find in these Spitzer data the clearest indication to date that stars with longer periods are more likely than those with short periods to have IR excesses suggestive of disks.
1 Introduction
The smallest molecular cores observed to date have at least 6 orders of magnitude greater angular momentum per unit mass than the Sun, suggesting that they would eventually greatly exceed the breakup velocity if no angular momentum was lost during the evolutionary process. It is widely believed that most if not all low-mass stars form with circumstellar accretion disks; accreting solar-like pre-main sequence (PMS) stars have rotational velocities 1/5th to 1/10th of breakup speeds despite the angular momentum transported to the star via accretion from its circumstellar disk. These fundamental observations lead to the conclusion that an angular momentum regulation mechanism must be at work during the accretion phase. Stellar winds alone as conventionally invoked cannot explain such angular momentum loss unless they operate completely differently than expected (see, e.g., Sills et al. 2000 and references therein); these young solar-like PMS stars are completely convective, so winds must slow the rotation of the whole star (not just the outer layers), and the timescale for winds to significantly slow a star’s rotation is longer than the evolutionary timescales involved here.
All recent thinking focuses on angular momentum transfer mechanisms intimately related to the accretion process itself. These include (a) transfer of stellar angular momentum to a spreading accretion disk (e.g. Königl 1991, Königl & Pudritz 2000), and (b) transfer of angular momentum to an accretion-driven wind, launched either at the disk/magnetosphere boundary (e.g. Shu et al. 2000) or elsewhere in the star-accretion disk system (Matt & Pudritz 2005). All of the above disk-related regulation mechanisms posit that an accretion disk is present, and that the central star is ‘locked’ (or nearly so) to a constant angular velocity fixed by the Keplerian speed at the radius at which the stellar magnetosphere and disk are linked (co-rotation radius) even as the PMS stars contract.
For more than 10 years (including, e.g., Edwards et al. 1993), observers have attempted to test the hypothesis that disk-related processes account for angular momentum regulation among solar-like PMS stars. The test is seemingly simple: compare the observed rotation periods or projected equatorial rotational velocities of PMS stars surrounded by disks (and thus, by hypothesis, regulated) with those that lack disks and are presumed free to spin up in response to contraction toward the main sequence absent a regulating disk. The results of these tests have, however, been mixed; for example, Rebull (2001) and Makidon et al. (2004) find no clear correlation between disk excess and rotation rate in Orion and NGC 2264, respectively, but Herbst et al. (2002) and Lamm et al. (2004) find such a correlation in these same clusters. Moreover, Herbst et al. (2002) find a weak correlation between the rotation rate and the size of the disk excess, which is not found by, e.g., Stassun et al. (1999) or Rebull (2001).
Two key factors complicate this apparently simple test and may lead to ambiguous results: (a) the inaccuracies inherent in near-IR excesses, and (b) the influence of sample size. Near-IR excesses (typically -band), although the most widely available, are not sufficiently robust, owing to the presence of inner disk holes and projection effects (see, e.g., Hillenbrand et al. 1998) and/or contrast between the disk and the photosphere and/or disk geometry (e.g., the size of the inner disk wall). These young stars are variable, and use of near-IR indicators is often also compromised by the vexing problem of non-simultaneity in the photometric observations (optical through infrared) typically used to derive -band excesses. A recent paper by Rebull et al. (2004) identifies the second key factor as the sample size. Rotation periods among young PMS stars surrounded by disks span a factor of 20. The broad period distribution among young PMS stars means that extracting a ‘signal’ of period changes between samples of stars surrounded by disks and those that lack disks requires a large sample before it is possible to distinguish ‘locked’ from ‘freely spinning’ objects. The fact that near-IR excesses ‘miss’ 30% of stars which longer wavelength observation reveal to have clear disk signatures complicates separation of disked and non-disked samples – a potentially fatal difficulty for small samples ( several hundred) stars.
We now are in a position to overcome both of these problems. Over the past decade, more than 1700 rotation periods have been measured for solar-like PMS stars, 900 in Orion alone. Moreover, the advent of the Spitzer Space Telescope (Werner et al. 2004) provides a powerful tool for robust identification of stars surrounded by disks, via observation of the IRAC channel 1 (3.6 ) IRAC channel 4 (8 ) color index – an index both highly diagnostic of emission arising in circumstellar accretion disks, and little influenced by inclination effects, inner disk holes or (because of the method of data acquisition) non-simultaneity of photometric observations.
In this contribution, we discuss the period distributions for a sample of 500 stars drawn from the Orion region (1 Myr) for stars with and without circumstellar disks as diagnosed by [3.6 ] [8 ] colors (hereafter denoted ). To anticipate our conclusions, we find that only a small fraction of rapidly rotating stars exhibit robust disk signatures, while the fraction of disks surrounding slowly rotating stars is much greater (with a high degree of statistical significance). We find in these Spitzer data the clearest indication to date that stars with longer periods are more likely than those with short periods to have IR excesses suggestive of disks.
2 Data
2.1 Sources of data
Megeath et al. (2006, in prep) surveyed the Orion Molecular Clouds (1 Myr) with the IRAC instrument (3.6, 4.5, 5.8, & 8 ; Fazio et al. 2004) as part of a larger joint IRAC and MIPS GTO investigation. The complete IRAC survey covers 6.8 square degrees (4.4 square degrees in Orion A and 2.4 square degrees in Orion B), including the region near the Trapezium (see Figure 1) but also continuing along the molecular cloud to the southeast. The “traditional” Orion Nebula Cluster (ONC, 0.5 Myr) is a region (see Fig. 1), including stars with periods found by Herbst et al. (2000, 2002), Stassun et al. (1999), and Carpenter et al. (2001). The Flanking Fields (FF; 1 Myr; Rebull 2001 and Rebull et al. 2000) are four fields to the N, S, E, and W of the ONC, each of which is 0.75 on a side (see Fig. 1). Stars in the FF are slightly older than those in the ONC (Ramirez et al. 2004). Periods for stars here come from Rebull (2001), Stassun et al. (1999) and Carpenter et al. (2001). The IRAC survey follows the molecular cloud, even through the ONC and FF region, so it includes most of Field 2, to the North of the ONC, and all of Field 4, to the South of the ONC. Less than a third of fields 1 and 3 are included in the IRAC survey.
See Megeath et al. (2006, in prep) for more extensive details on data acquisition and reduction for the Orion data. In summary, toward each region, four 12-second high-dynamic-range (HDR) frames were obtained. The individual basic calibrated data (BCD) frames (Ver. S11) were mosaicked together using the MOPEX software. The sources were identified with a custom source finder written in IDL and then measured with the IDLPHOT package. An aperture of 2.4 and a sky radius of 2.4 to 7.2 were used. The adopted zero points in units of DN/sec/pixel are 19.66, 18.94, 16.88 and 17.39 for a 10 pixel aperture radius in IRAC channels 1 through 4 respectively. Aperture corrections of 1.213,1.234,1.379 and 1.584 were applied to the data. Table 1 contains IRAC fluxes for those stars with periods detected in both IRAC-1 and IRAC-4 (see below).
2.2 Rotation rates and disk indicators
For stars in the region covered by IRAC observations, there are 854 stars with known periods. The catalog of stars with periods were merged with a catalog of IRAC sources identified by an automated source finder developed for this program (Megeath et al. 2006). In IRAC-1 (3.6 ), 90% of those stars are detected, 96% are detected in IRAC-2 (4.5 ), 81% are detected in IRAC-3 (5.8 ), and 59% are detected in IRAC-4 (8 ). (We note for completeness that the MIPS 24 counterpart to this GTO survey retrieves only 13% of the stars with known periods; for this reason, the MIPS data are not discussed here.) Because the measurement of periods necessarily implies optical (or NIR) detection of the stellar photosphere, by examining only stars with measured periods, we have already effectively selected just the less-embedded stars that are brighter in IRAC wavelengths. The entire IRAC survey completeness limit in this region ranges from 3 to 7 magnitudes deeper than that of the periodic sample, so without reference to backgrounds, all stars with periods should be detectable in the IRAC survey. However, in reality the nebular background and source confusion increases closer to the Trapezium. The majority of periodic stars are detected, but those periodic stars missing IRAC detections come from the region closest to the Trapezium, making the detection and identification of even some bright sources less reliable. The nebular background increases with wavelength, so a larger fraction of stars are missing 8 detections than 3.6 detections. Since the ONC is slightly younger than the surrounding regions (Ramirez et al. 2004), this effectively means that the sample of stars with periods and detections at the longer wavelengths will be slightly skewed to older stars.
Color-color plots like those appearing in Megeath et al. (2006, in prep) for this sample show clear populations of disk candidates and non-disk candidates; see, e.g., Allen et al. (2004) for more discussion on interpretation of IRAC colors. We considered several different possible disk indicators to use here, but the separation between the disk candidates and non-disked candidates was most apparent when using a larger difference in wavelength. Despite having fewer stars to consider when using the 8 detections, the conclusions of this analysis do not change significantly when other disk indicators are considered. Therefore, we will use measurements to identify disks, where we have set (based on histograms of excesses; see below) the boundary between disk and non-disk candidates at =1 magnitude. Requiring both 3.6 and 8 detections reduces the 854 available periods down to 464 stars, where the stars are preferentially lost from the core of the ONC (where the nebular emission and source confusion are both high). These 464 stars appear in Table 1. None of our conclusions change significantly when considering other disk indicators involving at least one IRAC band (such as the longer lever arm accorded by , or the additional stars provided by ).
In the past, it has been assumed that the distribution of measured periods is representative of the larger distribution of rotation rates. Samples of stars with and without measured periods have similar distributions (e.g., Rhode et al. 2001). However, recently, the sample of stars with measured periods has been shown to be significantly brighter in X-rays than the sample of stars without measured periods (e.g., Rebull et al. 2006 in press), suggesting that there may be real differences in the two samples. We looked for any difference in IRAC properties between those stars with measured periods and those stars without measured periods. In order to assemble a fair comparison, we only considered objects (either with measured periods or without) also detected in (values taken from the literature) and those located in a clear “locus” above the zero-age main sequence (ZAMS) in the / color-magnitude diagram (see Rebull et al. 2000 for much more discussion, including CMDs).
Figure 2 shows normalized histograms of the colors for stars with measured periods and those otherwise similar stars that are likely cluster members but without measured periods. There is a clear separation of the disk candidates above =1 and the non-disk candidates below that level. This demonstrates vividly the advantage of using MIR disk indicators; this effect is not found so prominently using other (e.g., NIR) disk indicators, which indeed has complicated earlier searches for disks. We note that the separation of the disk candidates at =1 is slightly clearer for the stars with periods than the stars without measured periods; we suspect that this is because the sample of stars without measured periods are more likely to have non-cluster member interlopers. We have normalized the histograms in the Figure because of the vastly different numbers of stars (1014 without periods and 387 with periods). A Kolmogorov-Smirnoff (K-S) test on these (un-normalized) distributions reveal that they are statistically indistinguishable, and we conclude that the IRAC disk properties of the stars with and without measured periods are statistically indistinguishable.
3 Correlation with Rotation
Figure 3 plots vs. period for all stars throughout the Orion region. There is still a clear separation of the disk candidates above =1 and the non-disk candidates below that level. By examining the cumulative distribution function of all colors, we find an inflection in the curve near =1, verifying what we see by eye in the distribution of colors in Fig. 3 (or Fig. 2).
It is similarly already apparent that the distribution of is different for shorter than it is for longer periods. By examining the cumulative distribution function of periods for all stars with , there is an inflection point near 1.8 d (log 0.25). Figure 4 shows the histograms of , distinguishing 1.8 d (log 0.25), and 1.8 d. Clearly, a long-period star is more likely to have a disk than a short-period star, but there are also substantial numbers of long-period stars with little or no excess. These latter stars may have just recently cleared their disks and have not yet spun up in response to contraction on their way to the ZAMS.
Figure 5 shows the cumulative distributions of [3.6][8] for the samples with and 1.8 d portrayed in Fig. 3. (The inflection point mentioned above near is readily apparent.) A K-S test on these distributions reveal that they are statistically substantially different (1 chance in that they are drawn from the same population). The distributions of for samples with [3.6][8] and 1 are also statistically different.
There are 11 fast-rotating stars that appear to have disks. Of these 11 stars, one (JW 783) is a likely double in the IRAC images, and one (Par 2097) falls in a particularly bright region of the nebula (and therefore is likely to have more inaccurate 8 fluxes than typical). The remaining 9 stars probably have reasonable measurements at 3.6 and 8 , despite many of them having some nebular background at 8 . Perhaps these fast rotating stars with disks have just recently experienced an accretion event, or they are descendents of EX Ori-type stars. These 9 stars are good targets for followup studies, and they are Par 1409, Par 1799, Par 1938, Par 2123, JW 104, JW 879 (a likely non-member based on proper motions), numbers 1053 and 3115 from Hillenbrand (1997), and number 864 from Rebull (2001).
We expected that there might be differences in this relation between and IR excess as a function of location within the cluster (ONC vs. FF). There are differences between the ONC and the FF, but the differences are all in the relative disk fractions. The disk fraction is much higher in the ONC, and although this could be a result of the fact that the ONC is slightly younger than the FF (Ramirez et al. 2004), this is likely also a result of the bias against faint 8 detections of stars without bright infrared excesses in the ONC imposed by the weaker photospheric emission and substantially higher background seen at longer wavelengths. As a function of physical location, there is no distinguishable difference of the clear separation of disk candidates from non-disk candidates, or of the tendency for fast rotators to lack disks.
We expected that there might be an effect of mass or age. We derived masses and ages via placement in the color-magnitude diagram and via D’Antona and Mazzitelli (1994,1998; DAM) models, as in Rebull (2001), with conversion from the theoretical to the observational plane using transformations found in Hillenbrand (1997). (We note that of course masses derived in this fashion are model-dependent. We could have investigated mass effects via the use of spectral types, but types only exist for 50% of our sample. In lieu of cutting the sample down by half, we have opted instead to proceed using masses so derived.) Previous investigators (e.g., Herbst et al. 2002) report different period distributions for stars above and below a mass division of 0.25 M☉, also using DAM models. Therefore, we also investigated separating the sample at this boundary, corresponding roughly to a spectral type of M2.5-M3, or a mass of 0.35 M☉ using Siess et al. (2000) models (the Z=0.02 model with no overshooting, using conversions from Kenyon & Hartmann 1995), or roughly 0.5 M☉ using Baraffe et al. (1998) models (Z=0, He mass fraction=0.275, mixing length=1.0, conversions as presented therein).
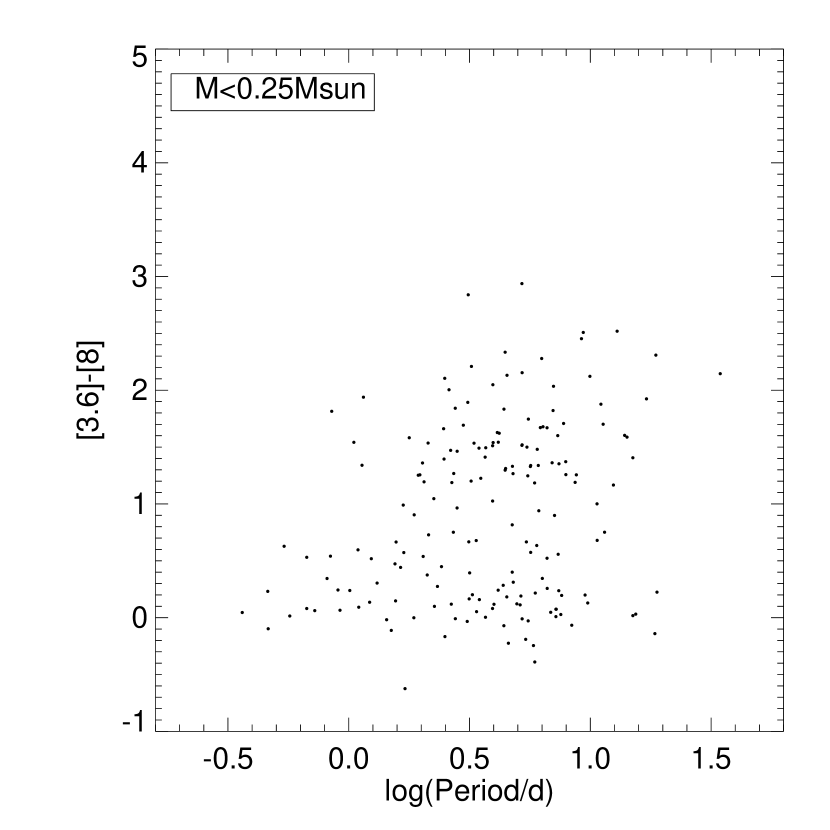
As seen in Figure 6, stars with 0.25 M☉ have a higher disk fraction, and the separation between the disk and non-disk candidates, while still readily apparent, is less sharp; e.g., there are fractionally more lower-mass stars with values near 1. There is more scatter in the lower-mass stars; the errors in periods are comparably small for all masses, but the errors in IRAC color are likely to be greater for the fainter stars. The fastest rotators still tend to lack disks. A two-dimensional K-S test indicates that there is 1 chance in that these distributions were drawn from the same population. There is a well-defined clump of higher-mass stars with IR excesses between log 0.6 and 1, which does not appear with such clarity in the lower-mass stars. The mean period for the distribution of stars with disks is identical within the scatter for both mass ranges (log =0.80.3 for the more massive stars and 0.70.3 for the less massive). The modal (or most likely) period of these distributions of stars with disks are slightly different; for the more massive stars, the mode of the distribution is log =0.9 (with 33% of the sample having log =0.90.05) and 0.6 for the less massive stars (this distribution is broader, so although the most frequent value is 0.6, only 15% of the sample has log =0.60.05).
The higher mass “clump” suggests consistency with Taurus (Edwards et al. 1993) in the sense that the Taurus sample was dominated by K7-M0 stars, as is the left side of Fig. 6. We can speculate on many possible explanations for this. It may be that disk locking is more efficient in the more massive stars, or that the parameters (, ) relevant for disk locking found in these systems are more similar across stars in this mass range, such that the locking occurs at similar radii and periods for a larger fraction of the sample in the higher mass stars.
As a function of age within this sample, there is no distinguishable difference in the clear separation of disk candidates from non-disk candidates, or in the tendency for fast rotators to lack disks. Since younger stars may have a higher disk fraction, there is the expectation that there may also be some subtle second-order effects from these influences, but it is still true, regardless of the subsample, that faster rotators are less likely to have disks.
Similar results can be derived from the independently obtained distributions of in this region; see Figure 7. The relation is not nearly as clear here, due primarily to the fundamental resolution limits imposed by spectroscopy at both the fast-rotating (due to smearing out of the absorption lines in these late-type stars) and slow-rotating (instrumental resolution is usually 10-12 km s-1) ends of the distribution. Nonetheless, stars that are more rapidly rotating are still less likely to have disks. The fact that this effect is also seen in the independent sample is powerful confirmation; of the 296 stars with measured and IRAC fluxes, only 154 of them also have measured periods.
4 Discussion & Conclusions
Basic conservation of angular momentum during the star formation process requires that the angular momentum of the central object must be regulated. Recent empirical studies (Rebull et al. 2004, Herbst et al. 2005) have found that young low-mass PMS objects must be draining angular momentum into their surroundings, but it has not been clear, until now, that the disks were the culprit.
The sample discussed here provides two significant advantages above and beyond previous studies: (1) the disk indicator we use here is robust against many of the problems plaguing shorter-wavelength disk indicators, and (2) the sample size is large, nearly 500 stars. We have finally resolved two of the most important issues complicating earlier similar investigations. We find a clear correlation between rotation rate and circumstellar disks.
Among the slower rotators (stars with periods 1.8d), the period distributions for stars with and without disks ([3.6][8] and 1) are statistically indistinguishable. Edwards et al. (1993) made a similar observation (with many fewer objects) in their early discussion of disk-locking, and speculated that the long-period non-disked objects have been released recently (within a few hundred thousand years). If this speculation is correct, then examination of the period distributions among older star-forming regions should reveal a significant separation in the period distributions betwen disked and non-disked stars. The evolutionary timescales here may be important, as suggested by Hartmann (2002); the timescales for angular momentum loss may be comparable to the evolutionary and/or disk clearing timescales. Especially if these stars have recently cleared their disks, it is possible that they are still behaving as disk-locked; we could have disk braking without disk locking. If this is the case, then the timescales for disk clearing are indeed comparable to the evolutionary timescales here. Another possible explanation, as Long et al. (2005) have suggested, is that combinations of parameters (, ) could result in disk locking at different rotation rates for otherwise similar stars. Finally, it could be important to consider if these stars undergo intermittent periods of spinup and/or rapid accretion (e.g., Lovelace et al. 1995, Li 1996, Kuker et al. 2003, Long et al. 2005, Matt & Pudritz 2005b), not just in terms of whether we have caught some stars in the act of spinning up, but also specifically the implications for disk luminosity in the IRAC bands during periods of high accretion rate.
Given the observed correlation, disks are the most obvious solution, but it is possible that there are other explanations. If the rapid rotators are more likely to be in close binary systems, then this correlation could be explicable in terms of disk dissipation by the companion and/or source confusion in determining the IRAC colors. Followup high-resolution spectroscopy of the fast rotators looking for indications of binarity will be required to resolve this issue.
The remaining issues to pursue in similar investigations include sampling (a) a broader range of environmental settings, e.g., regions further from (or lacking entirely) O and B stars, and (b) a broader range of ages. If the characteristics (e.g., ionization fraction, , lifetime) of the disks around young stars are intimately tied to the net time spent near O and B stars, the distribution found in Orion may be significantly different from those found in other clusters lacking high-mass stars. If the observations here in Orion are representative of the characteristics of other young low-mass systems, we expect that the difference in period distributions of stars with and without MIR excesses will increase with time, as suggested by the Monte Carlo models discussed in Rebull et al. (2004). In older clusters, there should be a lower fraction of slowly rotating stars lacking disks, since those stars that may be “just released” here should have spun up in older clusters. In order to constrain the timescale for disk locking (and understand whether or not there is an effect with cluster age) by comparing Orion to other clusters, ideally, we want to minimize errors by comparing IRAC excess distributions in other clusters, not those of other disk indicators. Additional clusters with substantial numbers of measured periods and Spitzer observations are NGC 2264 (3 Myr), IC 348 (3 Myr) and Taurus-Auriga (1 Myr).
References
- allen (04) Allen, L., et al.2004, ApJS, 154, 363
- (2) Baraffe, I., et al.1998, A&A, 337, 403
- (3) Carpenter, J. M., Hillenbrand, L. A., & Skrutskie, M., F. 2001, AJ, 121, 3160
- D’Antona & Mazzitelli (1994) D’Antona, F., & Mazzitelli, I. 1994, ApJS, 90, 467 (DAM)
- D’Antona & Mazzitelli (1998) D’Antona, F., & Mazzitelli, I. 1998, http://www.mporzio.astro.it/dantona/prems.html (DAM)
- Fazio (04) Fazio, G., et al., 2004, ApJS, 154, 10
- hartmann (02) Hartmann, L., 2002, ApJL, 566, 29
- (8) Herbst, W., Rhode, K. L., Hillenbrand, L. A., & Curran, G. 2000, AJ, 119, 261
- herbst (02) Herbst, W., et al. 2002, A&A, 396, 513
- x (048) Herbst, W., Bailer-Jones, C. A. L., & Mundt, R. 2001, ApJ, 554, 197
- (11) Herbig G. H., & Bell K. R., 1988, Lick Observatory Bull. No. 1111
- Hillenbrand (97) Hillenbrand, L., 1997, AJ, 113, 1733
- Hillenbrand (98) Hillenbrand, L., 1998, AJ, 116, 1816
- (14) Jones, B. F., & Walker, M. F., 1988, AJ, 95, 1755
- KenyonHartmann (1995) Kenyon, S., & Hartmann, L., 1995, ApJS, 101, 117
- Konigl (1991) Königl, A. 1991, ApJ, 370, 39
- Königl (2000) Königl, A. & Pudritz, R. 2000, in Protostars and Planets IV, ed. V. Mannings, A. P. Boss & S. S. Russell (Tucson: University of Arizona Press), 759
- Edwards (1993) Edwards, S., et al. 1993, AJ, 106, 372
- (19) Kuker, M., et al. 2003, ApJ, 589, 397
- (20) Li, J., 1996, ApJ, 456, 696
- (21) Long, M., et al. 2005, ApJ, 634, 1214
- (22) Lovelace, R., et al. 1995, MNRAS, 275, 244
- Matt (05) Matt, S., & Pudritz, R., 2005, ApJL, 632, 135
- (24) Matt, S., & Pudritz, R., 2005, MNRAS, 356, 167
- Megeathetal (2005) Megeath, T., et al., 2006, in prep
- (26) Parenago, P. P., 1954, Trudy Sternberg Astron. Inst., 25, 1
- Ramirezetal (2004b) Ramirez, S., Rebull, L., Stauffer, J., Strom, S., Hillenbrand, L., Hearty, T., Kopan, E., Pravdo, S., Makidon, R., Jones, B., 2004, AJ, 128, 787
- Rebull et al. (2000) Rebull, L., Hillenbrand, L. A., Strom, S. E., Duncan, D. K., Patten, B. M., Pavlovsky, C. M., Makidon, R. B., & Adams, M. T. 2000, AJ, 119, 3026
- Rebull et al. (2001) Rebull, L., et al., 2001, AJ, 121, 1676
- Rebull et al. (2002b) Rebull, L., Wolff, S., Strom, S, & Makidon, R. B. 2002b, AJ, 124, 546
- Rebull et al. (2004) Rebull, L., Wolff, S., & Strom, S. E., 2004, AJ, 127, 1029
- Rhode etal (2001) Rhode, K., Herbst, W., & Mathieu, R. 2001, AJ, 122, 3258
- Siess et al. (2000) Siess, L., Dufour, E., & Forestini, M. 2000, A&A, 358, 593, and http://www-laog.obs.ujf-grenoble.fr/activites/starevol/evol.html (SDF)
- (34) Sills, A., Pinsonneault, M., Terndrup, D., 2000, ApJ, 534, 335
- Shu (2000) Shu, F., Najita, J., Shang, H., & Li, Z.-Y. 2000, in Protostars and Planets IV, ed. V. Mannings, A. P. Boss & S. S. Russell (Tucson: University of Arizona Press), p. 789
- (36) Stassun, K. G., Mathieu, R. D., Mazeh, T., & Vrba, F. J. 1999, AJ, 117, 2941
- Werner (04) Werner, M., et al., 2004, ApJS, 154, 1


| starbbR01 numbers come from Rebull (2001), HBC numbers from Herbig & Bell (1988), Par numbers from Parenago (1954), CHS numbers from Carpenter et al. (2001), H97 numbers from Hillenbrand (1997), HBJM numbers from Herbst et al. (2001), and JW numbers come from Jones & Walker (1988). | position (J2000) | [3.6] | error | [4.5] | error | [5.8] | error | [8.0] | error | Period (d) |
|---|---|---|---|---|---|---|---|---|---|---|
| R01- 678 | 05 33 36.9 -05 23 06.2 | 11.52 | 0.006 | 11.52 | 0.008 | 11.47 | 0.027 | 11.44 | 0.119 | 7.23 |