A 62 Day X-Ray Periodicity and an X-Ray Flare from the Ultraluminous X-Ray Source in M82
Abstract
In 240 days of X-ray monitoring of M82, we have discovered an X-ray periodicity at days with a peak to peak amplitude corresponding to an isotropic luminosity of in M82 and an X-ray flare reaching a peak luminosity of . The periodicity and flare likely originate from the ultraluminous X-ray source (ULX) in M82 which has been identified as a possible intermediate mass black hole. We suggest that the 62 day modulation is due to orbital motion within an X-ray binary with a Roche-lobe overflowing companion star which would imply that the average density of the companion star is near and is therefore a giant or supergiant. Chandra observations just after the flare show an energy spectrum that is consistent with a power-law with no evidence of a thermal component or line emission. Radio observations made with the VLA during the flare allow us to rule out a blazar identification for the source and place strong constraints on relativistically beamed models of the X-ray emission. The Chandra observations reveal a second X-ray source reached a flux of in the 0.3-7 keV band which is dramatically higher than any flux previously seen from this source and corresponds to an isotropic luminosity of . This source is a second ultraluminous X-ray source in M82 and may give rise to the QPOs detected from the central region of M82.
1 Introduction
The bright X-ray sources in external galaxies, known as ultraluminous X-ray sources (ULXs), are of considerable current interest because they may be ‘intermediate-mass’ black holes (Colbert & Mushotzky, 1999; Makishima et al., 2000; Kaaret et al., 2001). One of the most extreme ULXs is located in the nearby starburst galaxy M82 (Ptak & Griffiths, 1999). Chandra observations showed that the brightest source in the galaxy, CXOU J095550.2+694047 = X41.4+60 (Kaaret et al., 2001; Matsumoto et al., 2001), is offset from the nucleus, not coincident with any radio supernova remnant, and highly variable on time scales of weeks. The offset of the source from the dynamical center of the galaxy places an upper bound on its mass of , depending on its age, due to dynamical friction (Kaaret et al., 2001). These observations rule out a low luminosity AGN or a very luminous supernova or hypernova remnant as the source of the X-ray emission. If the radiation from X41.4+60 is isotropic and from an accreting object, then the mass of the accretor must be in excess of . Combined with the mass upper bound, this would place the object firmly in the “intermediate-mass” black hole category.
However, alternative explanations must be considered, particularly that the ULXs radiate at super-Eddington luminosities Begelman (2002) or that the radiation is beamed, so the true luminosity is significantly less than calculated assuming isotropic emission. King et al. (2001) have suggested that ULXs are high-mass X-ray binaries in a short-lived phase which occurs early in the life of almost every system and during which mass is transferred from the companion to the compact object on the thermal time scale of the companion – leading to super-Eddington accretion rates. The X-ray emission in this phase is mechanically beamed, producing high observed X-ray fluxes for observers near the beaming axis. However, the flux of X41.4+60 is so high that producing it via mechanical beaming of a stellar-mass black hole is problematic. King et al. (2001) specifically point to X41.4+60 as an example of a system where their model may not apply.
Mirabel & Rodriguez (1999) pointed out that radio microquasars with their axes aimed at us (“microblazars”) should occur in nearby galaxies. Körding et al. (2002) have suggested that the ULXs may be stellar-mass black holes in which a relativistic jet produces most of the observed X-ray flux. Jets aligned nearly along our line of sight could then produce high apparent X-ray fluxes via relativistic beaming. If the ULXs are microblazars, then they should be radio sources and the X-ray and radio emission of the ULXs should be well correlated and highly variable on time scales as short as days. Kaaret et al. (2001) noted that an unusual radio transient, 41.5+59.7 (Kronberg & Wilkinson, 1985), lies within the error box for X41.4+60. This transient was detected in February 1981 at a 5 GHz flux of 7 mJy and not detected with an upper limit of 1.5 mJy in October 1983. The sharp decrease in flux indicates that it is not a supernova remnant. Transient radio emission from an accreting compact object would suggest the presence of a jet of relativistic particles (Kaaret et al., 2003).
Recently, Strohmayer & Mushotzky (2003) found quasiperiodic oscillations (QPOs) in the range 50–110 mHz which they identify as arising from X41.4+60. If the QPO frequency is limited by the orbital frequency around a non-rotating black hole, then it would imply a mass limit of . The QPOs were discovered in XMM-Newton data and confirmed in RXTE data. The QPOs are only occasionally detected in the RXTE data and there is no apparent correlation between QPO detections and the source flux level. Based on a comparison with the spectral and timing properties of stellar-mass black hole X-ray binaries, Fiorito & Titarchuk (2004) estimate a mass of the order of 1000 for the compact object producing the QPOs. The QPOs were confirmed in a longer XMM-Newton observation, but found at a somewhat higher frequency of 113 mHz (Mucciarelli et al., 2006; Dewangan, Titarchuk, & Griffiths, 2006).
The position of X41.4+60 is within of the position of the infrared source and super star cluster MGG 11 (Kaaret et al., 2004; Portegies Zwart et al., 2004a). Simulations of the dynamical evolution of the cluster MGG 11 show that stellar collisions in its extremely dense core may have led to numerous stellar collisions and the formation of an intermediate mass black hole (Portegies Zwart et al., 2004a).
In order to obtain more information about X41.4+60, we monitored M82 for 240 days using the Proportional Counter Array (PCA) on the Rossi X-Ray Timing Explorer (RXTE) with observations obtained typically every 2 days. The PCA is not an imaging instrument, but is adequate to measure the X-ray flux and rapid variability of the integrated output of the entire galaxy. We discovered an X-ray periodicity from M82 at days which we have previously reported (Kaaret, Simet, & Lang, 2006). Additional details of the analysis are presented here. We also found a transient event where the X-ray flux of the galaxy increased by a factor of three over the quiescent level over a period of a few days. After the onset of this remarkable X-ray flare, we obtained imaging X-ray observations with the Chandra X-Ray Observatory and radio observations with the Very Large Array (VLA). We describe X-ray observations with RXTE and Chandra in § 2, the VLA data in § 3, and discuss the results in § 4.
2 RXTE observations
We obtained a total of 141 observations of M82 with a total effective exposure of 281.2 ks using the Proportional Counter Array (PCA) on the Rossi X-Ray Timing Explorer (RXTE) under program 90121 (PI Kaaret). Two of the observations were made early to test our procedures for the acquisition and analysis of realtime data. The bulk of the observations consisted of monitoring the galaxy typically every second day during the period over which the VLA was in the A, BnA, or B configuration during 2004 and 2005 and covered dates from MJD 53252 to 53490.
To enable target of opportunity observations with Chandra and the VLA, we analyzed the real time data from RXTE soon after the data became available on the RXTE ftp site. The analysis was carried out with the FTOOLS package (version 5.3.1) which is part of the HEAsoft software. After the data were retrieved, they were filtered to select good time intervals such that Proportional Counter Unit (PCU) 2 was on, the source was more than ten degrees above the horizon, the pointing offset from the source was less than , the satellite was out of the South Atlantic Anomaly (SAA), and the electron contamination was less than 0.1. A background file was made for the same interval as the observation with the model pca_bkgd_cmfaintl7_eMv20031123.mdl and the newest predicted SAA passage file downloaded at the same time as the data. The FTOOL saextrct was used to make both light curves and spectra for the observation and the background, using only data from PCU 2. The spectra were fitted with a power-law model using the spectral fitting program XSPEC, which is part of HEAsoft, to obtain a measurement of the flux in the 2–10 keV band. Our flux monitoring led to the detection of an X-ray flare reaching a flux of in the 2–10 keV band on 26 Jan 2005 (MJD 53396.4). On the basis of this flare detection, we triggered target of opportunity observations with Chandra and the VLA.

After the observing program was completed, we re-examined all of the observations using the RXTE production data. This had the advantages that some data gaps in the real-time data were filled and, more importantly, that the SAA passage history, rather than the SAA passage predictions, could be used in estimating the PCA background. To produce an energy spectrum for each observation, we used the Rex script 111http://heasarc.gsfc.nasa.gov/docs/xte/recipes/rex.html. We produced spectra using only the top layer in PCU 2, including channels 2-44 which cover the energy range 2-20 keV. Response matrices were made for each observation. The expected background was estimated using the same model mentioned above and a systematic uncertainty was included in the background estimate 222http://lheawww.gsfc.nasa.gov/users/craigm/pca-bkg/bkg-users.html. The spectrum was fitted using XSPEC with a power-law model with interstellar absorption with the column density fixed to . The flux was calculated for the 2-10 keV range.
Fig. 1 shows the flux in the 2-10 keV band versus time. The X-ray flare is obvious as the high flux points around MJD 53400. The peak flux occurred on MJD 53400.2 and reached a level of in the 2–10 keV band. The duration of the flare is rather short, only a few days. This is in contrast to the light curve of M82 presented by Rephaeli & Gruber (2002), where the duration of the high flux interval is at least 100 days. The photon index is generally between 2.2 and 2.5 and shows no strong correlation with flux.

The light curve shows an apparent modulation with an amplitude of and a period near 60 days. We calculated a periodogram, shown in Fig. 2, according to the method of Horne & Baliunas (1986) with the power normalized by the total variance of the data. For the periodogram, we used our entire RXTE data set. There is a peak at a period 62.0 days with a power of 27.9. The probability of chance occurrence calculated assuming a Poisson distribution, or white noise background, and taking into account the number of trials is , corresponding to a detection. We estimate the 90% confidence error on the period to be 2.5 days. There is a secondary peak at 125.7 days with a power of 15.3. Removing the two early observations does not significantly affect the periodogram. The peak is then at days with a power of 27.5. Removing the observations during the X-ray flare near MJD 53400 does not shift the peak, but increases its power. With the points with fluxes above removed, the peak is at days with a power of 32.8. Removal of the two early points and the high flux points leads to a peak is at days with a power of 32.8.
Accreting compact objects often exhibit red noise, or increasing timing noise at decreasing frequency with a power-law dependence of power on frequency. Red noise can produce apparent periodicities at periods comparable to the observation duration (Israel & Stella, 1996). We tested the significance of the observed signal using a red noise background. First, we fit a power-law to the power versus frequency relation for periods shorter than 40 days (Vaughan, 2005). We found a spectral index of -0.78. We then generated red noise with this spectral index and with a mean and variance equal to the mean and variance of the actual data. This procedure is conservative because it includes the variance due to the signal itself and also due to the X-ray flare. We generated simulated light curves using the rndpwrlc routine of the aitlib IDL subroutine library333available at http://astro.uni-tuebingen.de/software/aitlib provided by the Institut für Astronomie und Astrophysik of the Universität Tübingen. For each light curve, we generated 2048 data points with uniform spacing equal to one third of the average spacing of the main 139 observations of our monitoring program and used only 141 points from the middle of the simulated data with relative times matching the actual observations. Generating a simulated light curve longer than the portion used helps eliminate the effects of red noise leakage. The simulated data were processed with the same procedures used to analyze the real data. We generated 100,000 trial light curves and searched for cases where the power at a period of 80 days or less, corresponding to three oscillation cycles in the main portion of the monitoring, was greater than or equal to the observed value of 27.9. We found only 2 cases, equivalent to a probability of chance occurrence of our observed signal of .
The Q value of the peak, the period of the peak divided by the full width at half maximum power, in the periodogram is 4.5, which is fully consistent with that expected for a periodic process given the observation duration, but is only weakly constraining. To attempt to determine whether or not the signal is strictly periodic, we measured the arrival times of the peak maxima. We fit the data near each peak, 20 days, with a second order polynomial. We excluded the very high flux points with fluxes above . Comparing the peak times to an assumed 62 day period, we find that the measured arrival times of first, second, and fourth peaks are consistent with the predicted arrival time for periodic signal within 2 days. The third peak differs by 4 days. However, the polynomial fit is affected by two high flux points in the decaying part of that peak (at MJD 53408.2 and 53412.7). If we fit the data within 11 days of that peak, we find that the peak arrival time agrees within 1 day of the time predicted for a periodic signal. We note that we had observations only every second day and there are variations in the flux from other sources in M82 which are not related to the 62 day periodicity and which lead to uncertainty in the time of arrival determination. To estimate the uncertainty in the polynomial fits, we varied the width of the data windows and the placement of the data windows, i.e. offsets the windows with respect to the peak. We conclude that the peak arrival times are accurate to about 2 days. Therefore, the arrival times of the peaks are consistent with being periodic at an interval of 62.0 days. However, additional observations are essential to test the periodic nature of the signal.
There is archival RXTE data from a previous set of observations of M82 made in 1997. However, the time coverage of that data set is uneven and generally less dense than in our monitoring program. There is a hint of one peak in the 1997 light curve around MJD 50585 which has a shape similar to the four seen in our data. However, the 1997 data alone is insufficient to confirm or deny the periodicity. If we make a periodogram combining the two data sets, we find a peak at 61.5 days.

To examine the rapid variability of the source, 152 event files were examined individually according to the following procedure using a program written in the Interactive Data Language (IDL). Events in the 2-10 keV energy band were selected and split into segments of 256 s. An FFT with a time resolution of s was calculated for each segment. The FFTs were added incoherently. The resulting total power spectrum was logarithmically rebinned with the bin width adjusted on a case by case basis. The IDL routine lmfit was then used to fit a model consisting of an exponential background and, if necessary, a Lorentzian peak to model a QPO.
Of 152 event files, 10 contained QPOs with a single trial significance of or greater. The power spectra from observations with QPO detections are plotted in Fig. 3. The centroid frequencies of the QPOs range from 80 to 190 mHz. The maximum modulated flux in the QPO is in the 2–10 keV band.
2.1 Chandra observations
After detection of the large X-ray flare in the PCA monitoring, a Chandra Target of Opportunity Observation was triggered. The request was sent to the Chandra X-ray Center on 26 Jan 2005 and the observation (ObsID 6097; PI Kaaret) began on 4 Feb 2005 at 23:34:40 UT (MJD 53405.982). The observation was made using the Advanced CCD Imaging Spectrometer spectroscopy array (ACIS-S; Bautz et al. 1998) and the High Resolution Mirror Assembly (HRMA). We obtained 52,773 s of useful exposure. The ACIS-S was used in imaging mode. The high flux anticipated from the source would have caused severe pile-up if the source were placed on-axis and the standard observing mode were used. To reduce the effect of pile-up, the target was offset along the Y-detector coordinate. This placed the target off axis where the point spread function broadens and the X-ray flux is spread over multiple pixels in the CCD detector which reduces pile-up. In addition, we operated only the S3 chip and employed a 1/8 sub-array mode to reduce the frame time to 0.441 s and further reduce the pile-up. To check if pile-up was significant in the data acquired, we calculated the count rate in the pixel cell at the peak of the brightest source in the image. The rate was 0.18 counts/frame, giving a pile-up fraction of 3.2% within this pixel cell. The counts in the peak pixel cell are 70% of the total source counts, so the overall pile-up fraction is 2.2%. Therefore, the effect of pile-up on the timing and power spectra is small.
The Chandra data were subjected to standard data processing and event screening (ASCDS version 7.5.0.1 using CALDB version 3.0.0). The total rate on the S3 chip was between 2.5–3.8 c/s for the entire observation and did not show any strong background flares. We constructed images for the 0.3–8 keV and 2–8 keV bands using all valid events and used the wavdetect tool in the CIAO version 3.1 Chandrda data analysis package to search for X-ray sources. We found that use of the higher energy band seemed to produce more reliable point source detections and that the diffuse emission had less influence on the calculated source positions. Therefore, we used the source positions found from the 2–8 keV data in the remainder of the analysis.
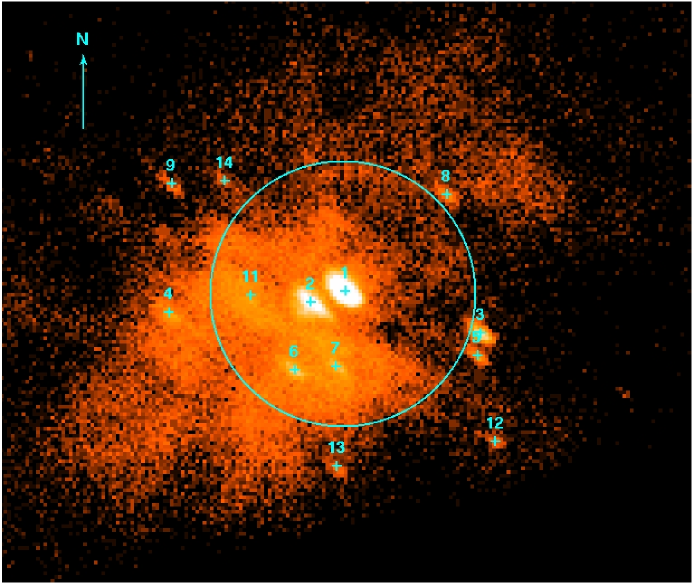
Fig. 4 shows the image in the 0.3–8 keV band. Sources with detection significance of or higher are marked. The point sources appear as ellipses due to the off-axis pointing of the observation. The circle in the figure represents the extraction region used by Strohmayer & Mushotzky (2003) in their analysis of the XMM-Newton data. Several bright X-ray sources fall in or near the extraction region and must have contributed to the energy and timing spectra attributed to X41.4+60.


The two brightest sources have fluxes which are an order of magnitude greater than any other source in the field. They are of particular interest and are the topic of the reminder of our Chandra analysis. The brightest source is CXOU J095550.2+694047, the known ULX in M82 which was discussed in the introduction. Following Kaaret et al. (2001), we will refer to this source as X41.4+60. The second source is located at of 09h 55m 51s.040 and +69 40 45.49 (J2000). This source is likely the same as CXOM82 095551.4+694045 in Matsumoto et al. (2001) and may be the same as CXOM82 095551.4+694043 in Griffiths et al. (2000). Following the convention of naming sources in M82 by their offset from 09h 55m 00s, +69 40 00 (B1950), we refer to this source as X42.3+59. We note that Strohmayer & Mushotzky (2003) refer to the brightest source in M82 as M82 X-1. They assumed that this source is the same as X41.4+60 and ascribed it to be the origin of the QPOs found in the XMM-Newton and RXTE data. However, as discussed further below, X42.3+59 lies within the extraction radius used by Strohmayer & Mushotzky (2003) to define the X-ray counts from M82 X-1. Therefore, their source M82 X-1 may include contributions from both X41.4+60 and X42.3+59.
We extracted photon lists and created light curves and energy spectra for both sources using standard CIAO tools. The light curves are shown in Fig. 5. The light curves represent the count rate in the 0.3–10 keV band. The upper curve is for the brighter source, X41.4+60. The source appears to vary gradually on time scales of several thousand seconds. The flux of X42.3+59 appears to have variations on faster times scales, but is relatively constant on long time scales.
Fig 6 shows the timing power spectra for both sources derived from counts in the 2–10 keV band. The plotted spectrum for each source is the sum of 16 individual power spectra with 8192 points each. The summed power spectrum was rebinned into logarithmically spaced bins before plotting. The sampling time was equal to the ACIS frame time of 0.441 s. In the power spectra plot, the curve for X41.4+60 is the lower one. The timing noise from X41.4+60 is consistent with Poisson fluctuations at frequencies from 0.001 Hz to 1 Hz. In contrast, X42.3+59 shows significant noise near 1 mHz and a possible QPO near 70 mHz. Taking into account the number of trials, i.e. the number of frequency bins in the power spectrum, the QPO at 70 mHz has a chance probability of occurrence of .

The energy spectrum for X41.4+60 is shown in Fig. 7. We fitted the spectrum using the Sherpa fitting package which is part of CIAO. The spectrum is adequately fitted by a power-law with interstellar absorption except for a region where there are significant residuals just above 2.1 keV. There is a strong feature in the instrument response at 2.1 keV corresponding to the Ir M edge. An analysis of grating data presented by Herman Marshall at the 2003 Chandra Calibration Workshop444http://cxc.harvard.edu/cal/Hrma/on_axis_effarea.html shows that a correction is needed in the HRMA response at energies just above the Ir-M edge. Since this correction may depend on the off-axis angle of the source and does not appear to be adequately modeled in the current response matrices, we have chosen to remove the data for energies from 2.1–2.7 keV in performing the fits.
For X41.4+60, we find that the energy spectrum is adequately fitted with a power-law with interstellar absorption giving /DoF = 72.8/66. The best fit parameters were a photon index of and an equivalent hydrogen absorption column density of . The source flux was in the 0.3–7 keV band and in the 2–10 keV band. We note that an absorbed multicolor disk blackbody model is strongly rejected with /DoF = 4.0. Addition of a multicolor disk blackbody to the power-law model does not significantly improve the fit. For disk temperatures greater than 0.5 keV, the normalization of the disk blackbody component is . However, due to the significant absorption at low energies, we cannot rule out the possible presence of a cool disk component with a temperature below 0.3 keV. Addition of an Fe-K emission line also does not improve the fit. Taking a gaussian line profile with a centroid of 6.55 keV and a width of 0.33 keV to match the line reported by Strohmayer & Mushotzky (2003), we place a 99% confidence level upper bound of 70 eV on the equivalent width of the line. This is below the equivalent widths found from the XMM-Newton data.
For X42.3+59, the source flux was in the 0.3–7 keV band and in the 2–10 keV band. A single power-law with interstellar absorption did not give an adequate fit. We found an adequate fit with the sum of two power-laws with independent interstellar absorption, with , , , , and /DoF = 156.0/162. We also found an adequate fit with the absorbed sum of a multicolor disk blackbody plus a power-law. The best fit parameters were , , disk inner temperature , disk normalization , and /DoF = 162.1/163. This disk normalization would imply a black hole mass in excess of .

3 VLA Observations
Four separate radio observations using the Very Large Array (VLA) of the National Radio Astronomy Observatory (NRAO)555The NRAO is a facility of the National Science Foundation operated under cooperative agreement by Associated Universities, Inc. were made of M82 after detection of X-ray flare. The first observation occurred on 29 Jan 2005 (MJD 53399) and the last on 5 Feb 2005 (MJD 53406). The radio observations began one day before the peak X-ray flux and continued to 6 days after. All observations were made at 8.5 GHz, with integration times ranging from 1 to 2.5 hours and the array was in its hybrid BnA configuration. J1331+305 was used as a flux calibrator, and J0958+655 was observed every 15 minutes to calibrate the interferometer phases. Standard procedures for calibration, editing and imaging were carried out using the Astronomy Image Processing Software (AIPS) of NRAO.
Images of M82 were produced for each observation day as well as a composite image produced from the combination of all data, shown in Fig. 8. In order to study the compact sources in M82 at 8.5 GHz, the extended emission larger than 4″ was filtered out by limiting the corresponding (u,v) data range to baselines longer than 50 k. The resulting resolutions of all images are subarcsecond (approximately ).
We detected a low signal-to-noise radio source in two of the four observations at a position which is from the position derived for X41.4+60 in our TOO observation, but only from the position quoted for X41.4+60 in Kaaret et al. (2001). Given the astrometric uncertainty of Chandra, we conclude that the source is a possible radio counterpart to X41.4+60. This radio source is unresolved in all observations and has a position of (J2000): 09 55 50.33, 69 40 46.3. The 8.5 GHz flux density of this source is mJy on 1 Feb 2005 and mJy on 3 Feb 2005. The source is not detected on 29 Jan 2005 with an upper limit of mJy and a marginal detection of mJy on 5 Feb 2005. Rodriguez-Rico et al. (2004) report the only other detection of a radio source at this position, 41.62+59.9 (J1950 coordinates name), with a flux density of mJy at 8.5 GHz. The source is from the radio transient reported by Kronberg & Wilkinson (1985).
Radio emission is also detected from a source which falls within the error radius of X42.3+59. This radio source, known as 42.21+59.0, has been detected previously by a number of radio studies of compact sources in M82. We measure the flux density of 42.21+59.0 to be mJy during the first three observations and mJy on 5 Feb 2005. Values for the 8.5 GHz flux density of this source range from 1.9 mJy (Huang et al., 1994) to 6.7 mJy (Rodriguez-Rico et al., 2004). The range of values is most likely due to the differing interferometric arrays used for observation (which are sensitive to different spatial scales of radio emission) and the different techniques used to account for the extended background emission surrounding the source. Based on its flat or slightly positive spectrum (between 5 and 15 GHz), extended size, the presence of OH and water masers and radio recombination line emission, 42.21+59.0 is believed to be a giant HII region containing as many as 94 O5-type stars (Allen & Kronberg, 1998; McDonald et al., 2002; Rodriguez-Rico et al., 2004).
4 Discussion
4.1 X-Ray Flare
The fluxes measured by RXTE for the observations before and after the Chandra observation are consistent with in the 2–10 keV band. The total flux in the entire Chandra image is in the 2–10 keV band, which is consistent within the errors on the flux estimate and the relative calibration uncertainty between RXTE and Chandra. Of the total Chandra flux in this band, 50% arises from X41.4+60 and 23% arises from X42.3+59. The peak flux measured by RXTE during the flare was on MJD 53400.2. Assuming that a flux of arises from the remainder of the galaxy, the flux of the point source producing the flare would be , equivalent to a isotropic luminosity of at a distance of 3.63 Mpc. This is consistent with the highest fluxes measured with Chandra from X41.4+60 (Kaaret et al., 2001). It appears likely that X41.4+60 produced the flare observed with RXTE.
The energy spectrum that we find for X41.4+60 is best described by a single absorbed power-law. We find no evidence for thermal emission from a disk or for Fe-K line emission. The spectrum, a featureless power-law with a relatively hard photon index, is reminiscent of the spectra of blazars, but the low level of radio emission, even during the X-ray flare, rules out a blazar identification for the source. Adopting the maximum flux that we observe for the radio source 41.62+59.9 as an upper limit on the radio flux of X41.4+60, we find that the X-ray to radio flux ratio is more than an order of magnitude larger than found for any known blazar (Landt et al., 2001). The absence of strong radio emission during the flare argues against it being a relativistically beamed jet source (Körding et al., 2002).
It has been suggested that ULXs may be mechanically beamed (King et al., 2001) or radiating at super-Eddington rates (Begelman, 2002). The flux from X41.4+60 in the 2-10 keV band at the peak of from flare corresponds to a luminosity of at a distance of 3.63 Mpc, equivalent to the Eddington limit for a 580 object. We note that this is the observed (absorbed) flux. Using the best fit spectral model from the Chandra observation, this 2-10 keV flux corresponds to an unabsorbed flux of in the 0.3-10 keV band for a luminosity of or in the 0.1-20 keV band for a luminosity of . The latter luminosities corresponds to the Eddington limits for 1060 and 1600 objects, respectively. Given that the masses of known stellar-mass black holes are all below 20 (McClintock & Remillard, 2003), this would require the inferred luminosity to exceed Eddington by a factor of least 30 and more likely 50-80. However, models of ‘funnel’ shaped disks, as required for mechanical beaming, indicate that the maximum flux enhancement is only a factor of (Misra & Sriaram, 2003). This falls far short of the enhancement needed to explain X41.4+60 as a standard black hole. The formation of photon bubbles in magnetized, radiation pressure dominated disks may also lead to super-Eddington luminosities. Originally, the potential to reach luminosities up to a factor of 100 in excess of Eddington were suggested (Begelman, 2002). However, the best currently available calculations indicate enhancement factors of a few (Ohsuga et al., 2005; Watarai et al., 2005) or less than 10 (Ruszkowski & Begelman, 2003).
The question of whether or not black holes can radiate at substantially super-Eddington luminosities can also be addressed by examination of Galactic X-Ray binaries and active galactic nuclei (AGN). Collin & Kawaguchi (2004) find that the bolometric luminosities of AGN saturate at a few times the Eddington luminosity. In a sample of 578 type 1 AGN, Warner et al. (2004) find that only the most extreme objects have Eddington ratios approaching 10. We note that errors in black hole mass measurement and the AGN distances may contribute to the highest Eddington ratios quoted. For Galactic X-ray binaries with measured black hole masses, the highest luminosities observed are only a few times Eddington (McClintock & Remillard, 2003). It seems that the maximum luminosities produced by accretion disks in nature exceed the Eddington limit generally by no more than a factor a few and in the most extreme objects by less than a factor of 10.
Given these considerations, it appears unlikely that X41.4+60 can be interpreted as a standard stellar-mass black hole. It’s extremely high luminosity and strong variability identify it as, perhaps, the best intermediate-mass black hole candidate amongst the ULXs.
4.2 X42.3+59
Our Chandra observation found X42.3+59 at the highest flux yet seen. The 0.3-10 keV flux corresponds to an isotropic luminosity of , a dramatic increase in brightness over what was seen in previous observations. The total 2-10 keV flux found from the central region of M82 during the XMM-Newton observation where Strohmayer & Mushotzky (2003) detected a QPO was . It is possible that X42.3+59 contributed one third of the total XMM-Newton flux and was the origin of the QPOs. The required modulation would be 30%, which is comparable to rms fractions measured for low frequency QPOs, in the range 0.6-2 Hz, from GRS 1915+105 (Morgan et al., 1997). We note that our Chandra timing power spectrum of X42.3+59 shows significant variability near 1 mHz and a possible QPO at 70 mHz, similar to that seen with XMM-Newton, while the timing noise from X41.4+60 is consistent with Poisson fluctuations in this frequency range. This may suggest that X42.3+59 and not X41.4+60 is the source of the QPOs detected with XMM-Newton and RXTE.
If the radiation is isotropic, then the minimum black hole mass for X42.3+59 is 85 . Black hole X-ray binaries tend to produce QPOs while in the low/hard state, which corresponds to luminosities below 10% of the Eddington limit. If X42.3+59 is the source of the QPO detected from the central region of M82 and was is at a similar luminosity while the QPO is being produced, then the estimated black hole mass is of order 1000 . This may indicate the presence of a second intermediate-mass black hole candidate in M82.
4.3 X-Ray Periodicity
We have found an apparent 62 day periodicity in the X-ray light curve of M82, which likely arises from X41.4+60, the brightest X-ray source in the galaxy. This periodicity could be due to orbital modulation, superorbital modulation, or an aperiodic phenomena.
The X-ray emission of several black hole X-ray binaries is modulated at the orbital period. In particular, Cygnus X-3 presents a clear case, known since 1980 (Elsner et al., 1980), of a modulation in X-rays at the orbital period. More recently, Boyd, Smale, Dolan (2001) found a modulation at the 1.7 day orbital period of LMC X-3, a black hole X-ray binary with a high mass companion. Also, recent results on systems with giant companion stars suggest that such modulations are more common than in low-mass systems. Smith, Heindl, & Swank (2002) found modulations at 12 days for 1E 1740.7-2942 for 18 days for GRS 1758-258 which they interpret as orbital (they also find superorbital modulations at around 600 days), and Corbet (2003) found a 24.06 day period in X-rays from GX 13+1, which he interprets as an orbital modulation. The modulations from these systems are roughly sinusoidal, but tend to have sharper peaks and troughs than pure sinusoids. The range of shapes is consistent with the shape of the modulation that we observe from M82. X-ray modulation at the orbital period appears common for systems with giant companions.
There are so-called super orbital modulations in the X-ray emission from X-ray binaries. For neutron star systems, the super orbital periods include the range around 62 days. However, to produce the flux observed from X41.4+60 from an accreting neutron star would required a beaming factor of larger than 300. This is much larger than has been suggested to be theoretically possible in mechanically beamed models, see above, and would require a beam with an angular spread of less than . For black hole X-ray binaries, the shortest superorbital period is 162 days (from SS 433 for which there is no dynamical mass measurement confirming its black hole status) and the superorbital periods are more typically in the 300-600 day range (for Cyg X-1, 1E 1740.7-2942, and GRS 1758-258). Therefore, the observed 62 day period lies outside the range of observed superorbital periods for black hole X-ray binaries. We cannot exclude the possibility that the process producing the 62 day modulation could be aperiodic. However, we are not aware of any process which would produce aperiodic, but relatively coherent, behavior with the time scale and modulation amplitude seen. We conclude that the periodicity in the RXTE light curve likely indicates the orbital period of X41.4+60.
Possible orbital periodicities have been reported for a few other ULXs. The previous best candidate is CG X-1 in the Circinus galaxy (Bauer et al., 2001) for which (almost) three periods of 7.5 hours were detected in an observation of 16.7 hours. The period was confirmed in additional (shorter) Chandra observations and a BeppoSAX observation of 14.4 hours (Bianchi et al., 2002), and also in an XMM-Newton observation of 28.9 hours (Weisskopf et al., 2004). The period is consistent with a main sequence companion with a mass near 1 or a similarly low mass core He-burning companion. The light curve of CG X-1 resembles that of an AM Herculis type cataclysmic variable star, with sharp transitions between high and low flux phases, and the source lies relatively close to the plane of the Milky Way , so it may be a foreground AM Her system Weisskopf et al. (2004).
Other reported detections of orbital modulations from ULXs are of substantially lower significance. Sugiho et al. (2001) report possible 31 hr or 41 hr periods from a 154 hr ASCA observation of IC 342 X-1, but the signal is relatively weak and even extraction of the best period is ambiguous. Liu et al. (2002) report a possible 2.1 hr period from M51 X-7, but only two cycles were detected in a single Chandra observation of 4.2 hr. Dewangan et al. (2005) report a periodicity of 1.6 hr from the same M51 source in a 5.8 hr XMM-Newton observation obtained 2.5 years after the Chandra observation, so it appears unlikely that the modulation is related to the binary orbit and, instead, is either a quasiperiodic or red-noise modulation of the flux. David et al. (2005) report a suggestion of a period of 8-10 hr from a ULX in the elliptical galaxy NGC 3379, but this is based on a 9 hr observation – a single orbital period. Quasiperiods have been seen from several ULXs including a hr quasiperiod from a source in NGC 7714 (Soria & Motch, 2004) and a hr quasiperiod from a source in M74 (Krauss et al., 2005). However, these quasiperiods are not stable enough to be interpreted as orbital modulations.
We note that very few ULXs have been monitored in a manner which would permit detection of modulations on time scales of tens of days. Indeed, the program described here is the only such ULX monitoring of which we are aware. Therefore, the lack of detections of modulations on time scales of tens of days may simply be an observational artifact. Monitoring programs extending over 100-300 days with observations every day or few days would be of great interest. We note that the best available optical constraint on the nature of a ULX companion star comes from an HST spectrum from which Liu, Bregman, & Seitzer (2004) identify the companion to NGC 5204 X-1 as a B0 Ib supergiant. They predict an orbital period on the order of 10 days. This provides additional motivation for searching for X-ray modulations from ULXs with time scales of tens of days.
4.4 Nature of the ULX companion star and formation of the ULX
We note that X41.4+60 is likely a Roche-lobe overflow system because wind-fed accretion cannot provide a sufficiently high mass accretion rate (Kaaret et al., 2004). In this case, the orbital period directly constrains the average density of the companion star according to the equation (Frank, King & Raine, 2002). If the orbital period is 62 days, then the mean density of the companion star is . This excludes main sequence stars, but would be compatible with giant stars or supergiant stars. If, instead, the 125.7 day periodicity is the orbital period, then the companion star density would be and the companion star must, again, be a giant or supergiant star.
As noted above, the only other ULX with a reasonably firm identification of the spectral type of the companion is NGC 5204 X-1 for which (Liu, Bregman, & Seitzer, 2004) find a spectral type of B0 Ib based on a far-ultraviolet spectrum. This may suggest that giant or supergiant companion stars are common in ULXs. However, more companion spectral types must be determined to drawn any firm conclusions. The spectral types for the companions to some other ULXs are been estimated using optical colors, but these classifications are suspect because optical emission from the accretion disk could affect the colors (Kaaret, 2005). The density of would be consistent with standard late K giant or late A supergiant stars. However, the properties of the companion star are significantly affected by the high rate of mass transfer, and stellar evolution calculations taking into account the mass transfer are required to properly understand the evolutionary state of the companion star.
Stellar evolution calculations performed by Li (2004) for a star with an initial mass of 15 orbiting a 1000 black hole show that the mass transfer rate exceeds when the companion evolves through the giant phase at 10 Myr after formation of the binary. Similar results are obtained by Portegies Zwart et al. (2004b). This mass transfer rate is more than sufficient to fuel the observed X-ray luminosity of . The lifetime of the giant phase is relatively short, on the order of years. This may suggest that the ULX phase is rather short lived and that systems with very high luminosities, on the order of , are rare (Kaaret, Simet, & Lang, 2006).
As noted in the introduction, X41.4+60 lies near and possibly within the super star cluster MGG 11. McCrady, Gilbert, & Graham (2003) estimate that MGG 11 is 7-12 Myr. Hence, the time required for the companion to evolve to the giant phase is consistent with the age of the cluster.
A possible mechanism for the formation of intermediate mass black holes with masses greater than is stellar collisions in the cores of dense stellar clusters (Portegies Zwart et al., 1999; Taniguchi et al., 2000; Miller & Hamilton, 2002). Portegies Zwart et al. (2004a) found that the extremely compact size of MGG 11, the half light radius is only 1.2 pc, causes massive stars to rapidly sink to the cluster center via dynamical friction. The time for sinking is shorter than the lifetimes of the stars, so a large number of massive stars accumulate in the cluster center where runaway collisions produce a star of that collapses to an intermediate mass black hole. This process does not occur in less dense clusters. The coincidence of the X41.4+60 with a super star cluster with the correct properties for the production of an intermediate mass black holes favors runaway collisions as the production mechanism of the ULX. Other models for intermediate mass black hole formation, such as remnants of the first generation of stars (Madau & Rees, 2001) or as the nuclei of captured satellite galaxies (King & Dehnen, 2004), would not predict such a coincidence.
Acknowledgments
We thank an anonymous referee for comments which helped improve the paper. PK thanks X.-D. Li and Simon Portegies Zwart for useful discussions and the Aspen Center for Physics for its hospitality. PK and MS acknowledge partial support from Chandra grant CXC GO5-6087X and NASA Grant NNG04GP66G. PK acknowledges support from a University of Iowa Faculty Scholar Award.
References
- Allen & Kronberg (1998) Allen, M. L., & Kronberg, P. P. 1998, ApJ, 502, 218
- Bauer et al. (2001) Bauer, F.E., Brandt, W.N., Sambruna, R.M., Chartas, G., Garmire, G.P., Kapsi, S., Netzer, H. 2001, ApJ, 122, 182
- Begelman (2002) Begelman, M.C. 2002, ApJ, 568, L97
- Bianchi et al. (2002) Bianchi, S., Matt, G., Fabian, A.C., Iwasawa, K., Nicastro, F. 2002, A&A, 396, 793
- Boyd, Smale, Dolan (2001) Boyd, P.T., Smale, A.P., Dolan, J. F. 2001, ApJ, 555, 822
- Colbert & Mushotzky (1999) Colbert, E.J.M. & Mushotzky, R.F. 1999, ApJ, 519, 89
- Collin & Kawaguchi (2004) Collin, S. & Kawaguchi, T. 2004, A&A, 426, 797
- Corbet (2003) Corbet, R.H.D. 2003, ApJ, 595, 1086
- David et al. (2005) David, L.P., Jones, C., Forman, W., Murray, S.S. 2005, ApJ, 635, 1053
- Dewangan et al. (2005) Dewangan, G.C. Griffiths, R.E., Choudhury, M., Miyaji, T., Schurch, N.J. 2005, ApJ, 635, 198
- Dewangan, Titarchuk, & Griffiths (2006) Dewangan, G.C. Titarchuk, L., Griffiths, R.E. 2006, ApJL, to appear, astro-ph/0509646
- Elsner et al. (1980) Elsner, R.F., Ghosh, P., Darbro, W., Weisskopf, M.C., Sutherland, P.G., Grindlay, J.E. 1980, ApJ, 239, 355
- Fiorito & Titarchuk (2004) Fiorito, R. & Titarchuk, L. 2004, ApJ, 614, L113
- Frank, King & Raine (2002) Frank, J., King, A.R., & Raine, D.J. 2002, Accretion Power in Astrophysics (Cambridge University Press)
- Griffiths et al. (2000) Griffiths, R., Ptak, A., Feigelson, E.D, Garmire, G., Townsley, L., Brandt, W.N., Sambruna, R., Bregman, J.N. 2000, Science, 290, 1325
- Horne & Baliunas (1986) Horne, J.H. & Baliunas, S.L. 1986, ApJ, 302, 757
- Huang et al. (1994) Huang, Z. P., Thuan, T. X., Chevalier, R. A., Condon, J. J., & Yin, Q. F. 1994, ApJ, 424, 114
- Israel & Stella (1996) Israel, G.L. & Stella, L. 1996, ApJ, 468, 369
- Kaaret et al. (2001) Kaaret, P. et al. 2001, MNRAS, 321, L29
- Kaaret et al. (2003) Kaaret, P., Corbel, S., Prestwich, A.H., Zezas, A. 2003, Science, 299, 365.
- Kaaret et al. (2004) Kaaret, P., Alonso-Herrero, A., Gallagher, J.S. III, Fabbiano, G., Zezas, A., Rieke, M.J. 2004, MNRAS, 348, L28
- Kaaret (2005) Kaaret, P. 2005, ApJ, 629, 233
- Kaaret, Simet, & Lang (2006) Kaaret, P., Simet, M.G., Lang, C.C. 2006, Science, in press
- King et al. (2001) King, A.R. et al. 2001, ApJ, 552, L109
- King & Dehnen (2004) King, A.R. & Dehnen, W. 2004, MNRAS, 357, 275
- Krauss et al. (2005) Krauss, M.I., Kilgard, R.E., Garcia, M.R., Roberts, T.P., Prestwich, A.H. 2005, ApJ, 630, 228
- Körding et al. (2002) Körding, E. Flacke, H., & Markoff, S. 2002, A&A, 382, L13
- Kronberg & Wilkinson (1985) Kronberg, P.P. & Sramek, R.A. 1985, Science, 227, 28
- Landt et al. (2001) Landt, H. et al. 2001, MNRAS, 323, 757
- Liu et al. (2002) Liu, J.-F., Bregman, J.N., Lloyd-Davies, E., Irwin, J., Espaillat, C., Seitzer, P. 2002, ApJ, 621, L17
- Li (2004) Li, X.-D. 2004, ApJ, 616, L119
- Liu, Bregman, & Seitzer (2004) Liu, J.-F., Bregman, J.N., Seitzer, P. 2004, ApJ, 602, 249
- Madau & Rees (2001) Madau, P. & Rees, M.J. 2001, ApJ, 551, L27
- Makishima et al. (2000) Makishima, K. et al. 2000, ApJ, 535, 632
- Matsumoto et al. (2001) Matsumoto, H. et al. 2001, ApJ, 547, L25
- McClintock & Remillard (2003) McClintock, J.E. & Remillard. R.A. 2003, astro-ph/0306213
- McCrady, Gilbert, & Graham (2003) McCrady, N., Gilbert, A.M., Graham, J.R. 2003, ApJ, 596, 240
- McDonald et al. (2002) McDonald, A. R., Muxlow, T. W. B., Wills, K. A., Pedlar, A., & Beswick, R. J. 2002, MNRAS, 334, 912
- Miller & Hamilton (2002) Miller, M.C. & Hamilton, D.P. 2002, MNRAS, 330, 232
- Mirabel & Rodriguez (1999) Mirabel, I.F. & Rodriguez, L.F. 1999, ARA&A, 37, 409
- Misra & Sriaram (2003) Misra, R. & Sriram, K. 2003, ApJ, 584, 981
- Morgan et al. (1997) Morgan, E.H., Remillard, R.A., Greiner, J. 1997, ApJ, 482, 993
- Mucciarelli et al. (2006) Mucciarelli, P., Casella, P., Belloni, T., Zampieri, L., Ranalli, P. 2006, MNRAS, to appear, astro-ph/0509796
- Ohsuga et al. (2005) Ohsuga, K., Mori, M., Nakamoto, T., Mineshige, S. 2005, ApJ, 628, 368
- Portegies Zwart et al. (1999) Portegies Zwart, S.F., Makino, J., McMillian, S.L.W., Hut, P. 1999, A&A, 348, 117
- Portegies Zwart et al. (2004a) Portegies Zwart, S.F., Baumgardt, H., Hut, P., Makino, J., McMillan, S. L. W. 2004, Nature 428, 724
- Portegies Zwart et al. (2004b) Portegies Zwart, S.F., Dewi, J., Maccarone, T. 2004, MNRAS, 355, 413
- Ptak & Griffiths (1999) Ptak, A. & Griffiths, R. 1999, ApJ, 517, L85
- Rephaeli & Gruber (2002) Rephaeli, Y. & Gruber, D. 2002, A&A, 389, 752
- Rodriguez-Rico et al. (2004) Rodriguez-Rico, C. A., Viallefond, F., Zhao, J.-H., Goss, W. M., & Anantharamaiah, K. R. 2004, ApJ, 616, 783
- Ruszkowski & Begelman (2003) Ruszkowski, M. & Begelman, M.C. 2003, ApJ, 586, 384
- Taniguchi et al. (2000) Taniguchi, Y., Shioya, Y., Tsuru, T.G., Ikeuchi, S. 2000, PASJ, 52, 533
- Smith, Heindl, & Swank (2002) Smith, D.M., Heindl, W.A., Swank, J.H. 2002, ApJ, 578, L132
- Soria & Motch (2004) Soria, R. & Motch, C. 2004, A&A, 422, 915
- Strohmayer & Mushotzky (2003) Strohmayer, T.E. & Mushotzky, R.F. 2003, ApJ, 586, L61
- Sugiho et al. (2001) Sugiho, M.., Kotoku, J., Makishima, K., Kubota, A., Mizuno, T., Fukazawa, Y., Tashiro, M. 2001, ApJ, 561, L73
- Vaughan (2005) Vaughan, S. 2005, MNRAS, 431, 391
- Warner et al. (2004) Warner, C., Hamann, F., Dietrich, M. 2004, ApJ, 608, 136
- Watarai et al. (2005) Watarai, K.-Y., Ohsuga, K., Takahashi, R., Fukue, J. 2005, PASJ, 57, 513
- Weisskopf et al. (2004) Weisskopf, M.C., Wu, K., Tennant, A.F., Swartz, D.A., Ghosh, K.K. 2004, ApJ, 605, 360