X-ray spectra of sources in the 13H XMM-Newton / Chandra deep field
Abstract
We present the X-ray spectra of 86 optically-identified sources in the 13H XMM-Newton/Chandra deep field which have X-ray counts. The majority of these sources have 2-10 keV fluxes between and erg cm-2 s-1. The sample consists of 50 broad line AGN, 25 narrow emission line galaxies, 6 absorption line galaxies, and 5 Galactic stars. The majority (42/50) of the broad line AGN have X-ray spectra which are consistent with a power law shape. They have a mean photon index and an intrinsic dispersion . Three of the broad line AGN show curved spectra, with more emission near the high and low energy ends of the spectrum relative to the emission in the 1-2 keV range than can be reproduced by the power law model. Five BLAGN show a deficit of soft X-rays, indicating absorption. We consider a source to be significantly absorbed if a power law model fit is rejected with confidence and an absorbed power law model produces an acceptable fit, or if the best-fit power law is abnormally hard (). Significant absorption is more common in the narrow emission line galaxies (13/25) and absorption line galaxies (2/6) than in the broad line AGN (5/50), but is not universal in any of these classes of object. The majority of the 20 absorbed sources have X-ray spectra consistent with a simple cold photoelectric absorber, but a significant minority (6/20) require more complex models with either an additional component of soft X-ray emitting plasma, or an ionised absorber. Of the 16 narrow emission line and absorption line galaxies which do not show evidence for X-ray absorption, only 2 objects are likely to be powered by star formation, and both have 2–10 keV X-ray luminosities of erg s-1. The X-ray emission in the other 14 unabsorbed NELGs and galaxies is most likely powered by AGN, which are not detected in the optical because they are outshone by their luminous host galaxies. The Galactic stars show multi-temperature thermal spectra which peak between 0.5 and 1 keV. Star/AGN discrimination is possible for 4 of the 5 stars solely from their X-ray spectra.
keywords:
surveys – X-rays: galaxies – galaxies: active – quasars: general1 Introduction
The cosmic X–ray background (CXRB) is widely interpreted as the integrated X-ray emission from many discrete sources. Active galactic nuclei (AGN) are expected to contribute the majority of the CXRB, and since the late 1980s the leading ‘synthesis models’ have invoked a combination of absorbed and unabsorbed AGN to reproduce the overall intensity and broadband spectral shape of the CXRB. Typically these synthesis models are based on AGN ‘unification schemes’ (Antonucci, 1993) in which each AGN contains an obscuring torus, and the orientation to our line of sight determines the absorption (e.g. Setti & Woltjer, 1989; Comastri et al., 1995; Gilli, Risaliti & Salvati, 1999).
The energy density of the CXRB peaks at keV, but the CXRB has only been substantially resolved into sources at lower energies. In the 0.5-2 keV band, the deepest surveys with ROSAT resolved 70-80% of the X–ray background into individual objects, the majority of which are broad-line AGN (e.g. McHardy et al., 1998; Hasinger et al., 1998). Deep surveys performed with XMM-Newton and Chandra have increased the resolved fraction to 80-90% in the 0.5-2 keV band, and have also resolved a significant fraction () in the 2-10 keV band (e.g. Hasinger et al., 2001; Giacconi et al., 2002; Alexander et al., 2003). The broadband X-ray spectral properties of the objects detected in the XMM-Newton and Chandra surveys support the hypothesis that the majority of the CXRB is due to AGN with a wide range of photoelectric absorption.
However, there have been a number of findings that are contrary to the assumptions and predictions of the synthesis models. Firstly, the optical and X-ray spectroscopic characteristics of the X-ray sources are sometimes discrepant. There are now many examples of AGN which appear to show photoelectric absorption from large column densities ( cm-2) of material, but which exhibit little attenuation to their optical and ultraviolet radiation (e.g. Page, Mittaz & Carrera, 2001; Maiolino et al., 2001). On the other hand, there are also examples of AGN for which the broad optical emission lines are weak or absent, suggesting obscuration of the broad line region by dust, but which show little or no absorption in their X-ray spectra (e.g. Pappa et al., 2001; Barcons et al., 2003; Mateos et al., 2005b).
Secondly the absorbed sources, and those without broad optical emission lines in their optical spectra (often referred to as ‘type 2’ AGN), are typically found at lower redshifts than predicted by the synthesis models (Barger et al., 2003, 2005; Mainieri et al., 2005). This suggests that the absorption properties of AGN have some dependence on either luminosity or redshift, in contrast to the very simple geometric unification schemes employed in the earlier versions of the synthesis models, which were independent of luminosity or redshift. However, this issue is still controversial (e.g. see Treister et al., 2004; Dwelly et al., 2005) and determining the absorption characteristics of AGN as a function of redshift and luminosity is one of the most important objectives of X-ray survey science.
The 13H XMM-Newton / Chandra deep field is a project to investigate the astrophysics of the major contributors to the CXRB, particularly sources around the break in the X–ray source counts where the contribution to the CXRB per log-flux interval peaks. In order to understand the phenomena, processes and conditions in these sources we combine the high quality X–ray spectra of XMM-Newton with the precise positions of Chandra and a host of other multi-wavelength data, including a deep 1.4 GHz survey from the VLA (Seymour, McHardy & Gunn, 2004). The 13H field is centred at , was the location of one of the deepest ROSAT surveys (McHardy et al., 1998) and is a region of extremely low Galactic absorption ( cm-2).
In this paper we present the European Photon Imaging Camera (EPIC, Turner et al., 2001; Strüder et al., 2001) spectra of the 13H sources that have been optically identified and which have sufficient X-ray counts to yield a meaningful X-ray spectrum. At present, this amounts to 86 sources. Throughout this paper we assume km s-1 Mpc-1, , and . We define a power law spectrum as where is the number of photons, is photon energy, is the photon index and is the normalisation. The source numbering scheme used here is identical to that used in Loaring et al. (2005).
2 X-ray Observations and data reduction
The 13H field was observed three times with XMM-Newton for a total exposure time of 200 ks. When deadtime and periods of high background are excluded, the total live exposure time is 120 ks for the pn camera and 130 ks for each of the MOS cameras. The XMM-Newton observations are fully described in Loaring et al. (2005).
The EPIC spectra were produced from the same event lists, filtered with the same good time intervals, and using the same version of the XMM-Newton Science Analysis System (SAS 6.0) as the source lists presented in Loaring et al. (2005). Spectra were produced for all optically-identified sources with source counts. Source counts were accumulated in elliptical regions centred on the positions reported by Loaring et al. (2005). The size and ellipticity of each source extraction region was determined by the off-axis angle of the X-ray source, and its countrate. The point spread function is relatively symmetrical near the centre of the XMM-Newton field of view but becomes elongated in the tangential direction at larger off-axis angles. Therefore to optimise signal to noise the ellipticity of the source extraction regions increases with off-axis angle, from 0 at the optical axis to 2 near the edge of the field. The minor axes of our source regions vary from 10 to 20 depending on the overall source countrates. There are several pairs of sources which are close enough together that the nominal extraction regions would overlap. In such cases the two regions were renormalised so that they do not overlap, with the ratio of the minor axes set to the ratio of the countrates of the two sources.
All valid event patterns (PATTERN 0–12) were used in constructing the MOS spectra. For the pn spectra, single and double events (PATTERN 0–4) were used for channel energies keV, and only single events were used for lower energy channels. Channels close to the energies of the strongest instrumental emission lines (Cu-K at 7.8 keV in pn and Al-K at 1.7 keV in MOS) were excluded from the spectra. Response matrices and effective area files were constructed for each source region using the SAS tasks RMFGEN and ARFGEN respectively. For each source the different EPIC spectra were combined to form a single spectrum over the 0.2–12 keV range, using the method of Page, Davis & Salvi (2003). Spectra were grouped to a minimum of 30 counts per bin.
3 Optical spectroscopic identification
Optical spectroscopic observations were carried out in 2002 and 2003 at the William Herschel Telescope, using the AF2/WYFFOS multi-fibre positioner and spectrograph, and at the W.M. Keck observatory, using the LRIS and DEIMOS multi-object spectrographs. At present, 115 XMM-Newton and Chandra sources have optical spectroscopic identifications and redshifts. Full details of the observations and the optical spectra will be presented in Loaring et al. (in prep).
| Source | P | ||||
|---|---|---|---|---|---|
| BLAGN: | |||||
| 5 | 3.43 | 1 / 2 | 0.67 | ||
| 7 | 1.68 | 10 / 9 | 0.36 | ||
| 8 | 0.92 | 1 / 2 | 0.66 | ||
| 12 | 2.11 | 8 / 9 | 0.52 | ||
| 13 | 1.08 | 33 / 23 | |||
| 19 | 0.97 | 18 / 17 | 0.38 | ||
| 24 | 0.73 | 10 / 15 | 0.82 | ||
| 27 | 2.81 | 12 / 9 | 0.20 | ||
| 30 | 2.14 | 57 / 36 | |||
| 32 | 1.61 | 45 / 55 | 0.83 | ||
| 39 | 1.64 | 39 / 35 | 0.28 | ||
| 40 | 1.37 | 15 / 4 | |||
| 41 | 1.60 | 12 / 9 | 0.22 | ||
| 42 | 1.34 | 32 / 18 | |||
| 46 | 2.42 | 19 / 17 | 0.31 | ||
| 48 | 1.69 | 8 / 12 | 0.82 | ||
| 50 | 0.85 | 62 / 45 | |||
| 52 | 0.39 | 60 / 30 | |||
| 53 | 0.77 | 30 / 17 | |||
| 60 | 2.47 | 8 / 9 | 0.56 | ||
| 65 | 1.14 | 153 / 98 | |||
| 69 | 1.19 | 10 / 14 | 0.73 | ||
| 73 | 0.55 | 2 / 5 | 0.81 | ||
| 77 | 2.59 | 16 / 13 | 0.26 | ||
| 80 | 1.00 | 8 / 5 | 0.13 | ||
| 81 | 1.57 | 23 / 21 | 0.36 | ||
| 93 | 1.87 | 8 / 8 | 0.44 | ||
| 96 | 1.50 | 31 / 11 | |||
| 97 | 1.36 | 72 / 62 | 0.19 | ||
| 101 | 0.52 | 47 / 20 | |||
| 108 | 2.07 | 2 / 3 | 0.52 | ||
| 113 | 0.57 | 87 / 56 | |||
| 119 | 0.26 | 40 / 50 | 0.79 | ||
| 121 | 1.14 | 57 / 56 | 0.46 | ||
| 129 | 1.89 | 15 / 18 | 0.65 | ||
| 132 | 0.71 | 115 / 31 | |||
| 134 | 1.18 | 73 / 39 | |||
| 143 | 1.89 | 46 / 45 | 0.45 | ||
| 161 | 2.01 | 3 / 7 | 0.88 | ||
| 162 | 1.77 | 13 / 10 | 0.25 | ||
| 164 | 1.49 | 8 / 5 | 0.18 | ||
| 173 | 2.48 | 14 / 11 | 0.25 | ||
| 178 | 2.66 | 3 / 4 | 0.62 | ||
| 190 | 2.82 | 15 / 15 | 0.42 | ||
| 196 | 1.38 | 11 / 10 | 0.33 | ||
| 208 | 1.39 | 17 / 23 | 0.79 | ||
| 212 | 1.63 | 32 / 35 | 0.63 | ||
| 217 | 2.28 | 16 / 13 | 0.23 | ||
| 218 | 1.89 | 30 / 17 | |||
| 221 | 1.62 | 34 / 33 | 0.40 | ||
| Table 1. continued | |||||
| Source | P | ||||
| NELGs: | |||||
| 1 | 0.39 | 1 / 1 | 0.48 | ||
| 20 | 0.17 | 4 / 7 | 0.77 | ||
| 56 | 0.06 | 12 / 4 | |||
| 62 | 0.43 | 5 / 3 | 0.18 | ||
| 66 | 0.29 | 1 / 3 | 0.77 | ||
| 67 | 0.34 | 111 / 30 | |||
| 76 | 0.49 | 3 / 4 | 0.60 | ||
| 94 | 0.85 | 6 / 3 | |||
| 100 | 0.27 | 14 / 3 | |||
| 103 | 0.55 | 29 / 18 | |||
| 109 | 0.57 | 87 / 24 | |||
| 115 | 0.23 | 17 / 25 | 0.88 | ||
| 118 | 0.06 | 3 / 5 | 0.76 | ||
| 126 | 1.09 | 7 / 3 | |||
| 131 | 0.22 | 4 / 4 | 0.36 | ||
| 142 | 0.31 | 101 / 23 | |||
| 153 | 0.43 | 4 / 3 | 0.22 | ||
| 165 | 0.56 | 26 / 13 | |||
| 175 | 0.36 | 68 / 34 | |||
| 186 | 0.81 | 1 / 5 | 0.94 | ||
| 193 | 0.12 | 2 / 4 | 0.69 | ||
| 200 | 0.88 | 5 / 7 | 0.62 | ||
| 213 | 0.80 | 16 / 7 | |||
| 222 | 0.26 | 17 / 10 | |||
| 225 | 0.26 | 17 / 4 | |||
| galaxies: | |||||
| 37 | 0.26 | 16 / 18 | 0.62 | ||
| 55 | 1.08 | 4 / 10 | 0.94 | ||
| 92 | 0.29 | 37 / 12 | |||
| 98 | 0.36 | 12 / 5 | |||
| 117 | 0.62 | 9 / 4 | |||
| 184 | 0.55 | 14 / 10 | 0.16 | ||
| stars: | |||||
| 49 | 37 / 19 | ||||
| 61 | 110 / 19 | ||||
| 120 | 31 / 11 | ||||
| 140 | 8027 / 165 | ||||
| 179 | 2 / 4 | 0.70 | |||
4 Results
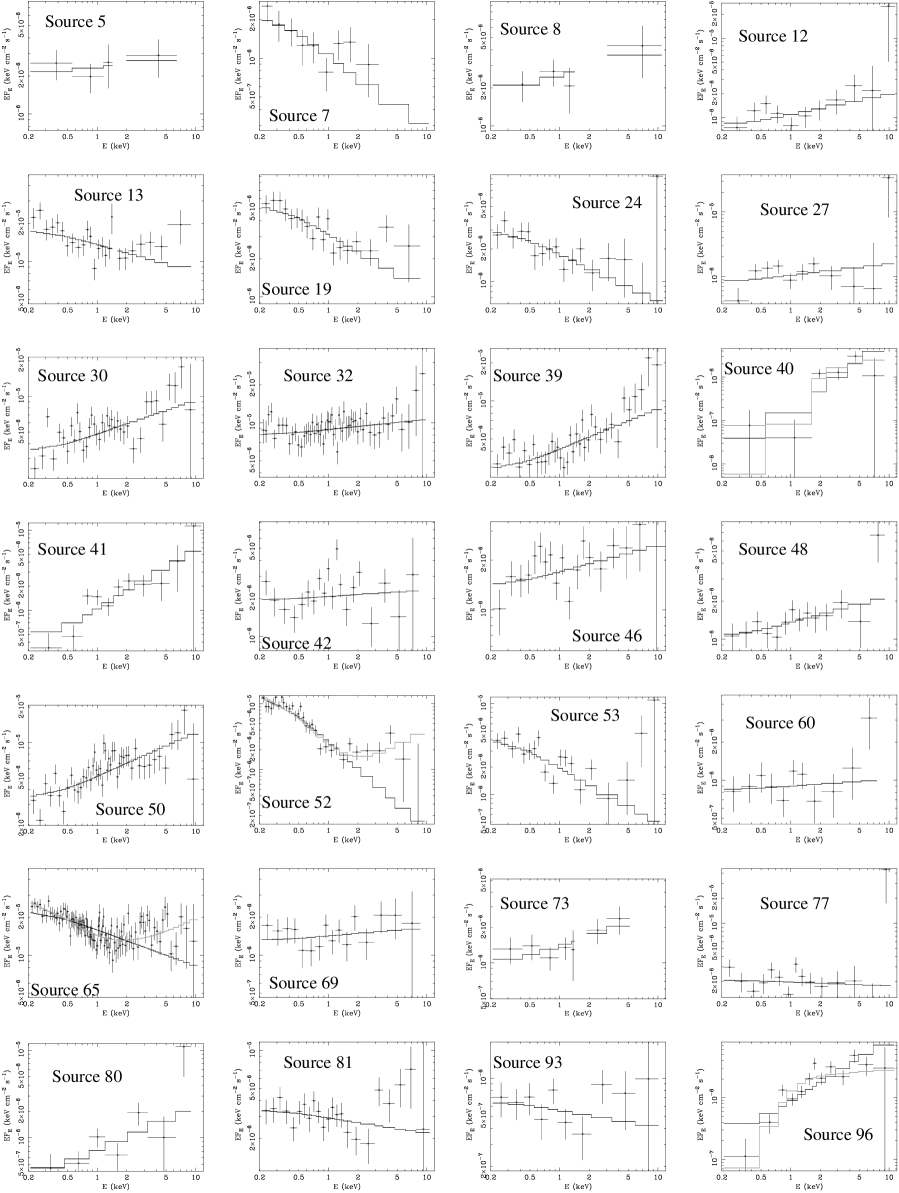
![[Uncaptioned image]](/html/astro-ph/0604015/assets/x2.png)
Figure 1 X-ray spectra of the BLAGN continued
There are 183 sources with source counts in the 13H field, 86 of which are optically identified. The majority of these identified sources have 2-10 keV fluxes in the range – erg cm-2 s-1. We have divided these 86 sources into four categories according to their optical spectroscopic properties: 50 broad line AGN (BLAGN) which have one or more emission lines with full-width half maximum (FWHM) km s-1, 25 narrow emission line galaxies (NELGs) which have emission lines of FWHM km s-1, 6 absorption line galaxies which do not exhibit any emission lines in our optical spectra (hereafter simply ‘galaxies’), and 5 Galactic stars.
As a starting point for the X-ray spectral investigations we fitted each spectrum with a power law model, and fixed Galactic absorption ( cm-2). The results of these fits are given in Table 1. The individual spectra, grouped by optical counterpart type, are shown along with the best-fit power law models in figs. 1, 2, 3, and 4. In order to show the intrinsic shapes of the spectra, both the spectra and the models in figs. 1, 2, 3, and 4 have been divided by the product of the EPIC effective area and the Galactic transmission on a channel by channel basis. For the sample size of 86 spectra, we consider a null hypothesis probability of 1% to be an appropriate threshold between acceptable and unacceptable goodness of fit. We now describe the EPIC spectral fits for each of the four optical spectroscopic subclasses.
4.1 BLAGN
The BLAGN represent the largest subsample, numbering 50 sources. The power law model is quite successful for these sources: 42 can be fitted acceptably with the power law model, and 8 cannot. The mean best fit spectral index of the acceptably fitted sources is .
Inspection of Fig. 1 reveals that the poorly fitting spectra deviate from a power-law shape in several different ways. Just over half of the poor-fitting spectra are relatively hard, (sources 40, 96, 101, 132 and 134), while the other three are relatively soft (sources 52, 65 and 113). The hard spectrum sources could deviate from power law shapes because they are photoelectrically absorbed. Therefore, we refitted these spectra, including photoelectric absorption from cold gas at the same redshift as the AGN. To minimise the number of free parameters in the fit, we fixed the power law slopes at a ‘typical’ BLAGN value of and assumed Galactic abundances (Anders & Grevesse, 1989). The results are given in Table 2. For three of the sources acceptable fits were obtained, while for source 132 the fit was significantly better than the simple power law fit, though still rejected at 99% confidence. However, for source 101 there was no improvement to the compared to the power law model, and the best fit column density is zero. For source 132, the largest contribution to comes from the two lowest-energy channels, which are in excess of the model, while for source 101 there is a minimum around 0.7 keV (observed frame) which the model cannot reproduce.
| Source | P | |||
| ( cm-2) | ||||
| BLAGN: | ||||
| 40 | 5 / 4 | |||
| 96 | 18 / 11 | |||
| 101 | 54 / 20 | |||
| 132 | 53 / 31 | |||
| 134 | 58 / 39 | |||
| NELGs: | ||||
| 62∗ | 7 / 3 | |||
| 66∗ | 1 / 3 | 0.70 | ||
| 67 | 38 / 30 | 0.15 | ||
| 76∗ | 8 / 4 | 0.11 | ||
| 109 | 97 / 24 | |||
| 126∗ | 2 / 3 | 0.63 | ||
| 142 | 31 / 23 | 0.13 | ||
| 165∗ | 22 / 13 | |||
| 175 | 82 / 34 | |||
| 184 | 25 / 3 | |||
| 213∗ | 5 / 7 | 0.62 | ||
| 222∗ | 21 / 10 | |||
| 225 | 18 / 4 | |||
| galaxies: | ||||
| 92 | 15 / 12 | 0.26 | ||
| 98∗ | 7 / 5 | 0.20 | ||
There are several reasonable modifications to the absorption model that might better reproduce the spectra of sources 101 and 132. Firstly, there might be some extra emission component at the softest energies. We tried two variants of such a model: one including an emission line component, modelled as a low temperature thermal plasma (mekal in XSPEC), and one including a component of unabsorbed power law emission. Soft X-ray emission lines are prominent in the spectra of nearby Seyfert 2 galaxies (e.g. Sako et al., 2001; Kinkhabwala et al., 2002), and although they are photoionised rather than collisionally ionised, the mekal model is a reasonable approximation at the resolution and signal to noise ratio of our EPIC spectra. On the other hand, an unabsorbed power law component could represent primary emission that has been scattered into our line of sight, bypassing the absorbing medium. Such a model has been used widely (e.g. Turner et al., 1997; Franceschini et al., 2003; Caccianiga et al., 2004) and has a simple and convenient functional form. The results for these two fits are given in Tables 3 and 4. The model with an unabsorbed power law component fits the spectrum of source 132, but not the spectrum of source 101. The model including a soft thermal component provides a good fit to the spectra of both objects.
| Source | P | ||||
| ( cm-2) | |||||
| BLAGN: | |||||
| 101 | 38 / 19 | ||||
| 132 | 39 / 30 | 0.12 | |||
| NELGs: | |||||
| 100 | 1 / 2 | 0.51 | |||
| 109 | 28 / 23 | 0.20 | |||
| 175 | 54 / 33 | ||||
| 225 | 18 / 3 |
| Source | normmek | P | ||||
| ( cm-2) | (keV) | |||||
| BLAGN: | ||||||
| 101 | 19 / 18 | 0.39 | ||||
| 132 | 33 / 29 | 0.30 | ||||
| NELGs: | ||||||
| 100 | 4 / 1 | |||||
| 109 | 28 / 22 | 0.18 | ||||
| 175 | 41 / 32 | 0.14 | ||||
| 225 | 1 / 2 | 0.55 |
The alternative to an additional soft component, is that the absorbing material is ionised, in which case the strongest absorption features will occur at higher energies than in a cold absorber, and there may be no need for additional soft X-ray components in sources 101 and 132. Therefore, we replaced the component of cold absorption with an ionised absorber (‘absori’ in XSPEC), and refitted the spectra of sources 101 and 132, again assuming and Galactic abundances. The results are given in Table 5 and show that this model fits both spectra well.
| Source | P | ||||
| ( cm-2) | |||||
| BLAGN: | |||||
| 101 | 21 / 19 | 0.35 | |||
| 132 | 34 / 30 | 0.28 | |||
| NELGs: | |||||
| 100 | 12 / 2 | ||||
| 109 | 59 / 23 | ||||
| 175 | 34 / 33 | 0.40 | |||
| 225 | 18 / 3 |
Absorption, either by cold or ionised gas, is unlikely to explain the poor fit of the power law model to sources 52, 65 and 113, which have relatively soft spectra (best fit ). In all three cases, the data systematically exceed the model at energies keV, indicating that the spectra are curved relative to a power law, or that there is more than one broadband component in the spectrum. We have explored two models for these spectra: a power law with a reflection component, and a two power law model, which will produce a curved continuum. The results of the reflection fits are given in Table 6. In all 3 cases, the values indicate acceptable fits when the reflection component is included, but the degree of reflection required is far too large to be physically realistic. The results of the double power law fits are given in Table 7. The goodness of fit is acceptable in all 3 cases.
| Source | P | ||||
|---|---|---|---|---|---|
| 52 | 41 / 29 | ||||
| 65 | 93 / 97 | 0.59 | |||
| 113 | 63 / 55 | 0.21 |
| Source | P | |||||
|---|---|---|---|---|---|---|
| 52 | 42 / 28 | |||||
| 65 | 96 / 96 | 0.48 | ||||
| 113 | 61 / 54 | 0.24 |
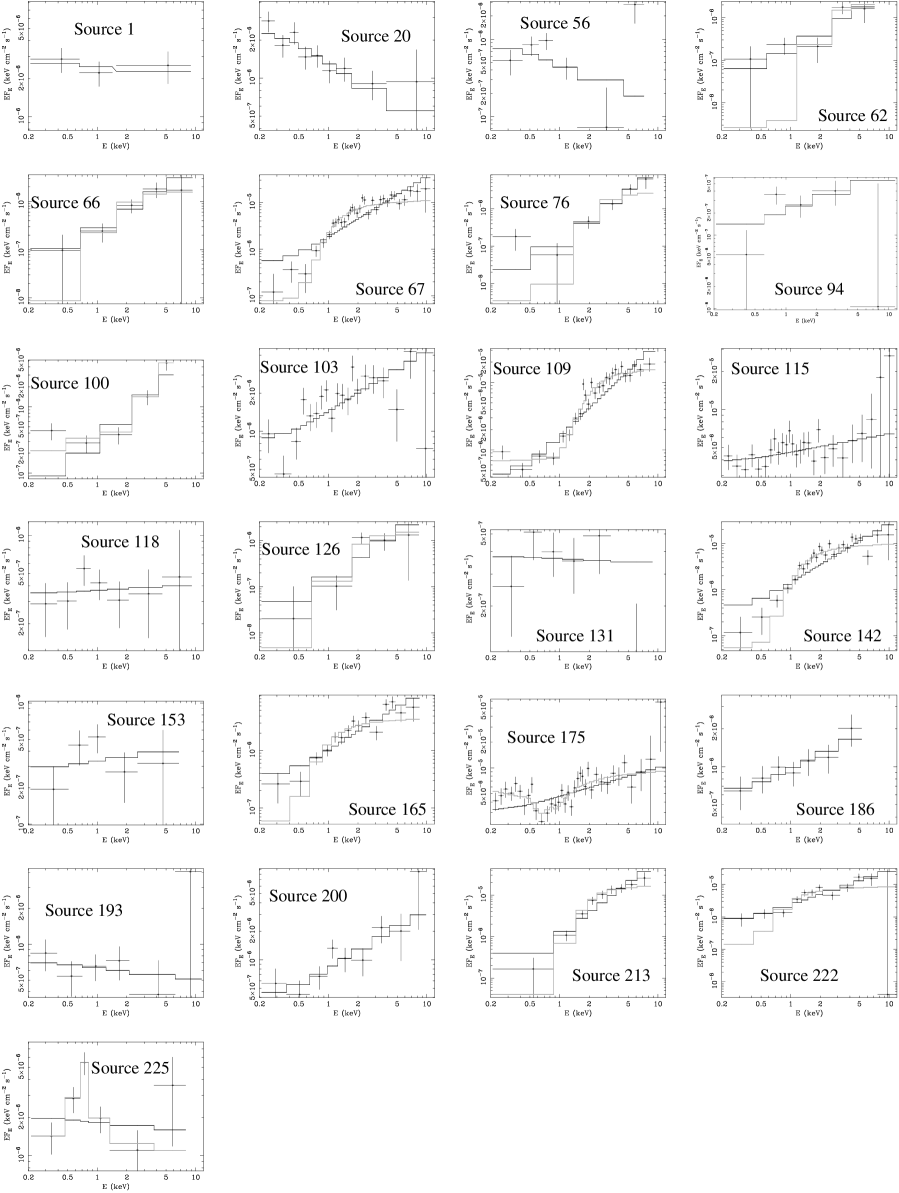
4.2 NELGs
The power law model was fitted to the NELG X-ray spectra and yielded acceptable fits in 19/25 cases (Table 1). Of the 6 NELGs for which the power law model is rejected at confidence, 4 have best fit , suggesting that the poor fits are due to photoelectric absorption. A further 7 NELGs with acceptable power law spectral fits have best fit . Such a hard spectral shape is unlikely to be the intrinsic continuum of an AGN. Therefore we refitted all of the sources which are not well fitted by the power law model, and all of the sources with best fit , with a power law absorbed by a neutral column of material at the same redshift as the object. The results are given in Table 2. Acceptable fits are found for all of the sources except for 100, 109, 175, and 225. We refitted these four spectra using the same set of models as for the BLAGN which could not be fitted with the cold absorption model. The fit with an additional unabsorbed power law yields an acceptable for sources 100, 109 and 175, but not for source 225 (Table 3), while the fit with a soft emission line component produces acceptable for all 4 objects (Table 4). The ionised absorption model is less successful: it produces a reasonable fit for source 175 but not for the other three objects (Table 5). Source 225 can only be adequately fitted when a soft thermal component is included, and in this case there is no requirement that the power law component is absorbed.
Of course it is possible that the NELGs which are well fitted by a power law and no intrinsic absorption could still harbour absorption at a level that is too small to be detected in our X-ray spectra. Therefore, for these 12 NELGs we have determined upper limits to the intrinsic column densities by fitting with a power law and intrinsic absorption, and increasing the column density until , corresponding to the 95% upper limit. To be conservative, we allowed to vary freely up to a maximum of . The results are given in Table 8; the majority of the sources have upper limits to which are cm-2.
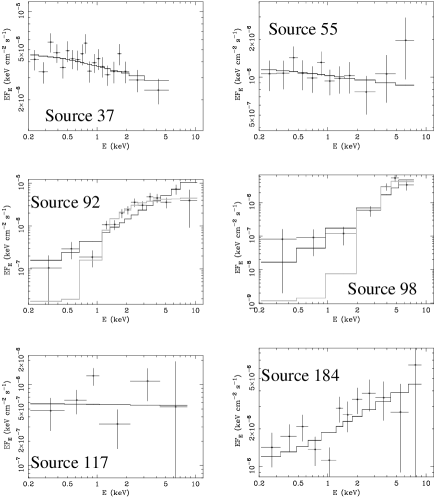
4.3 Absorption line galaxies
Of the 6 absorption line galaxies, only source 92 is poorly fitted with the power law model (see Table 1). This object, and source 98, require very hard spectral indices (), so we refitted these two spectra with a power law and cold photoelectric absorption. In both cases this provides an acceptable fit, as seen in Table 2.
For the four sources which were well fitted with a () power law model, we have worked out 95% upper limits to the amount of absorption which could be present by adding intrinsic photoelectric absorption to the power law model, and increasing the column density until ; the results are given in Table 8.
| Source | 95% upper limit |
|---|---|
| (cm-2) | |
| NELGs: | |
| 1 | 0.17 |
| 20 | 0.026 |
| 56 | 0.077 |
| 94 | 3.6 |
| 103 | 0.30 |
| 115 | 0.12 |
| 118 | 0.68 |
| 131 | 0.50 |
| 153 | 1.68 |
| 186 | 0.23 |
| 193 | 0.26 |
| 200 | 0.62 |
| galaxies: | |
| 37 | 0.096 |
| 55 | 0.22 |
| 117 | 3.1 |
| 184 | 0.070 |
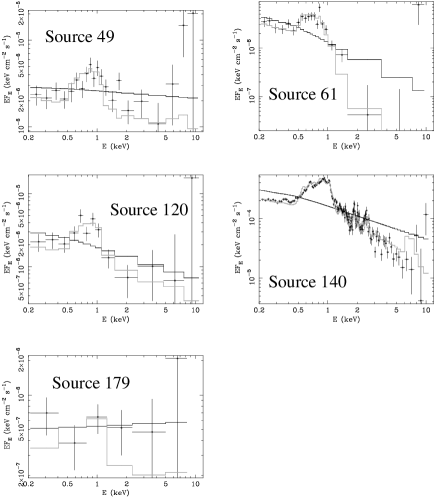
4.4 Galactic stars
We began with a power law fit to the stars including full Galactic absorption, exactly as for the extragalactic sources. The results are listed in Table 1, and the spectra are shown in Fig. 4. The power law model is rejected in four of the five stars, which show a distinctive emission peak between 0.5 and 1 keV, indicating optically-thin thermal emission. However, the power law model is an acceptable fit to the X-ray spectrum of source 179, which has by far the lowest quality spectrum. We next applied a single-temperature optically-thin thermal model (mekal). This model also failed to produce acceptable fits for 4 out of 5 stars (see Table 9): the stellar X-rays are distributed over a larger energy range than the model spectra. Therefore we fitted a multi-temperature mekal model that has a uniform distribution of emission measure with temperature up to a maximum temperature . The results of this model fit are listed in Table 10 and shown in Fig. 4. This model produced acceptable fits to the X-ray spectra of all the stars except source 140. However, inspection of Fig. 4 indicates that despite the large , the model reproduces the shape of the spectrum of source 140 quite well, but not in detail. Source 140 has the highest signal/noise X-ray spectrum by far within the 13H field; a more complex model would be required to reproduce the details, but this is beyond the scope of this paper.
| Source | P | |||
|---|---|---|---|---|
| (keV) | ||||
| 49 | 51 / 19 | |||
| 61 | 43 / 18 | |||
| 120 | 37 / 11 | |||
| 140 | 9645 / 165 | |||
| 179 | 3 / 4 | 0.56 |
| Source | P | |||
|---|---|---|---|---|
| (keV) | ||||
| 49 | 28 / 19 | |||
| 61 | 20 / 19 | 0.37 | ||
| 120 | 8 / 11 | 0.67 | ||
| 140 | 688 / 165 | |||
| 179 | 6 / 4 | 0.24 |
5 Discussion
5.1 Distinguishing Galactic stars from extragalactic objects
The overall X-ray spectral shapes of the Galactic stars could be reproduced by an optically-thin thermal model with a distribution of temperatures. This is broadly consistent with observations of nearby stars with active coronae (e.g. Guedel et al., 2001). The characteristic shape of their X-ray spectra, and the statistical rejection of the power law model, mean that these stars can be distinguished from the majority of the BLAGN by their EPIC X-ray spectra alone. This has considerable potential for the identification of Galactic stars in XMM-Newton surveys, independent of optical spectroscopy. In the 13H field, it provides confirmation that sources 49, 61, 120 and 140, have been correctly identified as Galactic stars. For source 141, the signal to noise of the X-ray spectrum is not sufficient to confirm or reject its identification as a Galactic star.

5.2 Spectral slopes of the extragalactic sources
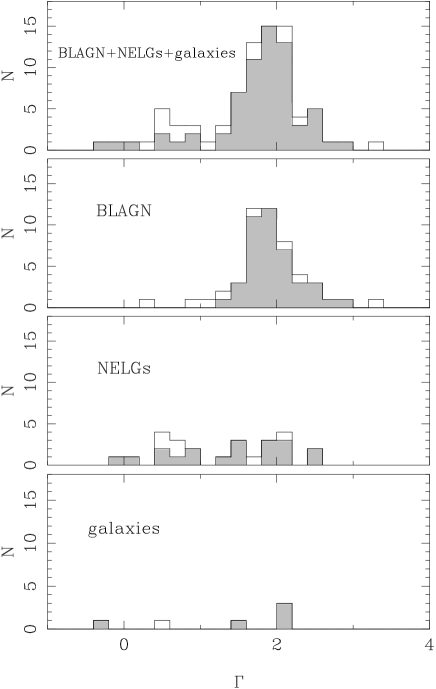
The distribution of best fit power law slopes is shown in Fig. 5. The distribution for all sources appears to be bimodal, with the larger peak at and the smaller peak at . However, when the distribution is broken into BLAGN, NELGs and galaxies it can be seen that the peak at comes almost entirely from the NELGs, of which a similar number have as have . The BLAGN power law slopes show no indication of bimodality. The power law slopes are shown as a function of redshift in Fig. 6. The slopes of the BLAGN show no trend with redshift, and are distributed relatively symmetrically around at all redshifts. The distribution of NELG and galaxy spectral slopes also shows no obvious trend with redshift.
The most outlying BLAGN photon indices (at and ) come from spectra which are not well fitted with a power law model. In contrast, the majority of the NELG spectra with are acceptably fitted with a power law, perhaps because they have on average fewer counts in their X-ray spectra than the BLAGN. Each of the 7 hard spectrum NELGs which have in the power law fit can also be fitted with an absorbed () power law. Although the individual spectra do not have good enough statistics to discriminate between the two models, we can compare the goodness of fit for the two models using the total for the 7 objects. For the power law model, the total , corresponding to a null hypothesis probability of , whereas the total for the absorbed power law model, corresponding to a null hypothesis probability of . Thus overall, the model with photoelectric absorption produces a better fit to the spectra of these 7 hard-spectrum NELGs than the unabsorbed power law model.
The sample of galaxies is much smaller than the sample of NELGs, and there are only two objects with best fit , one of which is acceptably fitted with a power law model, and one of which is not. Both of these objects are fitted well with an absorbed power law. Overall, these results suggest that photoelectric absorption is responsible for all of the spectra which appear to have in power law model fits.

Only a small proportion (5/50) of the BLAGN show significant evidence for absorption, hence for the BLAGN we can obtain a good estimate of the intrinsic distribution of spectral slopes. For this we assume a Gaussian distribution of spectral slopes and use the maximum likelihood method of Maccacaro et al. (1988) which takes into account the statistical errors on the individual spectral fits. We exclude the 5 sources which show evidence for photoelectric absorption because it is difficult to determine the intrinsic spectral shape for these sources. Three of the BLAGN appear to have spectra which are more complex than a power law, but we include these objects with their best fit single power law indices when calculating the distribution. The likelihood contours for the mean of the distributon and the intrinsic dispersion are shown in Fig. 7. The one-dimensional confidence intervals are , .
Our best fit is entirely consistent with that found by Mateos et al. (2005b) for a comparable sample of BLAGN in the Lockman Hole, and with that found by Mateos et al. (2005a) for a larger, but brighter sample of BLAGN studied with XMM-Newton. Indeed, is also consistent with the value of determined by Mittaz et al. (1999) for AGN in the soft X-ray ROSAT International X-ray Optical Survey (RIXOS). However, the value of found in the 13H field is somewhat larger than that found by Mateos et al. (2005a) and Mateos et al. (2005b), who obtained and respectively (their confidence intervals are 90%), and it is smaller than the obtained by Mittaz et al. (1999) for RIXOS AGN. It is likely that the large dispersion found with ROSAT is due to the fact that photoelectric absorption and AGN soft excess emission were both difficult to distinguish from a power law with the crude ROSAT PSPC spectra. Furthermore, photoelectric absorption and AGN soft excess emission both have a larger effect in the 0.1–2 keV band of the PSPC than in the 0.2–12 keV band of EPIC.
5.3 Spectra which are more complex than a power law with cold photoelectric absorption
There were 5 BLAGN and 4 NELGs which show spectra which are not well fitted with a power law and cold absorber model. Here we discuss these objects in more detail, starting with the BLAGN.
It is likely that the poor fit of the power law model to sources 65 and 113 owes more to the fact that they are among the best BLAGN spectra in terms of signal to noise ratio, than to a particularly large degree of curvature relative to the other BLAGN (Fig. 1). However, source 52 appears to show a more substantial departure from a single power law spectrum, showing a very soft spectrum below 2 keV, but a much harder spectrum at higher energy. This source showed a very soft spectrum in the original ROSAT survey (McHardy et al., 1998), and is a luminous example of a narrow line Seyfert 1. It was studied in its own right by Dewangan et al. (2001). The spectrum of source 52 in Fig. 1, shows significant similarity to the spectrum of the nearby narrow-line Seyfert 1 galaxy 1H 0707-495. In particular, 1H 0707-495 also has a very steep spectrum () when fitted with a single power law over the full XMM-Newton energy range, but has a much flatter spectrum above 2 keV (Boller et al., 2002). The most remarkable feature of the spectrum of 1H 0707-495 is a large edge at 7-7.6 keV and a significant deficit of counts at energies higher than this (Boller et al., 2002; Gallo et al., 2004). For source 52 at , a similar edge would be redshifted to 5-5.5 keV. Source 52 is not detected beyond this energy, so it could harbour a similar edge feature to 1H 0707-495. However, the spectrum is not good enough for us to determine with confidence whether such an edge is present at this energy.
Of the 5 BLAGN which show absorption, 3 are well fitted with a power law and cold photoelectric absorption, while sources 101 and 132 require more complicated models. Acceptable fits are found for these 2 sources when an additional soft emission component is included, or when the neutral absorber is replaced by an ionised one. In the model fits including an additional soft line emitting or unabsorbed power law component, source 132 has a soft component which emits between 5% and 21% as much power in the 0.2-1 keV band (observer frame) as the primary power law component. For source 101 the additional soft component is much more important, emitting 35–120% as much radiation in the 0.2-1 keV band as the primary power law. In both cases the additional soft component emits erg s-1 in the 0.2-1 keV band: such a high X-ray luminosity exceeds even the most X-ray luminous starburst galaxy known (Moran, Lehnert & Helfand, 1999). It is also unlikely that the soft emission comes from a group or cluster of galaxies in which the source is embedded because at such luminosities the X-ray emitting gas would be expected to have keV (Helsdon & Ponman, 2000), whereas the best fit temperatures are much lower than this in the mekal fits. Furthermore, sources 101 and 132 are consistent with point sources in the X-ray images, and are isolated, separated by more than an arcminute from their nearest XMM-Newton or Chandra neighbours. Therefore if these sources do have an additional soft component, it must be scattered or reprocessed AGN emission. While this is plausible for source 132, in which the soft component is as luminous as the primary AGN emission, for source 101 a scattered component would have a luminosity of more than a third of the primary component, which is untenable. The alternative, an ionised absorber, provides a good fit to both spectra, and is the only realistic hypothesis for source 101.
The situation is quite different for the four absorbed NELGs which are not well fitted with a power law and neutral photoelectric absorption. For three of these, sources 100, 109, and 225, the ionised absorber model does not fit the data, and an additional soft component is therefore neccessary. In the case of source 109, the additional soft component is likely to be due to contamination of the X-ray spectrum from the bright BLAGN, source 113, which is only 20′′ distant. Indeed, in the fit to source 109 with a mekal component, pegs at 10 keV, which is the maximum value that we allowed in the fit. At such a high temperature the mekal component is contributing more continuum than line emission, consistent with the hypothesis that the excess flux in the lowest energy channels of source 109 is actually continuum emission from source 113.
For source 225 the best fit mekal component has keV, and a 0.2-1 keV luminosity of ergs s-1, larger than that of the power law component in the same band. This luminosity is too large for either a starburst or scattered AGN emission to be plausible. However, source 225 is one of the seven extended X-ray sources identified with ‘EMLDETECT’ (Loaring et al., 2005), with a FWHM extent of arcseconds, so a significant fraction of the X-ray emission is likely to originate in a group or cluster of galaxies. The temperature and luminosity of source 225 are consistent with the relationship observed in galaxy groups (Helsdon & Ponman, 2000), further supporting this explanation.
In source 100 the soft component has a relatively low luminosity ( ergs s-1 in the 0.2–1 keV band), equivalent to of the primary power law emission in the same band. Therefore scattered emission from the AGN and hot gas from a starburst are both tenable explanations for the soft component in this source.
In the fit to source 175 including a mekal component, we obtain a very reasonable keV, but a soft component 0.2–1 keV luminosity of ergs s-1. This is equivalent to of the luminosity of the power law component in the same band, hence neither a starburst contribution, nor scattered AGN emission are feasible explanations. It is possible that a nearby X-ray source contributes to the soft emission: Chandra source number 159 from McHardy et al. (2003) is only distant, but is a factor of 10 fainter than source 175, and a visual inspection of the XMM-Newton 0.2–0.5 keV image indicates that this source does not contribute significantly. Therefore it appears that an ionised absorber is a better hypothesis for the X-ray spectral shape of source 175 than an additional soft component.

5.4 The luminosity distribution as a function of optical class
In Fig. 8 we show the 2–10 keV luminosities () as a function of redshift for the extragalactic sources. The luminosities are for the primary power law component only, are corrected for intrinsic and Galactic absorption, and are derived from the most realistic model fit to each source, as discussed in the text. At , optical spectroscopic identification of NELGs and galaxies is extremely difficult compared to BLAGN, so it is not suprising that the vast majority of optically identified sources at are BLAGN. Therefore it is useful to restrict our attention to , where we are able to identify the full range of optical counterparts, in order to examine the luminosity and absorption characteristics of the NELGs and galaxies with respect to the BLAGN. For , we see in Fig. 8 that the majority (13/15) of the X-ray absorbed sources are NELGs or galaxies, as expected in AGN unification schemes. However, the majority (15/29) of the NELGs and galaxies in this redshift range (i.e. ) do not show significant X-ray absorption. The NELGs and galaxies span the full X-ray luminosity range, but the X-ray absorbed sources are only found at ergs s-1. Indeed, the X-ray absorbed sources have a higher mean 2–10 keV luminosity ( ergs s-1) than the unabsorbed sources, which have ergs s-1. However the mean luminosity of the NELGs and galaxies ( ergs s-1) is smaller than the mean luminosity of the BLAGN ( ergs s-1).
5.5 The origin of the X-ray emission in the low luminosity extragalactic sources
For sources with erg s-1, the presence of an AGN is unambiguous. However, the lower luminosity X-ray sources could plausibly be powered by star formation, in which case the X-rays will be a composite of emission from massive X-ray binaries and optically thin thermal emission from hot interstellar gas within the galaxy. Therefore to determine whether the X-ray emission from these objects is powered by AGN, we must examine them in more detail on a case by case basis.
The two lowest luminosity sources, 56 and 118, have of and ergs s-1 respectively. They are both detected as point sources with XMM-Newton but are not detected with our point source searching method in the Chandra images (McHardy et al., 2003; Loaring et al., 2005), suggesting that the X-ray emission is signficantly extended with respect to the Chandra PSF (i.e. on a scale comparable to the optical galaxy). They are both bright radio sources ( mJy at 1.4 GHz), extended on a similar scale to the optical galaxy (Seymour, McHardy & Gunn, 2004) and so almost certainly powered by star formation. The starburst nature of source 56 is discussed at length in Gunn et al. (2001). In Fig. 2 we see that although the spectra are consistent with a power law shape, both have a low significance peak at keV, consistent with thermal emission from a starburst. Thus the X-ray emission from both source 56 and source 118 could quite plausibly be powered by star formation.
In contrast, the sources with ergs s-1 are much more likely to be AGN powered. Sources 20, 131 and 193 (all NELGs) show no evidence for thermal gas components in their spectra, which are consistent with power laws, suggesting that they are AGN. Both sources 131 and 193 are detected as point sources in the Chandra images (McHardy et al., 2003), consistent with this hypothesis. Source 20 was not detected with Chandra, but in this case variability, rather than spatial extent, is responsible. Source 20 was more than a factor 2 brighter during XMM-Newton revolution 0276 than it was 11 days later in revolution 282, and hence the emission must come from an AGN rather than a multitude of sources within the galaxy.
At higher luminosities, the hypothesis that star formation powers the X-ray emission becomes even less likely. Source 225 has a thermal component in its X–ray spectrum, but as discussed in Section 5.3 the X-ray emission is extended on a scale larger than the optical galaxy in this source, so the thermal emission is due to a group or cluster of galaxies. Source 153 is not detected at 1.4 GHz (Seymour, McHardy & Gunn, 2004), so is unlikely to be a vigourously star forming galaxy, while source 37 is almost certainly a BL Lac object (Gunn et al., 2003, Moss et al. in prep).
From the case by case examination of the 8 sources with ergs s-1, only the two lowest luminosity objects, 56 and 118, which have ergs s-1, appear to have X-ray emission dominated by star formation. In all the other cases the 2–10 keV X-ray emission appears to be AGN dominated. Apart from source 225, the AGN is also dominant in the 0.5–2 keV band in these objects.
5.6 The nature of the NELGs and galaxies without X-ray absorption
Excepting objects which are powered by star formation, the standard paradigm for X-ray selected NELGs and absorption line galaxies is that they are obscured AGN (e.g. Hasinger et al., 2001; Mainieri et al., 2002; Barcons et al., 2002). However in the 13H field, a significant number of the X-ray sources which are optically classified as NELGs and galaxies contain AGN (see Section 5.5) which do not show evidence for X-ray absorption. While for three of these objects (sources 94, 153 and 117), the current data do not allow us to rule out an absorber with a significant column density ( cm-2), for more than than half (8/14) of these objects the data imply cm-2 (Table 8, excluding objects 56 and 118 which are likely powered by star formation). For a Galactic gas to dust ratio and reddening curve (Bohlin et al., 1978), this would correspond to at most a factor of 3 attenuation to the broad H line. For some of the lower redshift objects the limits are so restrictive that optical reddening of the AGN should be negligible, e.g. source 20 has cm-2. Silverman et al. (2005) reported a number of objects in the Chandra Multiwavelength Project which appear to have similar properties and argued that this can be attributed to dilution of the AGN emission by the host galaxy light (see also Page et al., 2003; Severgnini et al., 2003).

The dilution hypothesis can be investigated by comparing the optical to X-ray flux ratios as a function of optical classification. The X-ray flux is completely dominated by the AGN component, while the optical flux comes largely from the AGN in sources classified as BLAGN but is dominated by the host galaxy in sources classified as NELGs and galaxies (Loaring et al. in prep). Fig. 9 shows the 2–10 keV flux of unabsorbed galaxies and NELGs with , against the R-band optical magnitude from McHardy et al. (2003). Sources 56 and 118 are not shown, because their X-ray emission is likely to be powered by stellar processes. Fig. 9 is restricted to sources with so that the R band corresponds to rest frame optical emission longward of the Balmer break. The solid line in Fig. 9 corresponds to the mean optical/X-ray ratio of the 6 BLAGN that are shown. The dashed lines correspond to dex about this ratio, which is approximately the standard deviation of optical/X-ray ratios found for X-ray selected BLAGN (Ciliegi et al., 1995). The NELGs are distributed over a broader region of Fig. 9 than the BLAGN, and more than half of the NELGs lie to the left of the region enclosed by the dashed lines, i.e. they have a larger optical/X-ray flux ratio than most of the BLAGN. Four of the NELGs are more than 3 magnitudes to the left of the solid line in Fig. 9. Therefore if they host active nuclei with optical/X-ray flux ratios typical for the BLAGN in Fig. 9, the nuclear component will be outshone by more than a factor of 15 in the optical by the surrounding galaxy. Two of the NELGs and one galaxy lie 1.5–2.5 magnitudes to the left of the solid line, suggesting that the active nucleus will be outshone by the host galaxy by factors of 3–10; dilution of the AGN component by starlight could reasonably explain the absence of broad emission lines in the optical spectra of these objects. The four remaining NELGs and galaxies, which lie within the region bounded by the dashed lines, have optical/X-ray ratios similar to those of the BLAGN. In these objects the stellar component produces a similar flux of optical radiation as we would expect to observe from the nucleus, given the X-ray flux. For dilution of the nuclear spectrum by galaxy starlight to explain the optical characteristics of these sources, their nuclear components must have optical/X-ray flux ratios which are smaller than the average for BLAGN. This however, is quite plausible if AGN with erg s-1 have a similar intrinsic scatter of optical/X-ray flux ratios to the scatter found in more luminous BLAGN ( dex, Ciliegi et al., 1995). The lack of NELGs and galaxies to the right of the dashed-line region of Fig. 9 is consistent with this picture: starlight is unlikely to render the broad emission lines unidentifiable when the host galaxy has a low luminosity compared to the nucleus, unless the optical/X-ray flux ratio of the nucleus is unusually low.
Fig. 9 therefore implies that in the NELGs and galaxies which do not show significant X-ray absorption, the lack of broad optical emission lines could be due to the low contrast of the emission lines against the much stronger starlight component. However, it should be noted that there are alternative hypotheses that are not presently ruled out. These objects could posess absorbing media with a high dust to gas ratio, and/or in which the gas is ionised and so its X-ray photoelectric opacity is reduced (Pappa et al., 2001). Discrimination between these hypotheses will require high spatial resolution, high signal to noise optical spectra (Severgnini et al., 2003). Alternatively, some of these objects could be BL Lac objects; this appears to be the case for at least source 37 (Gunn et al., 2003, Moss et al. in prep).
We calculated the absolute magnitudes for the 11 NELGs and galaxies shown in Fig. 9. The results are given in Table 11, and were calculated using the elliptical galaxy K-corrections from Coleman, Wu & Weedman (1980). These objects lie in the bright part of the galaxy luminosity function, having absolute magnitudes of around or brighter, where ( for km s-1 Mpc-1, Trentham, Sampson & Banerji, 2005) defines the knee in the luminosity function. On the other hand, they all host AGN which have erg s-1), lower than the knee in the X-ray luminosity function (e.g. Page et al., 1997; Barger et al., 2005; Hasinger et al., 2005). This combination of weak AGN and luminous host galaxies, given the relation (Ferrarese & Merritt, 2001), suggests that these objects host massive black holes ( M⊙, Page, 2001) with low Eddington ratios (). Such objects are not low mass objects formed at late times, the result of AGN ‘cosmic downsizing’ as argued by Barger et al. (2005), but are instead the relatively inactive remnants of once-luminous AGN.
| Source | |
|---|---|
| 1 | -22.306 |
| 20 | -22.303 |
| 37 | -23.175 |
| 103 | -22.169 |
| 115 | -22.892 |
| 117 | -21.896 |
| 131 | -21.872 |
| 153 | -21.814 |
| 184 | -22.550 |
| 193 | -22.834 |
| 225 | -23.317 |
6 Conclusions
We have presented the XMM-Newton EPIC X-ray spectra of 86 X-ray sources in the 13H field which have optical identifications and X-ray counts. More than half of the sources are BLAGN, and the majority of these (42/50) have spectra which are consistent with a power law shape. The photon indices are distributed about a mean with an intrinsic dispersion of . Of the 8 BLAGN which have X-ray spectra inconsistent with a power law shape, 3 have curvature with excess emission at the high and low energy ends relative to a power law, and 5 show evidence for absorption at soft X-ray energies. The addition of a cold photoelectric absorber yields an acceptable fit for 3 of these objects, one requires an ionised absorber, and the remaining object can be fitted with either an ionised absorber or with an additional component of scattered or reprocessed soft X-ray emission.
Of the 25 NELGs, 13 have absorbed X-ray spectra, 9 of which can be fitted with a cold photoelectric absorber, and 4 of which require a more complex model with either an ionised absorber or an additional component of soft X-ray emission. Of the 6 absorption line galaxies in the sample, 2 show evidence for X-ray absorption, and both are consistent with a simple cold photoelectric absorber. Of the 12 NELGs which do not show evidence for X-ray absorption, 2 have X-ray properties which suggest that their X-ray emission is powered by star formation. The other 14 NELGs and galaxies which are not X-ray absorbed have X-ray properties implying the presence of an AGN. At least at , where our R-band imaging probes the rest-frame optical starlight, these objects are luminous galaxies (), containing relatively low X-ray luminosity AGN ( erg s-1), and the lack of AGN signatures in the optical could be due to the dilution of the AGN radiation by the bright host galaxy. These objects are likely to be massive black holes ( M⊙) accreting with low Eddington ratios (), rather than vigorous, low mass black holes.
Finally, the sample contains 5 Galactic stars which have X-ray spectra consistent with optically thin thermal emission with a broad distribution of temperature, consistent with active stellar coronal emission. In 4 of the 5 stars, the X-ray spectra alone can distinguish them from AGN at similar X-ray flux levels.
7 Acknowledgments
Based on observations obtained with XMM-Newton, an ESA science mission with instruments and contributions directly funded by ESA Member States and NASA. The William Herschel Telescope is operated on the island of La Palma by the Isaac Newton Group in the Spanish Observatorio del Roque de los Muchachos of the Instituto de Astrofisica de Canarias. The W.M. Keck Observatory is operated as a scientific partnership among the California Institute of Technology, the University of California and the National Aeronautics and Space Administration and was made possible by the generous financial support of the W.M. Keck Foundation. We thank Sergey Kuznetsov for helpful comments.
References
- Alexander et al. (2003) Alexander D.M., et al., 2003, AJ, 126, 539
- Anders & Grevesse (1989) Anders E. & Grevesse N., 1989, Geochimica et Cosmochimica Acta, 53, 197
- Antonucci (1993) Antonucci R., 1993, Annu. Rev. A&A, 31, 473
- Barcons et al. (2002) Barcons X., et al., 2002, A&A, 382, 522
- Barcons et al. (2003) Barcons X., Carrera F.J., Ceballos M.T., 2003, MNRAS, 339, 757
- Barger et al. (2003) Barger A.J., et al., 2003, AJ, 126, 632
- Barger et al. (2005) Barger A.J., Cowie L.L., Mushotzky R.F., Yang Y., Wang W.-H., Steffen A.T., Capak P., 2005, AJ, 129, 578
- Bohlin et al. (1978) Bohlin R.C., Savage B.D., Drake J.F., 1978, ApJ, 224, 132
- Boller et al. (2002) Boller Th., et al., 2002, MNRAS, 329, L1
- Caccianiga et al. (2004) Caccianiga A., et al., 2004, A&A, 416, 901
- Ciliegi et al. (1995) Ciliegi P., Elvis M., Wilkes B.J., Boyle B.J., McMahon R.G., Maccacaro T., 1995, MNRAS, 277, 1463
- Coleman, Wu & Weedman (1980) Coleman G.D., Wu C.-C., Weedman D.W., 1980, ApJS, 43, 393
- Comastri et al. (1995) Comastri A., Setti G., Zamorani G., Hasinger G., 1995, A&A, 296, 1
- Crawford et al. (2002) Crawford C.S., Gandhi P., Fabian A.C., Wilman R.J., Johnstone R.M., Barger A.J., Cowie L.L., 2002, MNRAS, 333, 809
- Dewangan et al. (2001) Dewangan G.C., Singh K.P., Jones L.R., McHardy I.M., Mason K.O., Newsam A.M., 2001, MNRAS, 325, 1616
- Dwelly et al. (2005) Dwelly T., Page M.J., Loaring N.S., Mason K.O., McHardy I., Gunn K., Sasseen T., 2005, MNRAS, 360, 1426
- Ferrarese & Merritt (2001) Merritt D. & Ferrarese L., 2001, ApJ, 547, 140
- Franceschini et al. (2003) Franceschini et al., 2003, MNRAS, 343, 1181
- Gallo et al. (2004) Gallo L.C., Tanaka Y., Boller Th., Fabian A.C., Vaughan S., Brandt W.N., 2004, MNRAS, 353, 1064
- Giacconi et al. (2002) Giacconi R., et al., 2002, ApJS, 139, 369
- Gilli, Risaliti & Salvati (1999) Gilli R., Risaliti G., Salvati M., 1999, A&A, 347, 424
- Guedel et al. (2001) Guedel M., et al., 2001, A&A, 365, L336
- Gunn et al. (2001) Gunn K.F., et al., 2001, MNRAS, 324, 305
- Gunn et al. (2003) Gunn K.F., et al., 2003, AN, 324, 105
- Hasinger et al. (1998) Hasinger G., Burg R., Giacconi R., Schmidt M., Trumper J. & Zamorani G., 1998, A&A, 329, 482
- Hasinger et al. (2001) Hasinger G., et al., 2001, A&A, 365, L45
- Hasinger et al. (2005) Hasinger G., Miyaji T., Schmidt M., 2005, A&A, in press, (astro-ph/0506118)
- Helsdon & Ponman (2000) Helsdon S.F. & Ponman T.J., 2000, MNRAS, 315, 356
- Kinkhabwala et al. (2002) Kinkhabwala et al., 2002, ApJ, 575, 732
- Loaring et al. (2005) Loaring N.S., et al., 2005, MNRAS, 362, 1371
- Maccacaro et al. (1988) Maccacaro T., Gioia I.M., Wolter A., Zamorani G., Stocke J.T., 1988, ApJ, 326, 680
- Mainieri et al. (2002) Mainieri V., et al., 2002, A&A, 393, 425
- Mainieri et al. (2005) Mainieri V., et al., 2005, A&A, 437, 805
- Maiolino et al. (2001) Maiolino R., Marconi A., Salvati M., Risaliti G., Severgnini P., Oliva E., La Franca F., & Vanzi L., 2001, A&A, 365, 28
- Mateos et al. (2005a) Mateos S., et al., 2005a, A&A, 433, 855
- Mateos et al. (2005b) Mateos S., et al., 2005b, A&A, 444, 79
- McHardy et al. (1998) McHardy I.M., et al., 1998, MNRAS, 295, 641
- McHardy et al. (2003) McHardy I.M., et al., 2003, MNRAS, 342, 802
- Mittaz et al. (1999) Mittaz J.P.D. et al., 1999, MNRAS, 308, 233
- Moran, Lehnert & Helfand (1999) Moran E.C., Lehnert M.D., Helfand D.J., 1999, ApJ, 526, 649
- Page et al. (1997) Page M.J., Mason K.O., McHardy I.M., Jones L.R., Carrera F.J., 1997, MNRAS, 291, 324
- Page (2001) Page M.J., 2001, MNRAS, 328, 925
- Page, Mittaz & Carrera (2001) Page M.J., Mittaz J.P.D. & Carrera F.J., 2001, MNRAS, 325, 575
- Page et al. (2003) Page M.J., et al., 2003, AN, 324, 101
- Page, Davis & Salvi (2003) Page M.J., Davis S.W. & Salvi N.J., 2003, MNRAS, 343, 1241
- Pappa et al. (2001) Pappa A., Georgantopoulos I., Stewart G.C., Zezas A.L., 2001, MNRAS, 326, 995
- Sako et al. (2001) Sako M., Kahn S.M., Paerels F., Liedahl D.A., 2000, ApJ, 543, L115
- Setti & Woltjer (1989) Setti G. & Woltjer L., 1989, A&A, 224, L21
- Severgnini et al. (2003) Severgnini P., et al., 2003, A&A, 406, 483
- Seymour, McHardy & Gunn (2004) Seymour N., McHardy I.M., & Gunn K.F., 2004, MNRAS, 352, 131
- Silverman et al. (2005) Silverman J.D., et al., 2005, ApJ, 618, 123
- Strüder et al. (2001) Strüder L., et al., 2001, A&A, 365, L18
- Treister et al. (2004) Treister E., et al., 2004, ApJ, 616, 123
- Trentham, Sampson & Banerji (2005) Trentham N., Sampson L. & Banerji M., 2005, MNRAS, 357, 783
- Turner et al. (1997) Turner T.J., George I.M., Nandra K., Mushotzky R.F., 1997, ApJS, 113, 23
- Turner et al. (2001) Turner M.J.L. et al., 2001, A&A, 365, L27