Mid-Infrared Spectral Diagnostics of Nuclear and Extra-Nuclear Regions in Nearby Galaxies
Abstract
Mid-infrared diagnostics are presented for a large portion of the Spitzer Infrared Nearby Galaxies Survey (SINGS) sample plus archival data from the Infrared Space Observatory and the Spitzer Space Telescope. The SINGS dataset includes low- and high-resolution spectral maps and broadband imaging in the infrared for over 160 nuclear and extranuclear regions within 75 nearby galaxies spanning a wide range of morphologies, metallicities, luminosities, and star formation rates. Our main result is that these mid-infrared diagnostics effectively constrain a target’s dominant power source. The combination of a high ionization line index and PAH strength serves as an efficient discriminant between AGN and star-forming nuclei, confirming progress made with ISO spectroscopy on starbursting and ultraluminous infrared galaxies. The sensitivity of Spitzer allows us to probe fainter nuclear and star-forming regions within galaxy disks. We find that both star-forming nuclei and extranuclear regions stand apart from nuclei that are powered by Seyfert or LINER activity. In fact, we identify areas within four diagnostic diagrams containing 90% Seyfert/LINER nuclei or 90% H II regions/H II nuclei. We also find that, compared to starbursting nuclei, extranuclear regions typically separate even further from AGN, especially for low-metallicity extranuclear environments. In addition, instead of the traditional mid-infrared approach to differentiating between AGN and star-forming sources that utilizes relatively weak high-ionization lines, we show that strong low-ionization cooling lines of X-ray dominated regions like [Si II] 34.82 m can alternatively be used as excellent discrimants. Finally, the typical target in this sample shows relatively modest interstellar electron density () and obscuration ( mag for a foreground screen), consistent with a lack of dense clumps of highly obscured gas and dust residing in the emitting regions.
1 Introduction
The goal of this study is to explore whether mid-infrared diagnostics developed for luminous/ultraluminous infrared galaxies and bright Galactic H II regions can be improved upon and extended to the nuclear and extra-nuclear regions within normal and infrared-faint galaxies. A traditional method for characterizing a galaxy’s nuclear power source uses ratios of optical emission lines such as [O II] 3727Å, H 4861Å, [O III] 5007Å, [O I] 6300Å, H 6563Å, [N II] 6584Å and [S II] 6716,6731Å (e.g., Baldwin, Phillips, & Terlevich 1981; Veilleux & Osterbrock 1987; Ho, Filippenko, & Sargent 1997a; Kewley et al. 2001; Kauffmann et al. 2003). A plot of [O III]/H versus [N II]/H, for example, will typically separate Seyferts, LINERs, and starburst nuclei. Since nuclei are often heavily enshrouded by dust, especially in luminous and ultraluminous infrared galaxies (LIRGs and ULIRGs), an important limitation to galaxy optical diagnostics is the effect of extinction. In anticipation of the data stream from space-based infrared platforms, early theoretical work with photoionization models showed that infrared ionic fine structure line ratios could profitably enable astronomers to approach galaxy classification from a new perspective (e.g., Voit 1992; Spinoglio & Malkan 1992). The advent of sensitive infrared line data from the Infrared Space Observatory was an important first step to peering more deeply into buried nuclear sources (Genzel et al. 1998; Laurent et al. 2000; Sturm et al. 2002; Peeters, Spoon, & Tielens 2004). Genzel and collaborators were the first to show that ionization-sensitive indices based on mid-infrared line ratios correlate with the strength of polycyclic aromatic hydrocarbon (PAH) emission features. AGN in particular show weak PAH and large ratios of high-to-low ionization line emission. Interestingly, while Genzel et al. found that 70-80% of their ULIRG sample is mainly powered by starburst activity, the percentage appears to drop for higher luminosity ULIRGs (e.g., Veilleux, Sanders, & Kim 1999, but see also Farrah et al. 2003). Taniguchi et al. (1999) and Lutz, Veilleux, & Genzel (1999) suggest that optical and infrared classifications agree if the nuclei of LINER-like ULIRGs are in fact dominated by shocks driven by powerful supernova winds. Mid-infrared lines observed by ISO were also used to probe the physical characteristics and evolution of purely starbursting nuclei (Thornley et al. 2000; Verma et al. 2003) and Galactic H II regions (Vermeij & van der Hulst 2002; Giveon et al. 2002). An important result stemming from these efforts is that stellar aging effects appear to result in H II regions generally having higher excitations than starbursting nuclei.
The unprecedented sensitivity and angular resolution afforded by the Spitzer Space Telescope allow an even more detailed view into the nature of galaxy nuclei (e.g., Armus et al. 2004; Smith et al. 2004). SINGS takes full advantage of Spitzer’s capabilities by executing a comprehensive, multi-wavelength survey of 75 nearby galaxies spanning a wide range of morphologies, metallicities, luminosities, and star formation activity levels (Kennicutt et al. 2003). The sensitivity of Spitzer coupled with the proximity of the SINGS sample allows dwarf galaxy systems fainter than to be spectroscopically probed in the infrared for the first time. In addition, prior to Spitzer the only individual extragalactic H II regions that were detectable with infrared spectroscopy resided in the Local Group (e.g., Giveon et al. 2002; Vermeij et al. 2002). In contrast, SINGS provides infrared spectroscopic data for nearly 100 extragalactic H II regions, residing in systems as near as Local Group members to galaxies as far as 25 Mpc. The SINGS dataset thus samples a wider range of environments than previously observed with infrared spectroscopy. This diversity in the SINGS sample provides a huge range for exploring physical parameters with mid-infrared spectral diagnostics. The high ionization lines historically used in such diagnostics, such as [O IV] 25.89 m and [Ne V] 14.32 m, are relatively weak and can be difficult to detect in lower luminosity systems. Fortunately, high ionization lines are not the only route to determining whether a galaxy harbors a strong AGN. Similar to how the [O I] 6300Å and [O I] 63 m lines are AGN diagnostics (e.g., Dale et al. 2004a), we show below the utility of using the comparatively bright [Si II] 34.82 m mid-infrared line as another effective tool for deciphering a galaxy’s power source.
2 The Sample
2.1 Galaxy Nuclei
The sample of nuclear targets analyzed in this study derive from the SINGS Third Data Release. These 50 nuclei come from a wide range of environments and galaxies: low-metallicity dwarfs; quiescent ellipticals; dusty grand design spirals; Seyferts, LINERs, and starbursting nuclei of normal galaxies; and systems within the Local and M 81 groups (see Kennicutt et al. 2003).
2.2 Extra-Nuclear Regions
The 26 extranuclear sources studied in this work also come from the SINGS Third Data Release. These targets stem from the original set of 39 optically-selected sources listed by Kennicutt et al. (2003). The optically-selected OB/H II regions cover a large range of metallicity (0.1-3 ), extinction-corrected ionizing luminosity (10 photons s-1), extinction ( mag), radiation field intensity (ionization parameter to ; Habing 1968), ionizing stellar temperature ( kK), and local H2/H I ratio as inferred from CO (0.1 to 10). Additional extranuclear targets for the SINGS project have since been identified, based on their infrared properties, but their observations necessarily came later than the observations of the optically-selected targets. Those “Second Look” data will be the focus of a future paper.
3 The Data
The full SINGS observing program and the data processing are described by Kennicutt et al. (2003), Smith et al. (2004), and Dale et al. (2005). Here we briefly summarize the spectral observations and data processing relevant to this paper.
3.1 Spitzer Infrared Spectroscopy Observations and Data Processing
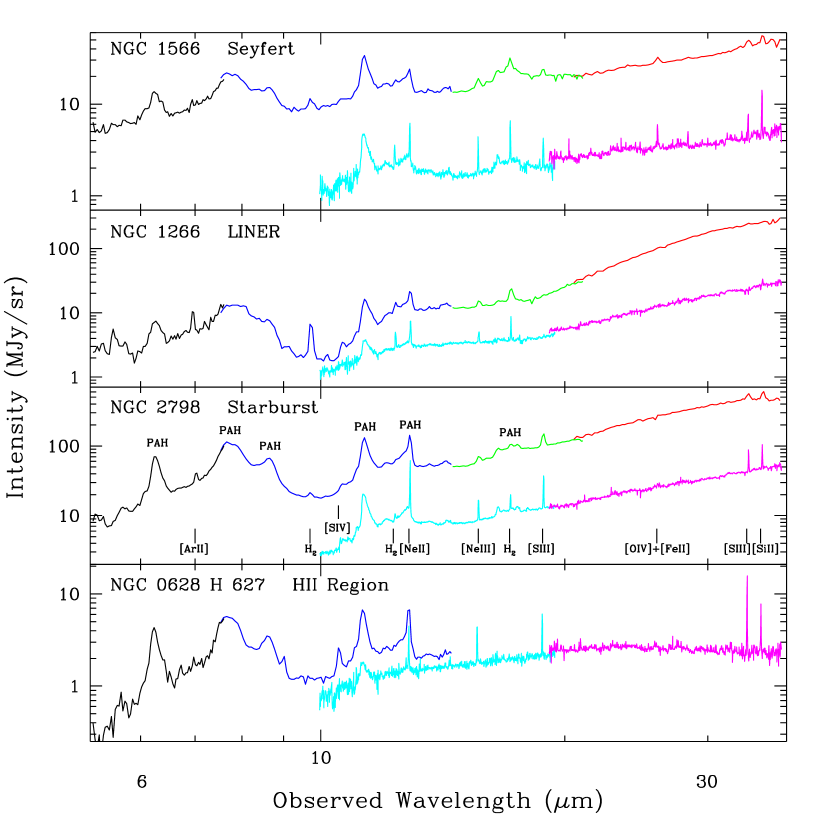
High-resolution spectroscopy () was obtained in the Short-High (10-19 m) and Long-High (19-37 m) modules, and low-resolution spectroscopy () was obtained in the Short-Low (5-14 m) and Long-Low (14-38 m) modules (Houck et al. 2004a). Figure 1 shows example spectra for a variety of sources (Long-Low data are not used elsewhere in this work). Nuclei were generally mapped with a 35 grid (Short-High and Long-High) and a 118 grid (Short-Low), utilizing half-slit width and half-slit length steps. Extra-nuclear targets were observed with a similar scheme but with a 19 Short-Low grid. For a subset of nine sources with extended circumnuclear star formation we obtained slightly larger (610) Short-High nuclear maps. Owing to the different angular sizes subtended by the instruments, the resulting maps are approximately 57″31″ and 57″18″ in Short-Low (nuclear and extra-nuclear, respectively), 45″33″ in Long-High, and 23″15″ in Short-High (the 10 expanded Short-High nuclear maps are 40″28″). All integrations are 60 s per pointing, except the Short-Low nuclear maps are 14 s per pointing. The effective integrations are longer since each location was covered 2-4 times.
The individual data files for a given spectral map were assembled into spectral cubes using the software CUBISM (Kennicutt et al. 2003; Smith et al. 2006, in preparation). The cube input data were pre-processed using version S12.0 of the Spitzer Science Center pipeline. Various post-processing steps within CUBISM are described by Smith et al. (2004). Short-Low sky subtraction was enabled via the extended off-source wings of the Short-Low module (and occasionally using spatially- and temporally-proximate data from the archive when our off-source wings do not extend to the sky). Several cross-checks on the flux calibration were made between Short-Low, Short-High, Long-Low, Long-High, MIPS, and IRAC data. The absolute flux calibration uncertainty for the spectral data is estimated to be 25%; the uncertainy in line flux ratios is 10%.
Though the Short-High, Long-High, and Short-Low cubes all span different solid angles, the same matched extraction apertures were used for all cubes: one-dimensional spectra were extracted from the three-dimensional data using 23″15″ apertures. Furthermore, the extraction apertures are centered on the optically-derived coordinates listed by Kennicutt et al. (2003); the optical coordinates generally coincide with the infrared emission peak. Emission line and PAH feature fluxes and equivalent widths are derived from continuum-subtracted Gaussian fits to the lines and first- or second-order polynomial fits to the continua.
3.2 Archival Spectroscopy
ISO-SWS and Spitzer IRS line fluxes are drawn from the literature for a wide variety of sources including Galactic, Magellanic Cloud, and Local Group H II regions (Vermeij et al. 2002; Giveon et al. 2002; Peeters et al. 2002), and starburst and active galaxies (Genzel et al. 1998; Sturm et al. 2002; Verma et al. 2003; Armus et al. 2004; Peeters, Spoon, & Tielens 2004; Weedman et al. 2005; Haas et al. 2005). Equivalent widths of the 6.2 m PAH feature were extracted from archival ISO-PHOT and Spitzer IRS data, when available. Note that, for a given source, only data from Spitzer or only data from ISO are used; cross-observatory data are not used in this analysis. The fields-of-view of the ISO-PHOT and ISO-SWS apertures (respectively 24″24″ and 14″20″ to 20″30″) provide a reasonable match to the 23″15″ extraction apertures described in § 3.1.
3.3 Spitzer Broadband Imaging: 24 m
The SINGS project did not obtain nearby sky observations in HighRes mode, so if the underlying hot dust continuum emission is detected, the foreground/background continuum is not subtracted. SINGS IRS HighRes spectroscopy is designed to measure line fluxes and thus line equivalent width measures via HighRes are biased by the un-subtracted sky emission. On the other hand, the SINGS program includes extensive MIPS (Rieke et al. 2004) 24 m broadband imaging of all galaxies; the 24 m data can be used to normalize line fluxes. Sky-subtracted MIPS 24 m fluxes are extracted from aperture cutouts matched to the Short-High field-of-view (§ 3.1). See Kennicutt et al. (2003) and Dale et al. (2005) for further details of the SINGS broadband imaging.
3.4 Optical Spectroscopy Observations and Data Processing
Optical spectrophotometry has been obtained for the SINGS project at the Steward Observatory Bok 2.3 m and the CTIO 1.5 m telescopes (Moustakas & Kennicutt 2006). A suite of spectral drift scans, centered on the nuclei, were taken to spatially map the various regions covered with the IRS spectroscopy program (see Kennicutt et al. 2003 for more details). The optical spectroscopy has spectral resolution of 8Å and covers 3600-7000Å so that the primary nebular emission lines can be studied (e.g., [O II] 3727Å, H 4861Å, [O III] 5007Å, H 6563Å, [N II] 6584Å). The SINGS optical spectroscopy and emission line measurements (fluxes, equivalent widths, metallicities, etc.) will be presented by Moustakas et al. (2006, in preparation).
This work utilizes optical spectral drift scans integrated over the central 20″20″ regions, approximately matching the 23″15″ circumnuclear regions over which the infrared line and PAH feature fluxes are extracted (see § 3.1).
4 Measured Quantities
4.1 High-Resolution Infrared Spectroscopy: Emission Lines
Several forbidden lines are quite prominent in many of the SINGS nuclear and extra-nuclear high resolution spectra ([Ne II]12.81 m, [Ne III]15.56 m, [S III]18.71 m, [S III]33.48 m, and [Si II]34.82 m) along with a few other higher ionization lines that are occasionally observed ([S IV]10.51 m, [Ne V]14.32 m, and [O IV]25.89 m; Figure 1). All these lines except [Si II]34.82 m are nebular lines from hydrogen gas ionized regions; [Si II]34.82 m comes from a wider variety of regions, including both ionized gas and warm atomic gas such as photodissociation regions and X-ray dominated regions (e.g., Hollenbach & Tielens 1999). A series of interstellar molecular hydrogen lines are also detected in the SINGS spectra; these are explored in a separate paper (Roussel et al. 2006, in preparation). The line fluxes utilized in this work are listed in Tables 1 and 2. Eight galaxies from the SINGS Third Data Release are not listed in Table 1 because their nuclear regions were too faint to be observed (or detected if observed).
4.2 Low-Resolution Infrared Spectroscopy: The 6.2 m PAH Feature
The strength of a PAH feature depends on a complex combination of several parameters of the interstellar medium, some of which are interlinked: metallicity, dust column density, the distribution of sizes and ionization states in the dust grain population, and the intensity and hardness of the interstellar radiation field (e.g., Cesarsky et al. 1996; Thuan et al. 1999; Sturm et al. 2000; Li & Draine 2001; Draine & Li 2001; Houck et al. 2004b; Galliano et al. 2005; Engelbracht et al. 2005; Madden et al. 2006; Wu et al. 2006). Due to this sensitivity to the properties of the interstellar medium, PAH features in the mid-infrared have been used to characterize the physical state of a system. Previous efforts have utilized the 6.2 m feature (Laurent et al. 2000; Peeters, Spoon, & Tielens 2004; Weedman et al. 2005), the 7.7 m feature (Genzel et al. 1998), or a combination of several PAH features (e.g., Verstraete et al. 2001; Tran et al. 2001; Peeters et al. 2002; Förster Schreiber et al. 2004; Armus et al. 2004; Peeters et al. 2004; Madden et al. 2006). For this work we concentrate on diagnostics that utilize the 6.2 m feature. The 6.2 m feature is the only strong infrared signature of PAHs not blended with an emission line or absorption trough, not near the wavelength edges of an IRS low resolution module, and for which the blue and red sides of the “continuum” are easy to define. The equivalent widths of the 6.2 m feature are listed in Tables 1 and 2. The equivalent width is used in our diagnostics since the continuum at 6.2 m may contain emission from hot dust heated either by star formation or an AGN, in addition to a fractional contribution from stellar emission; the 6.2 m equivalent width is (indirectly) sensitive to the presence of an AGN.
5 Results
5.1 Optical Classifications of Nuclei
Not all of the SINGS galaxies have an optical nuclear classification in the literature (e.g., Seyfert, LINER, starburst, etc). Moreover, online databases such as NED111NASA/IPAC Extragalactic Database provide a heterogeneous source for such classifications. Thus we turn to our own optical spectroscopy. Figure 2 displays a traditional diagnostic diagram (e.g., Baldwin, Phillips, & Terlevich 1981) using optical spectroscopy and 20″20″ apertures for SINGS galaxy nuclei. Note that such diagnostics were designed with ratios of lines closely spaced in wavelength to minimize the effects of extinction. Filled (open) circles in Figure 2 mark galaxies for which the literature indicates a Seyfert (LINER) nucleus; data points without circles in this diagram represent galaxies without a LINER or Seyfert classification in the literature. As alluded to in § 1, the LINER classification can be complicated. Similar to what is observed for Seyferts, the optical properties of LINERs are consistent with a hard power-law spectrum. But LINER-type spectra can also be produced via winds, shocks, and cooling flows (Kauffmann et al. 2003). To further complicate the picture, “transition” objects are thought to be LINER or Seyfert galaxies with substantial contributions from normal star formation (e.g., Ho, Filippenko, & Sargent 1993; González Delgado et al. 2004).
The dotted lines delineate typical starburst/AGN/LINER boundaries: [O III]5007/H and [N II]6583/H (e.g., Veilleux & Osterbrock 1987; Armus, Heckman, & Miley 1989). The long-dashed curve traces the theoretical starburst/AGN boundary of Kewley et al. (2001), marking the maximum position in this diagram that can be obtained by pure photoionization. Objects lying above this curve require an additional power source such as an AGN or shocks; objects lying below this curve may still contain an AGN responsible for up to 30% of the emission line flux ratios. The short-dashed curve traces an empirical starburst/AGN boundary based on data from tens of thousands of Sloan Digital Sky Survey galaxies (Kauffmann et al. 2003). The Kauffman et al. curve aims to define a boundary below which no galaxies contain an AGN. Objects lying in between the Kewley et al. and the Kauffmann et al. curves are likely to be composite AGN/starburst objects but still dominated by star formation. It is evident that the classification information available from the literature is insufficient or incomplete for a handful of SINGS nuclei; there is overall good agreement between the literature and our classifications, with a few exceptions. The literature does not indicate that the nuclei of NGC 1291 contains LINER or Seyfert activity, whereas our spectroscopic data place it squarely in the LINER category. On the other hand, NED lists NGC 1097, NGC 4321, and NGC 4552 as having LINER or Seyfert nuclei, yet our optical line ratios suggest they are star-forming galaxies. NGC 3198, NGC 3621, and NGC4826 appear to lie in a transitional regime between the starburst and LINER/Seyfert regions.222Similar results are found using [S II] 6716,6731Å and [O I] 6300Å data in place of [N II] 6584Å (e.g., Kewley et al. 2001).
Using the H/H ratio extracted from our optical spectra and a screen model for the dust distribution within a galaxy, the SINGS nuclei show modest attenuations, mag with a dispersion of 1.0 mag and a maximum of mag for NGC 1266. No sources appear to be heavily buried in the optical so presumably none of the classifications are skewed by large amounts of dust.333The exception is NGC 1377, a deeply obscured system for which the optical data are likely probing only outer layer (foreground) emission (Roussel et al. 2003, 2006). This result is consistent with the lack of deeply buried objects in comparisons of SINGS H and Spitzer 24 m data (e.g., Calzetti et al. 2005). However, as described above, there may be a few transitional objects for which the nuclear classifications are difficult to interpret in the optical. The main reason behind the analysis in this section is to provide classifications for sources that do not yet have them from the literature. Our goal is not to carry out a detailed analysis of the relative merits of classifying in the optical versus in the infrared, primarily since the SINGS sample is not optimally suited for such a test. In the next section we turn to exploring new and existing infrared diagnostics.
5.2 Infrared Spectral Diagnostics of Nuclei and Extra-Nuclear Regions
5.2.1 Emission Line Ratios and PAH Strength
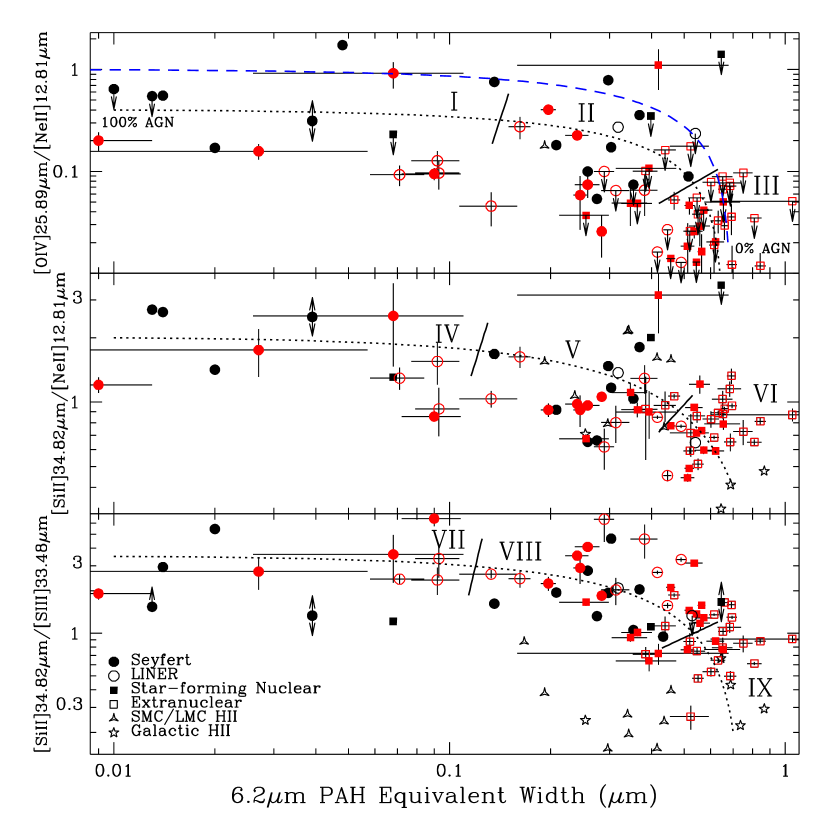
At least 54.9 eV is required to remove an electron from doubly-ionized oxygen. On the other hand, ionizing neutral neon “only” requires 21.6 eV. Compared to 21.6 eV photons, 54.9 eV photons are far more likely to stem from accretion-powered disks than star formation (e.g., OB stars; Smith et al. 2004), and thus the ratio of [O IV]25.89 m and [Ne II]12.81 m depends on the type of source dominating the energetics of the interstellar medium. Furthermore, studies show that PAH features are quite prominent throughout much of the interstellar medium except for regions characterized by exceptionally hard radiation fields such as those that arise in AGN and the cores of H II regions (Cesarsky et al. 1996; Sturm et al. 2000). A mid-infrared diagnostic diagram first put forth by Genzel et al. (1998), and later explored by Peeters, Spoon, & Tielens (2004), plots the emission line ratio [O IV]25.89 m/[Ne II]12.81 m versus the strength of a mid-infrared PAH feature. In such plots AGN sources show enhanced [O IV]25.89 m emission and comparatively weak PAH feature strength. However, those two studies focussed on AGN-dominated, ULIRG, and starburst systems. The upper panel of Figure 3 uses the 6.2 m PAH feature and the emission line ratio [O IV]25.89 m/[Ne II]12.81 m in a similar mid-infrared diagnostic diagram, but one that incorporates “normal” (starbursting/star-forming) nuclei and H II regions—the sensitivity of Spitzer allows us to probe to far fainter levels than heretofore possible.444Additional high ionization line possibilities include [Ne V]14.32 m and [S IV]10.51 m, but these are less frequently detected than [O IV]25.89 m in SINGS spectra. As expected, normal nuclei and H II regions extend the previously-observed trend: lower-luminosity star-forming nuclei and H II regions exhibit comparatively large 6.2 m equivalent widths and relatively low ratios of [O IV]25.89 m/[Ne II]12.81 m, indicating strong contributions from [Ne II]12.81 m cooling of H II regions and their PAH-rich photodissociation region surroundings, and negligible emission from AGN.
High ionization lines like [O IV]25.89 m are somewhat difficult to detect in many SINGS sources. Two alternative diagnostic diagrams are also provided in Figure 3. Both the middle and lower panels involve the more easily detectable [Si II]34.82 m line, which has an ionization potential of 8.15 eV. The normalization for the [Si II]34.82 m line in the middle and lower panels utilizes strong mid-infrared lines with similar ionization potentials: [Ne II]12.81 m (21.6 eV) and [S III]33.48 m (23.3 eV). An advantage to using [Ne II]12.81 m as the normalization is that it lies in the much less noisy Short-High module of IRS. Conversely, the [S III]33.48 m line lies in the same Long-High module as the [Si II]34.82 m line, which can improve observing efficiency and minimize cross-module uncertainties involving calibration and aperture matching. In addition, the short wavelength baseline between the [Si II]34.82 m [S III]33.48 m lines minimizes the effects of extinction.
Why are similar trends seen in the three panels? The answer may lie in the physics of X-ray dominated regions. As pointed out by Maloney, Hollenbach, & Tielens (1996), the [Si II]34.82 m line is a strong coolant of X-ray irradiated gas. In X-ray dominated regions around AGN, the [Si II] emission dominates that from the comparatively small H II-like regions surrounding the hard-spectrum source. Moreover, X-ray dominated regions can be quite large since hard X-ray photons penetrate large column densities, and the conversion of X-ray energy to infrared continuum and line emission can be very efficient. Maloney, Hollenbach, & Tielens (1996) predict that [Si II]34.82 m, [O I]63 m, [C II]158 m, and [C I]609 m are the top four cooling lines within X-ray dominated regions, with [Si II]34.82 m having an amplitude 1-10% that of the far-infrared luminosity for an extremely large range of physical conditions.
An argument based on interstellar density provides another possibility for the high [Si II]34.82 m/[Ne II]12.81 m and SiII 34.82 m/[S III]33.48 m ratios in AGN. Kaufman, Wolfire, & Hollenbach (2006) show that the ratio [Si II](PDR)/[Si II](H II) increases with increasing density. In fact, for low density H II regions most of the [Si II] comes from the H II region and not the surrounding photodissociation region. Moreover, Meijerink & Spaans (2005) show that the ratio [Si II](XDR)/[Si II](PDR) also increases with increasing density. AGN may have their emitting gas at higher densities than typically found in starbursts and normal galaxies, leading to increased [Si II]34.82 m/[Ne II]12.81 m and SiII 34.82 m/[S III]33.48 m ratios. In other words, the prominent [Si II]34.82 m line for AGN sources may be due to strong [Si II] cooling of X-ray dominated regions or enhanced [Si II] emission from the surrounding dense photodissociation regions.
A third scenario for enhanced [Si II]34.82 m in AGN involves the extent to which silicon is depleted onto dust grains. Heavy elements such as Si, Mg, and Fe may be returned to the gas phase by dust destruction (e.g., sputtering) in regions subject to strong shocks caused by stellar winds, starbursts, and AGN activity. So perhaps (gas phase) silicon lines are stronger in active galaxies due to this effect.
If the strong [Si II]34.82 m emission is due to the cooling of X-ray dominated regions, it should be noted that relatively strong low-ionization line emission (e.g., [O I]6300Å and [O I]63 m) has previously been observed emanating from the large “partially-ionized regions” surrounding AGN and infrared-bright galaxies (Veilleux & Osterbrock 1987; Armus, Heckman, & Miley 1989; Veilleux 1991; Spinoglio & Malkan 1992; Osterbrock 1993; Dale et al. 2004a). Hence, strong low-ionization line emission from AGN is not a new concept. We take advantage of this concept to present new techniques for distinguishing between AGN sources and star-forming regions. These techniques rely on an easily-detectable, prominent cooling line of a low-ionization species associated with X-ray dominated regions, the dense interstellar material illuminated by power-law radiation fields.
The regions of Figure 3 where Seyferts/LINERs/starbursts mix are quite large, though the bottom panel perhaps shows a cleaner separation (less mixing) between Seyferts+LINERs and star-forming regions; only the top left and bottom right extremes allow for a clean separation between classifications. Short solid lines roughly perpendicular to the dotted AGN/star-forming curves delineate three regions in the panels of Figure 3. The boundaries are:
| (1) | |||||
| (2) | |||||
| (3) | |||||
| (4) | |||||
| (5) | |||||
| (6) |
The population statistics for these regions, provided in Table 4, show that Regions [I+IV+VII] and [III+VI+IX] are respectively representative (at the 90% level) of Seyferts/LINERs and star-forming systems. Regions [II+V+VIII], on the other hand, contain a mix of classifications and thus represent transition regions—either the source classifications in this region are ambiguous or the region simply contains a more heterogeneous mixture of pure types. Seyfert nuclei could shift toward the location of star-forming nuclei due to aperture effects—though the same solid angles are used for extracting the line data, the range of distances in the sample leads to a range in physical apertures. Conversely, some star-forming nuclei exhibit relatively large line ratios and small PAH equivalent widths in Figure 3. Perhaps a fraction of the star-forming regions contain significant numbers of Wolf Rayet stars, leading to enhanced [O IV] emission (e.g., Schaerer & Stasiǹska 1999). And maybe a decreased PAH equivalent width results from a relatively low ratio of photodissociation region to H II region contributions (Laurent et al. 2000).
The dotted lines in Figure 3 represent a variable mix of an AGN nucleus and a “pure” star-forming region. The anchors for these mixing models are the following:
The dashed line in the upper panel of Figure 3 shows the approximate mixing model of Genzel et al. (1998; their Figure 5), obtained after empirically deriving a relation between their 7.7 m PAH ‘strength’ (line-to-continuum ratio) and the 6.2 m PAH equivalent width. Many of the high ionization line data presented by Genzel et al. (1998) were upper limits, so it is unsurprising that their original curve lies above our curve (though the discrepancy may also lie in small number statistics).
5.2.2 Line Ratios of Different Ionization States of the Same Element
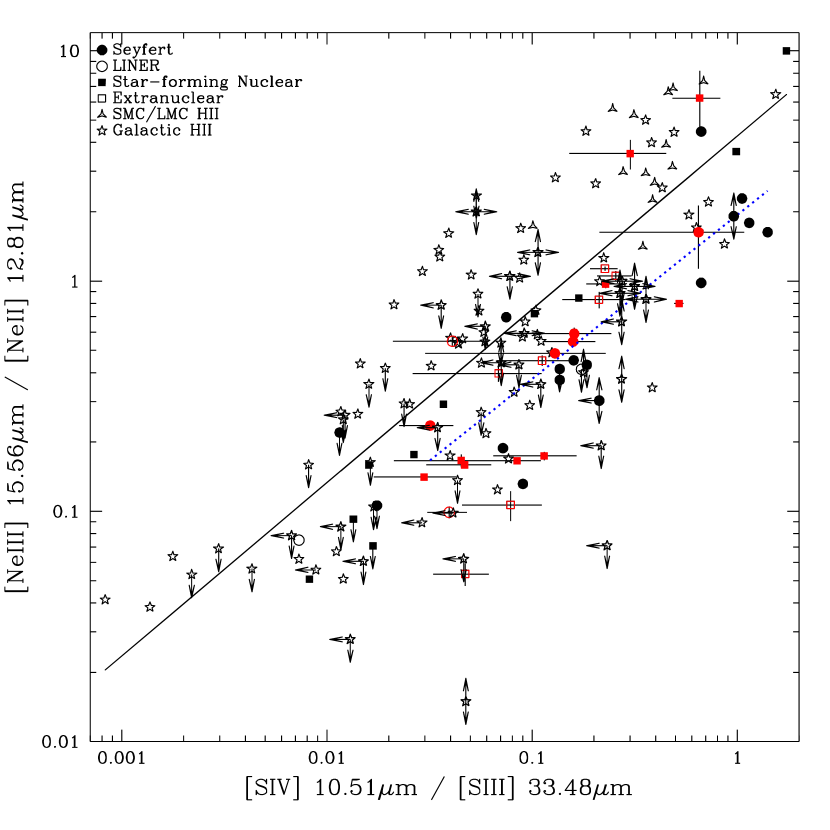
Figure 4 plots a ratio of doubly- to singly-ionized neon as a function of a ratio of triply- to doubly-ionized sulfur (see also Verma et al. 2003). Many of the data points in this plot are for Galactic H II regions (Vermeij et al. 2002; Giveon et al. 2002; Peeters et al. 2002; see § 3.2). Clearly the neon excitation tracks the sulfur excitation. To first order, there does not appear to be any sequence in the distribution according to source classification (Seyfert, starburst, H II, etc). However, the low-metallicity H II regions from the Magellanic Clouds are preferentially in the high excitation, upper righthand corner of the diagram. Presumably the diminished line blanketing for low-metallicity sources results in a harder radiation field and thus higher excitations (see Genzel & Cesarsky 2000; Martín-Hernández et al. 2002; Madden et al. 2006). In addition, AGN sources show somewhat lower [Ne III]15.6 m/[Ne II]12.81 m ratios than exhibited by star-forming sources, and the locus of the AGN detections lie at slightly higher values of [S IV]10.51 m/[S III]33.48 m. The dotted and solid curves show linear fits to the Seyfert and star-forming sources, and respectively have slopes of 0.71[0.12] and 0.75[0.06].
5.2.3 A Neon, Sulfur, and Silicon Diagnostic
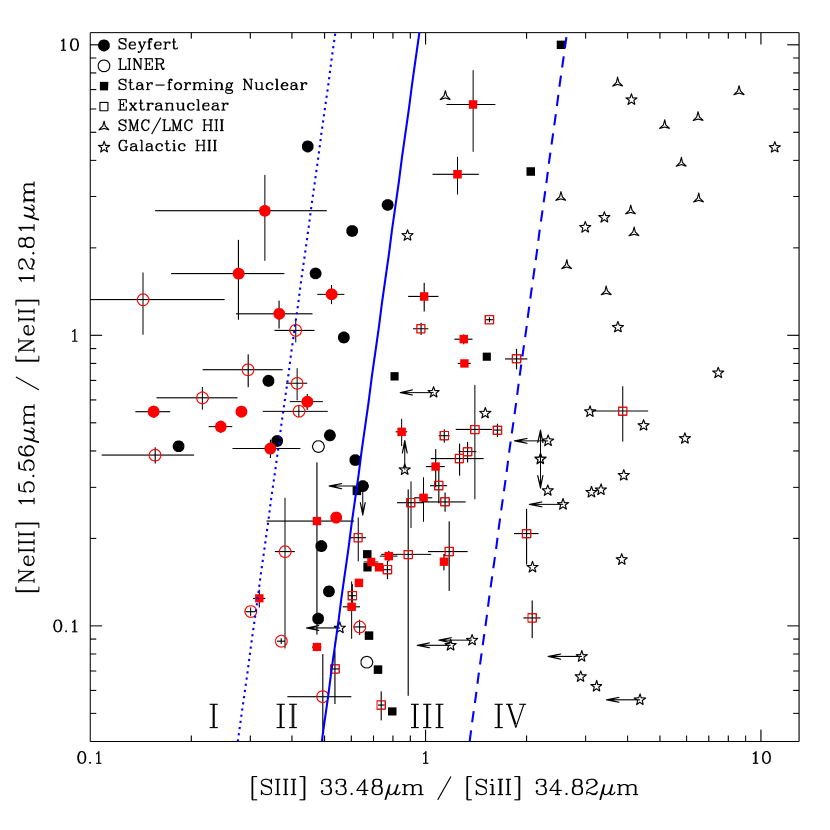
If the neon excitation is plotted as a function of [S III]33.48 m/[Si II]34.82 m (Figure 5), a more obvious separation of the star-forming and AGN-powered data points is observed. Not only do the low-metallicity Magellanic Cloud regions exhibit a higher neon excitation, nearly all of the “pure star-forming” nuclei and extra-nuclear regions show relatively elevated ratios in [S III]33.48 m/[Si II]34.82 m (see also Figure 3). Note in addition that many of the filled squares representing starbursting/star-forming nuclei are located between the H II regions and the AGN. Table 5 quantifies the source type fractions within each of the four regions delineated by the lines drawn in Figure 5. The boundaries are defined by curves with the same slope but differing offsets:
| (7) |
where [3.3,1.2,2.5] for the lines demarcating Regions [III,IIIII,IIIIV]. The numbers provided in Table 5 can be used to determine the statistical reliability of a classification for a galaxy randomly drawn from a mid-infrared line survey. For example, if a galaxy appears in Region III or Region IV, it should be classified as a star-forming system with a 1 confidence interval of 84-93% and 91-98%, respectively. Likewise, a galaxy residing in Region I or Region II should be classified as AGN-powered with a 1 confidence interval of 83-97% and 73-88%, respectively.
These results can be partially understood in the context of the cooling line physics introduced above. The [Si II]34.82 m line is a significant coolant of X-ray ionized regions or dense photodissociation regions (Hollenbach & Tielens 1999), whereas the [S III]33.48 m line is a strong marker of H II regions. In other words, extra-nuclear regions and star-forming nuclei will show strong signatures of the Strömgren sphere coolant [S III]33.48 m, while AGN and their associated X-ray dominated regions or dense photodissociation regions will exhibit relatively strong [Si II]34.82 m emission in analogy to the increased strength of [O I] 6300Å emission in AGN (e.g., Veilleux & Osterbrock 1987). In addition, the fraction of photodissociation regions falling within each beam will play a role in the line ratios. The data for Magellanic Cloud and Galactic H II regions stem from smaller physical apertures and thus are likely to have fractionally higher contributions from Strömgren spheres than photodissociation regions.
Metallicity may be a factor as well. Since the central regions of galaxies typically are more abundant in heavy metals (Pagel & Edmunds 1981; McCall 1982; Vila-Costas & Edmunds 1992; Pilyugin & Ferrini 1998; Henry & Worthey 1999), and as explained above a lower metallicity can lead to harder radiation fields and thus enhanced high-ionization-to-low-ionization line ratios, it is possible that this AGNH II nucleusH II region sequencing along the [S III]33.48 m/[Si II]34.82 m axis is affected by metallicity. However, the lower metallicity Magellanic Cloud data are not substantially to the right of the Galactic H II region data, so the effect is not solely due to metallicity. Alternatively, perhaps some of the star-forming nuclei have contributions from undetected weak AGN and thus are not “pure” star-forming nuclei, resulting in a location for star-forming nuclei on this diagram between AGN and H II regions.
5.2.4 Density Diagnostics
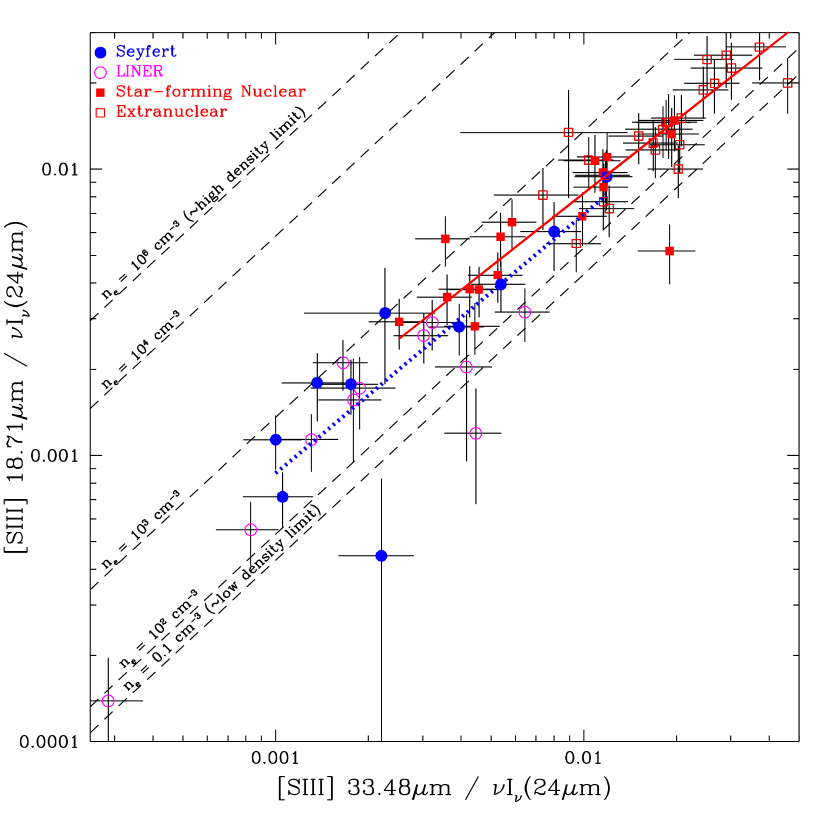
The average line ratio of [S III]18.71 m-to-[S III]33.48 m for the SINGS sample is 0.82 with a 1 dispersion of 0.27. This ratio implies an interstellar electron density of for the ″15″ nuclear and extranuclear regions of SINGS galaxies. The average density is calculated using electron collision strengths from Tayal & Gupta (1999) and excluding the effects of differential extinction at these mid-infrared wavelengths (which is shown in Section 5.1 to be relatively small at optical wavelengths). This density on kiloparsec scales is typical of starburst/LINER/Seyfert galaxies (Kewley et al. 2001), but lower than the found for high surface brightness H II regions using small apertures uncontaminated by the surrounding neutral interstellar medium and lower density H II regions (e.g., Wang et al. 2004). A visual way to explore this doubly-ionized sulfur line ratio is portrayed in Figure 6 using the aperture-matched 24 m flux as a normalization for the line fluxes. The set of dashed lines represent different interstellar electron densities. The correlation in Figure 6 extends over two orders of magnitude in the line-to-continuum ratios and encompasses both AGN-dominated and star-formation-dominated sources; a non-parametric ranking analysis indicates a global correlation at the level. Linear fits to the two separate star-forming and Seyfert populations emphasize that, though the trends for the two populations are similar, the nuclei with Seyfert characteristics (dotted line; slope 0.910.22) differ along the diagonal from the starbursting nuclei and the H II regions (solid line; slope 0.850.05). Star-forming sources show more pronounced [S III]33.48 m-to-continuum ratios compared to Seyferts and LINERs, consistent with the notion that [S III]33.48 m is an important coolant of H II regions. In addition, we are seeing the effects of continuum dilution in the line-to-continuum ratio for Seyferts and LINERs, sources for which hot dust emission is pronounced in the mid-infrared and thus the line-to-continuum ratios are suppressed (e.g., Laurent et al. 2000; Dale et al. 2001; Xu et al. 2001; Siebenmorgen et al. 2004). Finally, similar to what is seen in Figures 3 and 5, but perhaps not as prominently, the data in Figure 6 suggest that the H II regions (open squares) occupy a different portion of the diagram than star-forming nuclei (filled squares). H II regions have higher line-to-continuum ratios than star-forming nuclei, which in turn have higher ratios than Seyferts and LINERs.
6 Summary
We have presented mid-infrared diagnostic diagrams for a large portion of the SINGS sample supplemented by archival ISO and Spitzer data. A portion of our work solidifies and extends previous ISO-based mid-infrared work to lower luminosity normal galaxy nuclei and H II regions using the Spitzer Space Telescope. We also present new diagnostics that effectively constrain a galaxy’s dominant power source. The power of the diagnostic diagrams of Genzel et al. (1998; see also Peeters, Spoon, & Tielens 2004) for distinguishing between AGN and star-forming sources in dusty ULIRGs is that mid-infrared lines and PAH features are much less affected by extinction than their optical counterparts in a traditional diagnostic diagram. Unlike diagrams put forth by Genzel et al., which rely on detecting relatively weak high-ionization lines like [O IV] 25.89 m and [Ne V] 14.32 m, we provide a new diagnostic that utilizes a strong low-ionization line. The advantage of using a line ratio like [Si II]/[Ne II] is that singly-ionized silicon and neon respectively have ionization potentials of only 8.15 and 12.8 eV, so they can both be observed over a large range of physical conditions. This is similar in concept to previous efforts that have taken advantage of [O I] lines (e.g., at 6300 Å or 63 m) that are coolants of the X-ray dominated regions (or dense photodissociation regions) surrounding AGN. In plots of [O IV]/[Ne II], [Si II]/[Ne II], and [Si II]/[S III] vs. 6.2 m PAH equivalent width, we identify regions where 90% of the sources are Seyfert or LINER. Likewise, additional regions in all three plots show populations comprised of more than 90% H II regions or star-forming nuclei.
Another useful mid-infrared diagnostic is [Ne III] 15.56 m/[Ne II] 12.81 m vs. [S III] 33.48 m/[Si II] 34.82 m. This plot tracks the excitation power of the radiation field on one axis, while the other axis is a relative measure of the cooling of H II regions and X-ray dominated regions (or dense photodissociation regions). Similar to what is found for the diagnostics mentioned above, both starbursting nuclei and extranuclear regions stand apart from nuclei that are powered by accretion-powered disks. Moreover, compared to starbursting nuclei, extranuclear regions typically separate even further from Seyfert nuclei, especially for low-metallicity environments. Presumably this extranuclearnuclear separation occurs since extranuclear regions are cleaner representatives of H II regions than starburst nuclei, because their stellar populations and interstellar medium structure are less complex. Extranuclear regions more likely contain younger stellar populations since they trace a single burst, as opposed to the average of multiple star formation episodes for nuclei (e.g., Dale et al. 2004b). Finally, we note that it is difficult to clearly distinguish between pure Seyfert and pure LINER sources using these diagnostics.
The line ratio [S III] 18.71 m/[S III] 33.48 m yields an average interstellar electron density of for the ″15″ nuclear and extranuclear regions of SINGS galaxies. This density is much closer (in log space) to the theoretical low density limit of Tayal & Gupta (1999) than their high density limit, and in fact the data for several sources are consistent with the low density limiting value. In addition to the interstellar gas densities being unremarkable, there are no SINGS sources sufficiently obscured by dust such that optical and infrared diagnostics provide obviously discrepant classifications of the energy source. This is not surprising, however, since our nuclei exhibit modest extinctions, mag, and normal star-forming galaxy nuclei in general show mag (Ho, Filippenko, & Sargent 1997b). This relative transparency means the SINGS sample is not ideally suited for a detailed comparison of the relative merits of optical and infrared classifications. However, the diverse SINGS sample of nuclear and extranuclear regions provides an enormous range of physical parameters, and this has proved critical in developing the mid-infrared diagnostics in this paper.
References
- (1) Armus, L., Heckman, T.M., & Miley, G.K. 1989, ApJ, 347, 727
- (2) Armus, L. et al. 2004, ApJS, 154, L178
- (3) Baldwin, J.A., Phillips, M.M., & Terlevich, R. 1981, PASP, 93, 5
- (4) Calzetti, D. et al. 2005, ApJ, 633, 871
- (5) Cesarsky, D., Lequeux, J., Abergel, A., Perault, M., Palazzi, E., Madden, S., & Tran, D. 1996, A&A, 315, L309
- (6) Dale, D.A., Helou, G., Contursi, A., Silbermann, N.A., & Kolhatkar, S. 2001, ApJ, 549, 215
- (7) Dale, D.A., Helou, G., Brauher, J.R., Cutri, R.M., Malhotra, S., & Beichman, C.A. 2004a, ApJ, 604, 565
- (8) Dale, D.A. et al. 2004b, ApJ, 601, 813
- (9) Dale, D.A. et al. 2005, ApJ, 633, 857
- (10) Draine, B.T. & Li, A. 2001, ApJ, 551, 807
- (11) Engelbracht, C.W., Gordon, K.D., Rieke, G.H., Werner, M.W., Dale, D.A., & Latter, W.B. 2005, ApJ, 628, L29
- (12) Farrah, D., Afonso, J., Efstathiou, A., Rowan-Robinson, M., Fox, M., & Clements, D. 2003, MNRAS, 343, 585
- (13) Förster Schrieber, N.M., Roussel, H., Sauvage, M., & Charmandaris, V. 2004, A&A, 419, 501
- (14) Galliano, F., Madden, S.C., Jones, A.P., Wilson, C.D., & Bernard, J.-P. 2005, A&A, 434, 867
- (15) Genzel, R. et al. 1998, ApJ, 498, 579
- (16) Genzel, R. & Cesarsky, C.J. 2000, ARA&A, 38, 761
- (17) Giveon, U., Sternberg, A., Lutz, D., Feuchtgruber, H., & Pauldrach, A.W.A. 2002, ApJ, 566, 880
- (18) González Delgado, R.M., Cid Fernandes, R., Pérez, E., Martins, L.P., Storchi-Bergmann, T., Schmitt, H., Heckman, T., & Leitherer, C. 2004, ApJ, 605, 127
- (19) Haas, M., Siebenmorgen, R., Schulz, B., Krügel, E., & Chini, R. 2005, A&A, 442, L39
- (20) Habing, H.J. 1968, Bull. Astron. Inst. Netherlands, 19, 421
- (21) Henry, R.B.C. & Worthey, G. 1999, PASP, 111, 919
- (22) Ho, L., Filippenko, A.V., & Sargent, W.L. 1993, ApJ, 417, 63
- (23) Ho, L., Filippenko, A.V., & Sargent, W.L. 1997, ApJS, 112, 315
- (24) Ho, L., Filippenko, A.V., & Sargent, W.L. 1997, ApJ, 487, 579
- (25) Hollenbach, D. & Tielens, A.G.G.M. 1999, Rev. Mod. Phys., 71, 173
- (26) Houck, J.R. et al. 2004a, ApJS, 154, L18
- (27) Houck, J.R. et al. 2004b, ApJS, 154, L211
- (28) Kauffmann, G. et al. 2003, MNRAS, 346, 1055
- (29) Kaufman, M.J., Wolfire, M.G., & Hollenbach, D.J. 2006, ApJ, in press
- (30) Kennicutt, R.C. et al. 2003, PASP, 115, 928
- (31) Kewley, L.J., Dopita, M.A., Sutherland, R.S., Heisler, C.A., Trevena, J. 2001, ApJ, 556, 121
- (32) Laurent, O., Mirabel, I.F., Charmandaris, V., Gallais, P., Madden, S.C., Sauvage, M., Vigroux, L., & Cesarsky, C. 2000, A&A, 359, 887
- (33) Li, A. & Draine, B.T. 2001, ApJ, 554, 778
- (34) Lutz, D., Veilleux, S., & Genzel, R. 1999, ApJ, 517, L13
- (35) Madden, S.C., Galliano, F., Jones, A.P., & Sauvage, M. 2006, A&A, 446, 877
- (36) Maloney, P.R., Hollenbach, D.J., & Tielens, A.G.G.M. 1996, ApJ, 466, 561
- (37) Martín-Hernández, N.L., Vermeij, R., Tielens, A.G.G.M., van der Hulst, J.M., & Peeters, E. 2002, A&A, 389, 286
- (38) McCall, M.L. 1982, Ph.D. thesis, University of Texas at Austin
- (39) Meijerink, R. & Spaans, M. 2005, A&A, 436, 397
- (40) Moustakas, J. & Kennicutt, R.C. 2006, ApJ, in press (astro-ph/0511729)
- (41) Osterbrock, D.E. 1993, ApJ, 404, 551
- (42) Pagel, B.E.J. & Edmunds,M.G. 1981, ARA&A, 19, 77
- (43) Peeters, E. et al. 2002, A&A, 381, 571
- (44) Peeters, E., Spoon, H.W.W., & Tielens, A.G.G.M. 2004, ApJ, 613, 986
- (45) Peeters, E., Mattioda, A.L., Hudgins, D.M., & Allamandola, L.J. 2004, ApJ, 617, L65
- (46) Pilyugin, L.S. & Ferrini, F. 1998, A&A, 336, 103
- (47) Rieke, G.H. et al. 2004, ApJS, 154, 25
- (48) Roussel, H., Helou, G., Beck, R., Condon, J.J., Bosma, A., Matthews, K., & Jarrett, T.H. 2003, ApJ, 593, 733
- (49) Schaerer, D. & Stasińska, G. 1999, A&A, 345, L17
- (50) Siebenmorgen, R., Freudling, W., Krügel, E., & Haas, M., 2004, A&A, 421, 129
- (51) Smith, J.D.T. et al. 2004, ApJS, 154, L199
- (52) Spinoglio, L. & Malkan, M.A. 1992, ApJ, 399, 504
- (53) Sturm, E., Lutz, D., Tran, D., Feuchtgruber, H., Genzel, R., Kunze, D., Moorwood, A.F.M., & Thornley, M.D. 2000, A&A, 358, 481
- (54) Sturm, E., Lutz, D., Verma, A., Netzer, H., Sternberg, A., Moorwood, A.F.M., Oliva, E., & Genzel, R. 2002, A&A, 393, 821
- (55) Taniguchi, Y., Yoshino, A., Ohyama, Y., & Nishiura, S. 1999, ApJ, 514, 660
- (56) Tayal, S.S., & Gupta, G.P. 1999, ApJS, 526, 544
- (57) Thornley, M.D., Förster Schreiber, N.M., Lutz, D., Genzel, R., Spoon, H.W.W., Kunze, D., & Sternberg, A. 2000, ApJ, 539, 641
- (58) Thuan, T.X., Sauvage, M., & Madden, S. 1999, ApJ, 516, 783
- (59) Tran, Q.D. et al. 2001, ApJ, 552, 527
- (60) Veilleux, S. & Osterbrock, D.E. 1987, ApJS, 63, 295
- (61) Veilleux, S. 1991, ApJ, 369, 331
- (62) Veilleux, S., Sanders, D.B., & Kim, D.-C. 1999, ApJ, 522, 139
- (63) Verma, A., Lutz, D., Sturm, E., Sternberg, A., Genzel, R., & Vacca, W. 2003, A&A, 403, 829
- (64) Vermeij, R. & van der Hulst, J.M. 2002, A&A, 391, 1081
- (65) Vermeij, R., Damour, F., van der Hulst, J.M., & Baluteau, J.-P. 2002, A&A, 390, 649
- (66) Verstraete, L., Pech, C., Moutou, C., Sellgren, K., Wright, C.M., Giard, M., Léger, A., Timmerman, R., & Drapatz, S. 2001, A&A, 372, 981
- (67) Vila-Costas, M.B. & Edmunds, M.G. 1992, MNRAS, 259, 121
- (68) Voit, G.M. 1992, ApJ, 399, 495
- (69) Wang, W., Liu, X.-W., Zhang, Y., & Barlow, M.J. 2004, A&A, 427, 873
- (70) Weedman, D.W., Hao, L., Higdon, S.J.U., Devost, D., Wu, Y., Charmandaris, V., Brandl, B., Bass, E., & Houck, J.R. 2005, ApJ, 633, 706
- (71) Wu, Y., Charmandaris, V., Hao, H., Brandl, B.R., Bernard-Salas, J., Spoon, H.W.W., & Houck, J.R. 2006, ApJ, in press
- (72) Xu, C., Lonsdale, C.J., Shupe, D.L., O’Linger, J., & Masci, F. 2001, ApJ, 562, 179
| Species | PAH | [SIV] | [NeII] | [NeIII] | [SIII] | [OIV] | [SIII] | [SiII] |
|---|---|---|---|---|---|---|---|---|
| Wavelength | 6.2m | 10.51m | 12.81m | 15.56m | 18.71m | 25.89m | 33.48m | 34.82m |
| ionization (eV) | 34.8 | 21.6 | 41.0 | 23.3 | 54.9 | 23.3 | 8.2 | |
| NGC 0337 | 0.560.04 | 17.41.6 | 8.10.5 | 13.30.6 | 0.50.2 | 17.90.5 | 21.10.6 | |
| NGC 0584 | 2.40.7 | 1.10.5 | 0.8 | |||||
| NGC 0628 | 0.390.08 | 6.41.3 | 2.50.3 | 0.7 | 9.10.7 | 5.80.8 | ||
| NGC 1097 | 0.420.01 | 3284 | 29.00.6 | 89.60.5 | 5.3 | 1033 | 2784 | |
| NGC 1266 | 0.290.02 | 28.01.0 | 10.80.6 | 1.30.5 | 2.8 | 2.70.6 | 17.33.7 | |
| NGC 1377 | 3.50.5 | 3.4 | ||||||
| NGC 1404 | 1.90.8 | 1.30.6 | 0.7 | |||||
| NGC 1566 | 0.200.01 | 1.10.6 | 16.60.8 | 9.80.4 | 6.80.6 | 6.70.5 | 6.80.7 | 15.20.8 |
| NGC 1705 | 0.420.26 | 3.20.8 | 1.10.3 | 7.00.4 | 3.40.4 | 1.20.4 | 4.90.5 | 3.60.5 |
| NGC 2798 | 0.520.02 | 5.91.8 | 2082 | 34.40.5 | 81.60.8 | 9.61.8 | 70.12.6 | 1024 |
| NGC 2841 | 0.030.03 | 5.50.5 | 6.60.4 | 2.70.5 | 0.90.1 | 3.60.4 | 9.72.3 | |
| NGC 2915 | 1.80.9 | 3.10.4 | 11.10.4 | 4.60.4 | 0.40.1 | 6.10.8 | 4.90.4 | |
| NGC 2976 | 0.350.04 | 7.70.7 | 2.70.3 | 6.30.4 | 0.40.1 | 9.20.3 | 8.50.5 | |
| NGC 3049 | 0.620.04 | 1.10.6 | 36.40.8 | 6.10.4 | 27.30.6 | 0.7 | 24.40.4 | 21.50.5 |
| NGC 3190 | 0.090.01 | 7.40.6 | 5.60.5 | 1.80.6 | 0.70.2 | 2.00.2 | 6.91.7 | |
| NGC 3184 | 0.260.04 | 17.80.5 | 2.10.5 | 7.80.5 | 0.7 | 7.20.3 | 12.00.4 | |
| NGC 3198 | 0.310.03 | 13.90.4 | 0.80.3 | 4.80.5 | 0.9 | 5.50.5 | 11.12.2 | |
| NGC 3265 | 0.570.03 | 1.50.7 | 28.40.3 | 4.90.2 | 11.70.3 | 1.2 | 13.10.6 | 16.90.7 |
| Markarian 33 | 0.510.02 | 17.10.8 | 56.71.1 | 45.30.4 | 52.80.7 | 1.00.7 | 32.80.8 | 25.10.9 |
| NGC 3351 | 0.460.01 | 1652 | 14.00.4 | 60.00.5 | 2.3 | 60.51.7 | 1282 | |
| NGC 3521 | 0.380.04 | 12.90.8 | 7.90.5 | 3.30.7 | 0.80.4 | 3.60.8 | 16.72.3 | |
| NGC 3627 | 0.250.01 | 21.90.9 | 8.90.5 | 4.70.4 | 1.30.7 | 7.01.1 | 20.23.3 | |
| NGC 3773 | 0.650.08 | 3.90.7 | 16.50.5 | 16.10.5 | 14.30.6 | 0.8 | 17.00.6 | 13.10.7 |
| NGC 3938 | 0.130.03 | 5.70.5 | 1.00.5 | 1.10.5 | 0.30.1 | 2.20.1 | 5.90.2 | |
| NGC 4125 | 2.50.5 | 3.40.5 | 0.9 | 0.80.6 | 5.41.1 | |||
| NGC 4254 | 0.540.03 | 51.71.1 | 6.40.4 | 10.00.5 | 1.30.2 | 15.60.6 | 48.91.1 | |
| NGC 4321 | 0.490.02 | 1102 | 12.30.4 | 23.10.3 | 1.4 | 25.50.8 | 84.80.9 | |
| NGC 4536 | 0.540.01 | 7.52.6 | 3073 | 48.90.7 | 1301 | 3.9 | 1603 | 2203 |
| NGC 4552 | 1.80.5 | 4.80.8 | 0.90.4 | 0.9 | 0.70.3 | 2.00.7 | ||
| NGC 4569 | 0.260.02 | 1.00.8 | 32.61.2 | 15.80.5 | 8.80.7 | 2.40.6 | 7.70.6 | 31.50.9 |
| NGC 4579 | 0.090.02 | 22.80.7 | 12.50.5 | 4.00.7 | 2.20.3 | 3.00.4 | 19.50.4 | |
| NGC 4725 | 0.070.04 | 0.80.5 | 1.80.5 | 3.00.4 | 0.30.2 | 1.70.2 | 1.30.2 | 4.61.5 |
| NGC 4736 | 0.160.01 | 13.71.1 | 14.30.5 | 6.10.9 | 3.80.9 | 9.21.0 | 22.31.8 | |
| NGC 4826 | 0.280.01 | 1.80.5 | 99.01.6 | 23.40.6 | 41.80.4 | 2.51.1 | 56.81.0 | 1051 |
| NGC 5194 | 0.240.02 | 2.90.8 | 66.20.8 | 36.20.6 | 13.10.6 | 14.91.6 | 18.30.4 | 64.80.8 |
| NGC 5408aaThe infrared emission peaks outside of the field of view of the spectral maps. | 1.70.4 | 0.9 | 1.50.5 | 1.80.5 | ||||
| NGC 5713 | 0.560.02 | 1.70.7 | 1232 | 17.30.4 | 47.50.5 | 2.01.0 | 57.21.2 | 90.31.2 |
| NGC 5866 | 0.070.01 | 7.50.9 | 5.10.3 | 1.10.4 | 0.70.1 | 4.00.3 | 9.70.4 | |
| IC 4710 | 3.60.8 | 4.31.6 | 3.60.5 | 1.3 | 4.20.6 | 1.40.4 | ||
| NGC 7331 | 0.090.02 | 0.50.2 | 18.80.6 | 10.30.3 | 6.00.4 | 2.40.6 | 12.20.3 | 29.06.3 |
| NGC 7552 | 0.450.01 | 6.51.4 | 57331 | 56.81.4 | 2111 | 15.3 | 1655 | 2608 |
| NGC 7793 | 0.360.04 | 10.30.6 | 2.90.5 | 8.70.6 | 0.5 | 9.40.3 | 9.50.5 |
Note. — Fluxes and their (statistical) uncertainties are averaged over 23″15″ and listed in units of 10-9 W m-2 sr-1. Calibration uncertainties are an additional 30%. The 6.2 m PAH feature equivalent width is given in units of microns.
Note. — Eight galaxies from the SINGS Data Release Three are not listed in this table. No Short-Low, Short-High, or Long-High data were taken for the optical centers of Holmberg II, IC 2574, DDO 154 and NGC 6822. DDO 053, Holmberg IX, DDO 165, and NGC 5398 (Tololo 89)aafootnotemark: were non-detections.
| Species | PAH | [SIV] | [NeII] | [NeIII] | [SIII] | [OIV] | [SIII] | [SiII] |
|---|---|---|---|---|---|---|---|---|
| Wavelength | 6.2m | 10.51m | 12.81m | 15.56m | 18.71m | 25.89m | 33.48m | 34.82m |
| ionization (eV) | 34.8 | 21.6 | 41.0 | 23.3 | 54.9 | 23.3 | 8.2 | |
| NGC 5194 CCM107 | 0.470.02 | 32.00.6 | 2.30.6 | 10.60.5 | 1.70.3 | 18.30.5 | 34.10.5 | |
| NGC 5194 CCM072 | 0.610.02 | 1.70.5 | 71.91.0 | 3.80.4 | 29.40.6 | 1.40.8 | 36.20.5 | 49.20.7 |
| NGC 5194 CCM071 | 0.660.02 | 44.30.7 | 5.60.5 | 16.60.7 | 1.30.4 | 25.00.6 | 41.20.5 | |
| NGC 5194 CCM001 | 0.690.02 | 16.41.1 | 3.30.5 | 8.20.3 | 0.60.2 | 13.70.5 | 21.70.9 | |
| NGC 5194 CCM010 | 0.690.03 | 39.20.7 | 6.10.4 | 19.80.5 | 0.50.3 | 29.00.5 | 37.70.7 | |
| NGC 5194 CCM071A | 0.520.02 | 21.30.6 | 5.70.4 | 11.00.5 | 0.6 | 14.42.1 | 12.60.4 | |
| NGC 3031 HK230 | 0.440.03 | 4.10.5 | 0.70.5 | 2.70.4 | 0.7 | 3.60.5 | 4.00.4 | |
| NGC 3031 HK343 | 0.380.03 | 7.53.1 | 3.60.4 | 7.00.9 | 0.8 | 9.80.8 | 7.00.6 | |
| NGC 3031 HK453 | 0.650.05 | 9.00.6 | 3.40.4 | 8.80.9 | 0.8 | 11.72.0 | 9.30.6 | |
| NGC 3031 HK268 | 0.550.03 | 1.20.7 | 15.10.8 | 6.00.4 | 13.40.7 | 0.8 | 17.30.7 | 13.00.6 |
| NGC 3031 HK652 | 0.680.06 | 10.30.7 | 2.70.5 | 9.21.1 | 0.8 | 10.70.8 | 11.80.6 | |
| NGC 3031 HK741 | 0.750.05 | 8.90.8 | 1.60.4 | 7.30.4 | 0.9 | 7.60.7 | 6.50.7 | |
| NGC 3031 Munch1 | 2.982.29 | 1.40.2 | 1.0 | |||||
| NGC 6946 H4 | 0.650.02 | 3.60.7 | 16.60.6 | 17.50.5 | 14.70.4 | 1.10.2 | 14.20.6 | 14.60.5 |
| NGC 6946 HK3 | 0.630.03 | 8.81.3 | 28.20.4 | 31.90.4 | 30.60.4 | 0.90.2 | 39.00.5 | 25.10.5 |
| NGC 6946 H288 | 0.810.04 | 18.10.4 | 8.50.4 | 14.00.5 | 0.6 | 19.30.3 | 11.80.2 | |
| NGC 6946 H40 | 0.840.03 | 1.90.8 | 18.80.4 | 8.50.4 | 15.00.4 | 0.20.1 | 17.30.3 | 15.20.5 |
| NGC 6946 H28 | 1.050.45 | 9.40.5 | 2.90.3 | 6.80.5 | 0.5 | 9.00.3 | 8.20.4 | |
| NGC 0628 H292 | 0.550.02 | 2.10.9 | 25.60.7 | 2.70.4 | 20.10.6 | 1.0 | 27.40.5 | 13.10.7 |
| NGC 0628 H572 | 0.690.03 | 12.50.7 | 2.60.5 | 8.10.4 | 0.9 | 16.30.5 | 8.20.6 | |
| NGC 0628 H627 | 0.600.03 | 3.81.3 | 11.50.7 | 9.50.5 | 10.60.4 | 0.9 | 17.80.9 | 9.60.5 |
| NGC 0628 H013 | 0.520.07 | 4.10.7 | 2.20.3 | 4.90.4 | 0.7 | 11.31.3 | 2.90.4 | |
| HolmbergII HSK45 | 3.40.5 | 3.20.4 | 0.9 | 2.90.7 | 2.80.5 | |||
| HolmbergII HSK67 | 0.70.2 | 0.7 | 0.60.2 | 0.90.3 | ||||
| HolmbergII HSK70 | 1.10.5 | 0.60.2 | 0.9 | 0.40.2 | 1.70.5 | |||
| HolmbergII HSK07 | 1.10.6 | 0.80.5 | 1.0 |
Note. — Fluxes and their (statistical) uncertainties are averaged over 23″15″ and listed in units of 10-9 W m-2 sr-1. Calibration uncertainties are an additional 30%. The 6.2 m PAH feature equivalent width is given in units of microns.
| Object | Type | Reference |
|---|---|---|
| LMC N160A1 | LMC HII | Vermeij et al. (2002) |
| LMC N160A2 | LMC HII | Vermeij et al. (2002) |
| LMC N159-5 | LMC HII | Vermeij et al. (2002) |
| LMC N157B | LMC HII | Vermeij et al. (2002) |
| LMC N4A | LMC HII | Vermeij et al. (2002) |
| LMC N11A | LMC HII | Vermeij et al. (2002) |
| LMC N83B | LMC HII | Vermeij et al. (2002) |
| LMC 30Dor1 | LMC HII | Vermeij et al. (2002) |
| LMC 30Dor2 | LMC HII | Vermeij et al. (2002) |
| LMC 30Dor3 | LMC HII | Vermeij et al. (2002) |
| LMC 30Dor4 | LMC HII | Vermeij et al. (2002) |
| SMC N88A | SMC HII | Vermeij et al. (2002) |
| SMC N66 | SMC HII | Vermeij et al. (2002) |
| SMC N81 | SMC HII | Vermeij et al. (2002) |
| NGC 0253 | HII nucleus | Verma et al. (2003) |
| IC 342 | HII nucleus | Verma et al. (2003) |
| II Zw 40 | HII nucleus | Verma et al. (2003) |
| NGC 3034 | HII nucleus | Verma et al. (2003) |
| NGC 3256 | HII nucleus | Verma et al. (2003) |
| NGC 3690A | HII nucleus | Verma et al. (2003) |
| NGC 3690B | HII nucleus | Verma et al. (2003) |
| NGC 4038 | HII nucleus | Verma et al. (2003) |
| NGC 4945 | HII/Seyfert | Verma et al. (2003) |
| NGC 5236 | HII nucleus | Verma et al. (2003) |
| NGC 5253 | HII nucleus | Verma et al. (2003) |
| NGC 7552 | LINER/HII | Verma et al. (2003) |
| WB89 380 A | Galactic HII | Giveon et al. (2002) |
| WB89 380 B | Galactic HII | Giveon et al. (2002) |
| WB89 399 | Galactic HII | Giveon et al. (2002) |
Note. — The full version would appear as an electronic table in the online Journal.
| Region | Number | Seyfert | LINER | HII | extranuclear |
|---|---|---|---|---|---|
| of | nuclei | +HII regions | |||
| Sources | (%) | (%) | (%) | (%) | |
| I | 15 | 73 | 20 | 7 | 0 |
| II | 31 | 42 | 23 | 19 | 16 |
| III | 31 | 0 | 10 | 32 | 58 |
| IV | 12 | 67 | 25 | 8 | 0 |
| V | 39 | 33 | 18 | 21 | 28 |
| VI | 34 | 0 | 9 | 26 | 65 |
| VII | 12 | 67 | 25 | 8 | 0 |
| VIII | 45 | 31 | 24 | 27 | 18 |
| IX | 31 | 0 | 0 | 16 | 84 |
Note. — “extranuclear + HII regions” implies SINGS extranuclear/HII regions in addition to Milky Way and Magellanic Cloud HII regions.
| Region | Number | Seyfert | LINER | HII | extranuclear |
|---|---|---|---|---|---|
| of | nuclei | +HII regions | |||
| Detections | (%) | (%) | (%) | (%) | |
| I+II | 38 | 61 | 32 | 8 | 0 |
| III+IV | 79 | 0 | 3 | 30 | 67 |
| I | 16 | 69 | 31 | 0 | 0 |
| II | 22 | 55 | 32 | 14 | 0 |
| III | 47 | 0 | 4 | 51 | 45 |
| IV | 32 | 0 | 0 | 0 | 100 |
Note. — “extranuclear + HII regions” implies SINGS extranuclear/HII regions in addition to Milky Way and Magellanic Cloud HII regions.