Eridanus - A Supergroup in the Local Universe?
Abstract
We examine a possible supergroup in the direction of the Eridanus constellation using 6dF Galaxy Survey second data release (6dFGS DR2) positions and velocities together with 2MASS and HyperLEDA photometry. We perform a friends-of-friends analysis to determine which galaxies are associated with each substructure before examining the properties of the constituent galaxies. The overall structure is made up of three individual groups that are likely to merge to form a cluster of mass . We conclude that this structure is a supergroup. We also examine the colours, morphologies and luminosities of the galaxies in the region with respect to their local projected surface density. We find that the colours of the galaxies redden with increasing density, the median luminosities are brighter with increasing environmental density and the morphologies of the galaxies show a strong morphology-density relation. The colours and luminosities of the galaxies in the supergroup are already similar to those of galaxies in clusters, however the supergroup contains more late-type galaxies, consistent with its lower projected surface density. Due to the velocity dispersion of the groups in the supergroup, which are lower than those of clusters, we conclude that the properties of the constituent galaxies are likely to be a result of merging or strangulation processes in groups outlying this structure.
keywords:
Surveys, galaxies: clusters: general, galaxies: individual NGC 1407, galaxies: individual: NGC 1332, galaxies: individual: NGC 1395, galaxies: evolution1 Introduction
The paradigm of hierarchical structure formation leads us to expect that clusters of galaxies are built up from the accretion and merger of smaller structures like galaxy groups (e.g. Blumenthal et al. 1984). Although we observe clusters of galaxies accreting galaxy group-like structures along filaments (e.g. Kodama et al. 2001; Pimbblet et al. 2002) we lack clear examples of groups merging together to form clusters – a ‘supergroup’. We define a supergroup to be a group of groups that will eventually merge to form a cluster. The first example of a supergroup was found recently at by Gonzalez et al. (2005).
Studies of the properties of galaxies suggest that they strongly depend on the density of the environment in which they reside. Studies of the properties of galaxies in clusters out to several virial radii (e.g. Dressler 1980; Hashimoto et al. 1998; Balogh et al. 1997, 1998; Kodama et al. 2001; Pimbblet et al. 2002; Wake et al. 2005; Tanaka et al. 2005) and in large galaxy surveys such as the Two-degree Field Galaxy Redshift Survey (2dFGRS; Lewis et al. 2002; de Propris et al. 2003; Balogh et al. 2004; Croton et al 2005; Hilton et al. 2005) and Sloan Digital Sky Survey (SDSS; Blanton et al. 2003; Gómez et al. 2003; Baldry et al. 2004; Kauffmann et al. 2004; Tanaka et al. 2004) have determined that the properties of galaxies in the densest regions differ from those in the least dense regions. Those galaxies in the densest regions are more likely to be early-type galaxies (e.g. Dressler 1980; Postman & Geller 1984; Dressler et al. 1997; Tran et al. 2001; Lares et al. 2004), redder (e.g. Kodama et al. 2001; Pimbblet et al. 2002; Girardi et al. 2003; Blanton et al. 2003; Baldry et al. 2004; Tanaka et al. 2004; Wake et al. 2005), with a lower star-forming fraction (e.g. Balogh et al. 1997; Hashimoto et al. 1998; Zabludoff & Mulchaey 1998; Lewis et al. 2002; Gómez et al. 2003; Balogh et al. 2004; Kauffmann et al. 2004; Wilman et al. 2005). This suggests that star formation is being suppressed in denser environments. The projected surface density at which this difference occurs is galaxies Mpc-2 (Lewis et al., 2002; Gómez et al., 2003). This is of the order of the density associated with poor groups of galaxies.
However, it is still uncertain what the driving factor in the change of properties is. Whether it is a result of nature – galaxies that form in such environments have these properties, or nurture – galaxies falling into the clusters are transformed by their environment, is unclear. The proposed mechanisms for this transformation are: ram pressure stripping (Gunn & Gott, 1972; Quilis et al., 2000), strangulation (Larson et al., 1980; Cole et al., 2000), harrassment (Moore et al., 1996), tidal interactions (Byrd & Valtonen, 1990; Gnedin, 2003) and galaxy mergers. Of these, ram pressure stripping and harrassment are more likely to be dominant in the dense, but rare, environments of clusters whereas mergers and strangulation are more likely in the group environment where the velocity dispersion of the group is similar to that of its constituent galaxies (Barnes, 1985; Zabludoff & Mulchaey, 1998; Hashimoto & Oemler, 2000). Miles et al. (2004) show that there is a dip in the luminosity function of low X-ray luminosity groups ( erg s-1) consistent with rapid merging currently occurring at these densities.
Whether nature or nurture is the dominating factor, the group environment is clearly very important to the process of galaxy evolution, not least because more than 50 per cent of galaxies in the local Universe are found in groups (Eke et al., 2004). Given this dependence on environment and the importance of the lower-density group environment, finding and studying supergroups is vital to our understanding of how both clusters and their constituent galaxies evolve.
The known concentration of galaxies in the region behind the Eridanus constellation is a possible supergroup in the local Universe. This concentration was first noted by Baker & Shapley (1933). de Vaucouleurs (1975) found that his group 31, and groups associated with NGC 1332 and NGC 1209 formed the ‘Eridanus Cloud’. The Southern Sky Redshift Survey (SSRS; da Costa et al. 1988) determined that this cloud lies on a filamentary structure with the Fornax cluster and Dorado group to the south and in front of the ‘Great Wall’.
The Eridanus cloud lies at a distance of Mpc and includes two optically classified groups of galaxies (NGC 1407; Garcia 1993 and NGC 1332; Barton et al. 1996). However, there is some debate as to the nature of this region. Willmer et al. (1989) describe it as a cluster made up of three to four subclumps, while Omar & Dwarakanath (2005a) describe it as a loose group at an evolutionary stage intermediate to that of the Ursa-Major and Fornax clusters. Willmer et al. (1989) calculated that the different subclumps are bound to one another.
The NGC 1407 and NGC 1332 groups have previously been studied as part of the Group Evolution Multiwavelength Study (GEMS; Osmond & Ponman 2004). This is an on-going study of 60 groups with the aim of determining how groups, and their constituent galaxies, evolve. The groups were selected from optical catalogues and then compared with the ROSAT PSPC pointings. Groups were then selected such that the group position was within of the ROSAT pointing co-ordinates, the ROSAT exposure time was s and the recessional velocity of the group was km s-1. This ensured that there were enough photon counts to confirm a detection and that the X-ray emission was neither so close as to overfill the PSPC field of view nor too distant to be detected. This resulted in a sample of 35 groups, to which a further 25 which had been previously studied with the PSPC (Helsdon & Ponman, 2000; Ponman et al., 1996) were added. Wide-field neutral hydrogen (HI) observations of 16 GEMS groups in the Southern hemisphere were made with the Parkes radiotelescope (Kilborn et al., 2005), these include the NGC 1332 and NGC 1407 groups and their HI properties are discussed later in this paper.
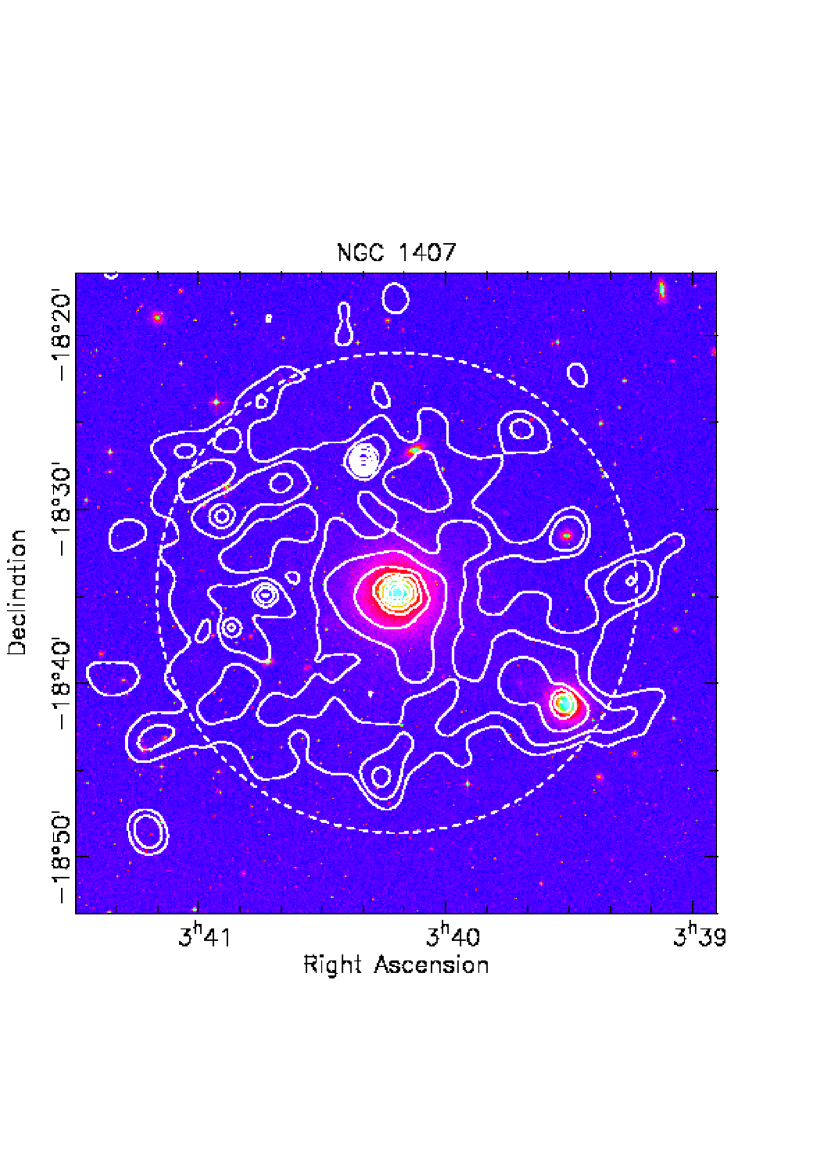
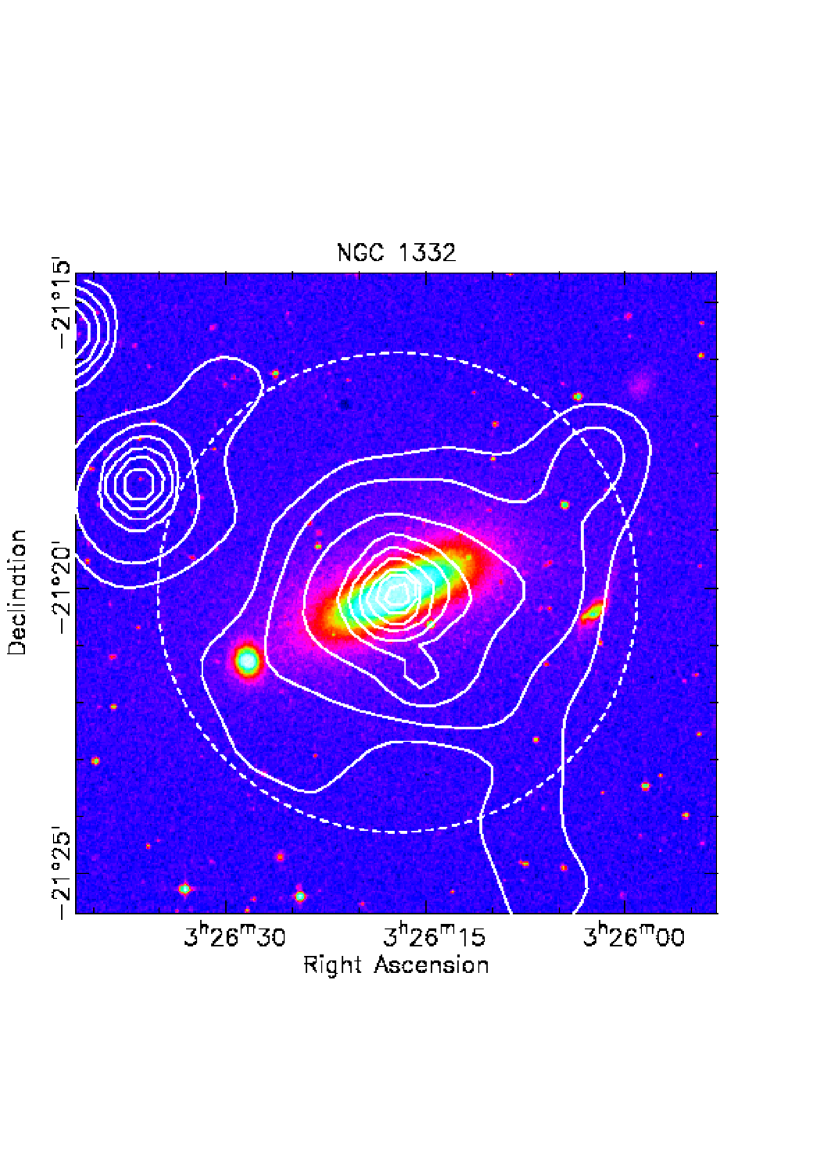
ROSAT data is therefore available for both the NGC 1407 and NGC 1332 groups from the GEMS archive (Osmond & Ponman, private communication). Figure 1 shows that the X-ray emission around NGC 1407 is symmetric, if irregular, and is emitted from the intra-group gas, confirming the presence of a massive structure. In contrast, the X-ray emission from the NGC 1332 group is associated with NGC 1332 itself, not with intra-group gas. Omar & Dwarakanath (2005a) suggest that there is intra-group gas associated with NGC 1395, a large elliptical in this region, however no optically selected group has previously been associated with this galaxy.
The advent of the 6dF Galaxy Survey (6dFGS; Jones et al. 2004) with its public release of positions and velocities of galaxies in the local Universe enables a reanalysis of this region to determine what this structure is. Here we present new measurements allowing the first detailed dynamical analysis of this region and its constituent galaxies.
2 Data
2.1 6dFGS
The 6dF Galaxy Survey (6dFGS; Jones et al. 2004) is a wide-area (the entire Southern sky with ), primarily -band selected galaxy redshift survey. The catalogue provides positions, recession velocities, and spectra for the galaxies, along with -band magnitudes from the 2MASS extended source catalogue (Jarrett et al., 2000; Jones et al., 2004) and - and -band data from the SuperCOSMOS catalogue (Hambly et al., 2001). However, at magnitudes brighter than mag the SuperCOSMOS data are unreliable owing to problems with galaxy-galaxy deblending. The second data release of the 6dFGS (DR2; Jones et al. 2005) contains 71,627 unique galaxies.
Galaxy data were obtained from the 6dFGS DR2 for an area of radius 15 degrees ( Mpc2), centred on the position of NGC 1332, in the velocity range 500 – 2500 km s-1. The lower recession velocity limit was chosen to avoid Galactic confusion. This provides a sample of 135 unique galaxies, detailed in Appendix A. The 6dFGS database also provides 2MASS -band magnitudes where available. We have used the 2MASS magnitudes within the 20th magnitude isophote (henceforth denoted as ). As 2MASS is per cent complete to (Jarrett et al., 2000) we assume that those galaxies without 2MASS data are fainter than the 2MASS magnitude limit.
2.2 NED
The 6dFGS is not yet complete. We therefore supplemented the 6dFGS data with sources from the NASA/IPAC Extragalactic Database (NED) with known recession velocities between 500 and km s-1. The primary sources of these velocities are: The Fornax compact object survey (Mieske et al., 2004), SDSS (Abazajian et al., 2003), 2dFGRS (Colless et al., 2001) and the SSRS (da Costa et al., 1998). This added an additional 378 unique galaxies, detailed in Appendix B. Of these 378 galaxies, 266 either do not have 2MASS magnitudes or are fainter than the 2MASS limit of . The total number of galaxies in the region from NED and 6dFGS is 513. Figure 2 illustrates the velocity distribution of these 513 galaxies, while Figure 3 illustrates their spatial distribution.


NED suffers from poorly contrained selection biases, it is therefore important to illustrate that the distributions of recession velocities of galaxies in the two samples are consistent with being drawn from the same parent population. Figure 4 compares the recession velocities of both samples. A Kolmogorov-Smirnov test finds that the recession velocities from the 6dFGS and NED are consistent with being drawn from the same parent population at the 96 per cent level.

We also tested the effects of completeness by comparing our sample with galaxies selected in the same region of sky and velocity from the Hyper-Lyon-Meudon Extragalactic DAtabase (HyperLEDA; Paturel et al. 1997). HyperLEDA is a freely available database of observed galaxy quantities, including positions, velocities and -band magnitudes. HyperLEDA has been shown to be photometrically complete to at least mag (e.g. Giuricin et al. 2000; equivalent to mag). We find all galaxies in HyperLEDA in this region with mag to have velocities. Therefore, HyperLEDA is complete to mag in this region. We find our sample to match that in HyperLEDA to this limit. Therefore, our sample is complete to at least mag. We test the effects of including galaxies fainter than this limit in our analyses in the relevant sections.
We applied the limiting magnitude of the 2MASS data (i.e. ; Jarrett et al. 2000), to the data for luminosity, morphology and colour analyses. This created an apparent-magnitude limited sample of 201 galaxies. Of these 201 galaxies, 89 are from the 6dFGS whilst 112 are from NED.
2.3 HyperLEDA
Owing to the size of this region it was unfeasible to obtain new photometric data so we used HyperLEDA to obtain total -band magnitudes and morphological T-types for the apparent magnitude-limited sample. T-types are numerical codes chosen to correspond to morphological galaxy type. The correspondance with Hubble type is given in more detail in Paturel et al. (1997). In summary, T-types of T-type correspond to E to S0a galaxies whilst T-type correspond to Sa to Irr galaxy types. This resulted in 199 galaxies with measured -band magnitudes and 193 with both -band magnitudes and T-types.
3 Analysis
To avoid the effects of peculiar velocities which are significant at recession velocities less than km s-1 (Marinoni et al., 1998) we use the distance modulus (DM; ) determined from the globular cluster luminosity function of NGC 1407 (Forbes et al., 2005). Using this DM, or that calculated from the surface brightness fluctuation method of Tonry et al. (2001) which gives for the Eridanus region (corrected following the work of Jensen et al. 2003), has no effect on the general results presented below. Absolute magnitudes are calculated as . Galactic Extinction () is calculated for the - and - bands using the extinction maps of Schlegel et al. (1998) and is of the order mag and mag. Throughout this paper we assume km s-1 Mpc-1.
3.1 Defining Structures
In order to study the dynamics of the region it is important to determine which galaxies are associated with each structure. We used the ‘friends-of-friends’ (henceforth FOF; Huchra & Geller 1982) percolation algorithm. This method finds group structures in galaxy data based on positional and velocity information and does not rely on any a priori assumption about the geometrical shape of groups. As we are examining a small range in recession velocities we do not adopt the method used by Huchra & Geller (1982) to compensate for the sampling of the galaxy luminosity function as a function of the distance of the group.
Owing to the similarity in sampling between the 2dFGRS and 6dFGS at these recession velocities we follow the prescriptions of the 2dFGRS Percolation-Inferred Galaxy Group (2PIGG; Eke et al. 2004) catalogue to determine the most appropriate value of limiting density contrast, ,
| (1) |
The number density contour surrounding each group then represents a fixed number density enhancement relative to the mean number density. We assume the differential galaxy luminosity function defined by Kochanek et al. (2001), which Ramella et al. (2004) determine to be a good approximation for the -band groups luminosity function (, and for km s-1 Mpc-1). The 2PIGG limiting density contrast then gives Mpc. We also follow 2PIGG to calculate our velocity limit, . The peculiar motion of galaxies moving in a gravitational potential lengthens the group along the line-of-sight in velocity space – giving the ‘Finger of God’ effect. If we assume that the projected spatial () and the line-of-sight dimensions of a group in velocity space () are in proportion, Eke et al. (2004) show that a ratio of 12 for relative to is the most appropriate for a linking volume, giving km s-1 here.
The FOF algorithm was run over the whole sample of 513 galaxies. We remove all groups with galaxies as these have been shown by many surveys (e.g. Ramella et al. 1995; Nolthenius et al. 1997; Diaferio et al. 1999) to be significantly more likely to be false positives found by the FOF algorithm.
Following these methods we find 17 groups in the field, with an average of 17.5 members per group. These are illustrated in Figure 3. We find 12 of the 14 groups previously defined in this region. Of the 2 we do not detect (USGC S108 and USGC S116) both have only 4 members and have only been detected in the Updated Zwicky Catalogue – Southern Sky Redshift Survey 2 group catalogue (UZC-SSRS2; Ramella et al. 2002). The galaxies in these groups are spatially extended suggesting that the UZC-SSRS2 group finder was tuned to find looser structures than other group findesr used.
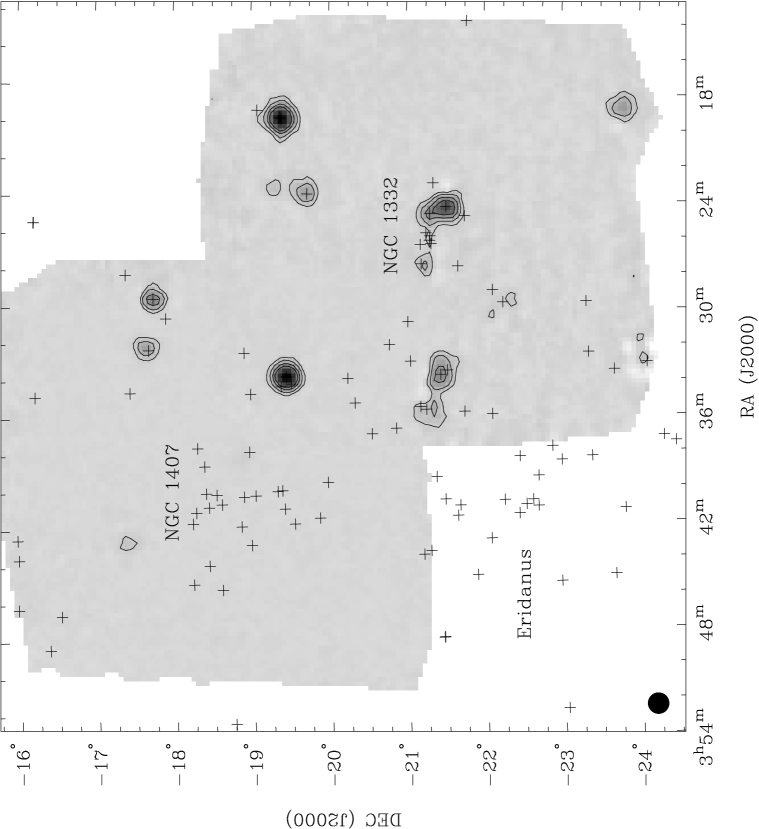
Those groups specifically associated with the Eridanus region are illustrated in Figure 5. This shows that the algorithm finds distinct Eridanus, NGC 1407 and NGC 1332 groups. The galaxies in each group are detailed in Table 1.

| Galaxy Name | 6dFGS ID | RA (J2000) | Dec (J2000) | (km s-1) | (mag) | (Mpc) | T-type |
| NGC 1407 Group | |||||||
| APMBGC 548-122-018 | 6dF J0341498-193453 | 3:41:49.82 | -19:34:52.5 | 1914 | - | 0.399 | - |
| ESO 548- G 076 | 6dF J0341318-195419 | 3:41:31.81 | -19:54:18.5 | 1545 | 11.877 | 0.501 | -1.3 |
| ESO 548- G 079 | 6dF J0341561-185343 | 3:41:56.08 | -18:53:42.6 | 2031 | 11.110 | 0.208 | -1.2 |
| ESO 548- G 073 | 6dF J0341044-190540 | 3:41: 4.41 | -19: 5:40.0 | 987 | 12.907 | 0.209 | 3.3 |
| 2MASX J03401592-1904544 | 6dF J0340159-190454 | 3:40:15.93 | -19: 4:54.4 | 1614 | 12.262 | 0.183 | -3.5 |
| 2MASX J03404323-1838431 | 6dF J0340432-183843 | 3:40:43.23 | -18:38:43.1 | 1374 | 12.364 | 0.067 | -1.6 |
| ESO 548- G 064 | 6dF J0340001-192535 | 3:40: 0.08 | -19:25:34.7 | 1874 | 11.032 | 0.307 | -2.7 |
| APMBGC 548-110-078 | 6dF J0340527-182841 | 3:40:52.73 | -18:28:40.8 | 1680 | - | 0.087 | - |
| NGC 1383 | 6dF J0337392-182022 | 3:37:39.24 | -18:20:22.1 | 2009 | 9.506 | 0.234 | -1.9 |
| IC 0345 | 6dF J0341091-181851 | 3:41: 9.13 | -18:18:50.9 | 1245 | 11.218 | 0.142 | -2.0 |
| NGC 1390 | 3:37:52.17 | -19: 0:30.1 | 1207 | 11.704 | 0.250 | 1.2 | |
| NGC 1393 | 3:38:38.58 | -18:25:40.7 | 2127 | 9.312 | 0.138 | -1.7 | |
| ESO 548- G 065 | 3:40: 2.64 | -19:22: 0.7 | 1221 | 13.206 | 0.285 | 1.3 | |
| IC 0343 | 3:40: 7.14 | -18:26:36.5 | 1841 | 10.647 | 0.052 | -0.8 | |
| NGC 1407 | 3:40:11.84 | -18:34:48.5 | 1779 | 6.855 | 0.016 | -4.9 | |
| ESO 548- G 068 | 3:40:19.17 | -18:55:53.4 | 1693 | 10.427 | 0.129 | -2.6 | |
| ESO 548- G 072 | 3:41: 0.25 | -19:27:19.4 | 2034 | - | 0.330 | 5.0 | |
| IC 0346 | 3:41:44.67 | -18:16: 1.2 | 2013 | 10.036 | 0.195 | -0.5 | |
| ESO 549- G 002 | 3:42:57.39 | -19: 1:14.9 | 1111 | - | 0.311 | 9.5 | |
| Eridanus Group | |||||||
| ESO 482- G 017 | 6dF J0337433-225430 | 3:37:43.33 | -22:54:29.5 | 1515 | 12.748 | 0.229 | 0.8 |
| LSBG F482-034 | 6dF J0338166-222911 | 3:38:16.55 | -22:29:11.4 | 1359 | - | 0.067 | - |
| 2MASX J03355395-2208228 | 6dF J0335540-220823 | 3:35:53.95 | -22: 8:23.0 | 1374 | 12.737 | 0.248 | 0.0 |
| 2MASX J03354520-2146578 | 6dF J0335453-214659 | 3:35:45.27 | -21:46:59.2 | 1638 | 13.678 | 0.318 | 0.0 |
| ESO 548- G 036 | 6dF J0333277-213353 | 3:33:27.69 | -21:33:52.9 | 1520 | 10.541 | 0.536 | 0.1 |
| ESO 548- G 034 | 6dF J0332576-210522 | 3:32:57.63 | -21: 5:21.9 | 1707 | 12.052 | 0.676 | 5.0 |
| NGC 1353 | 6dF J0332030-204908 | 3:32: 2.98 | -20:49: 8.2 | 1587 | 8.204 | 0.804 | 3.1 |
| 2MASX J03365674-2035231 | 6dF J0336568-203523 | 3:36:56.75 | -20:35:23.0 | 1689 | 12.422 | 0.645 | 0.0 |
| NGC 1377 | 6dF J0336391-205407 | 3:36:39.07 | -20:54: 7.2 | 1809 | 9.892 | 0.543 | -2.2 |
| ESO 548- G 069 | 6dF J0340362-213132 | 3:40:36.17 | -21:31:32.4 | 1647 | - | 0.344 | 10.0 |
| NGC 1414 | 6dF J0340571-214250 | 3:40:57.14 | -21:42:49.9 | 1752 | - | 0.311 | 4.0 |
| APMUKS(BJ) B034114.27-212912 | 6dF J0343265-211944 | 3:43:26.46 | -21:19:44.2 | 1711 | - | 0.574 | - |
| NGC 1422 | 6dF J0341311-214054 | 3:41:31.07 | -21:40:53.5 | 1680 | 10.973 | 0.357 | 2.3 |
| NGC 1415 | 6dF J0340569-223352 | 3:40:56.86 | -22:33:52.1 | 1659 | 8.388 | 0.239 | 0.5 |
| ESO 482- G 031 | 6dF J0340415-223904 | 3:40:41.54 | -22:39: 4.1 | 1803 | 12.806 | 0.233 | -1.9 |
| ESO 548- G 029 | 3:30:47.17 | -21: 3:29.6 | 1215 | 11.214 | 0.841 | 3.4 | |
| IC 1953 | 3:33:41.87 | -21:28:43.1 | 1867 | 10.100 | 0.535 | 6.7 | |
| ESO 548- G 049 | 3:35:28.27 | -21:13: 2.2 | 1510 | - | 0.487 | 5.6 | |
| IC 1962 | 3:35:37.38 | -21:17:36.8 | 1806 | - | 0.457 | 7.5 | |
| ESO 482- G 018 | 3:38:17.64 | -23:25: 9.0 | 1687 | 11.765 | 0.403 | 0.3 | |
| NGC 1395 | 3:38:29.72 | -23: 1:38.7 | 1717 | 7.024 | 0.260 | -5.0 | |
| MCG -04-09-043 | 3:39:21.57 | -21:24:54.6 | 1588 | - | 0.337 | 2.9 | |
| NGC 1401 | 3:39:21.85 | -22:43:28.9 | 1495 | 9.453 | 0.168 | -2.1 | |
| ESO 482- G 035 | 3:41:14.65 | -23:50:19.9 | 1890 | 10.967 | 0.609 | 2.3 | |
| NGC 1426 | 3:42:49.11 | -22: 6:30.1 | 1443 | 8.762 | 0.399 | -4.8 | |
| ESO 549- G 006 | 3:43:38.25 | -21:14:13.7 | 1609 | - | 0.609 | 9.7 | |
| NGC 1439 | 3:44:49.95 | -21:55:14.0 | 1670 | 8.728 | 0.593 | -5.0 | |
| APMUKS(BJ) B033830.70-222643 | 3:40:41.35 | -22:17:10.5 | 1737 | - | 0.198 | - | |
| ESO 482- G 027 | 3:39:41.21 | -23:50:39.8 | 1626 | - | 0.568 | 10.0 | |
| ESO 548- G 070 | 3:40:40.99 | -22:17:13.4 | 1422 | - | 0.197 | 7.0 | |
| ESO 482- G 036 | 3:42:18.80 | -22:45: 9.2 | 1567 | - | 0.381 | 9.1 | |
| NGC 1332 Group | |||||||
| NGC 1315 | 6dF J0323066-212231 | 3:23: 6.60 | -21:22:30.7 | 1597 | 9.944 | 0.248 | -1.0 |
| 2MASX J03255262-2117204 | 6dF J0325526-211721 | 3:25:52.62 | -21:17:20.6 | 1428 | 11.767 | 0.029 | - |
| NGC 1331 | 6dF J0326283-212120 | 3:26:28.34 | -21:21:20.3 | 1242 | 10.867 | 0.058 | -4.7 |
| NGC 1325 | 6dF J0324256-213238 | 3:24:25.57 | -21:32:38.3 | 1590 | 8.831 | 0.143 | 4.2 |
| ESO 548- G 022 | 6dF J0327422-214159 | 3:27:42.16 | -21:41:58.6 | 1295 | - | 0.209 | 5.0 |
| ESO 548- G 021 | 6dF J0327356-211341 | 3:27:35.57 | -21:13:41.4 | 1745 | - | 0.168 | 7.7 |
| NGC 1325A | 3:24:48.50 | -21:20:11.5 | 1333 | 14.035 | 0.094 | 6.6 | |
| ESO 548- G 011 | 3:24:55.31 | -21:47: 0.6 | 1453 | - | 0.173 | 8.4 | |
| NGC 1332 | 3:26:17.25 | -21:20: 7.2 | 1524 | 7.122 | 0.043 | -3.1 | |
| 2MASX J03263135-2113003 | 3:26:31.34 | -21:13: 0.5 | 1548 | 11.263 | 0.084 | -2.5 |
4 Dynamics
For each group the luminosity-weighted centroid and mean recession velocity were calculated. These and the dynamical parameters calculated using the group members defined by the FOF algorithm are summarised in Table 2.
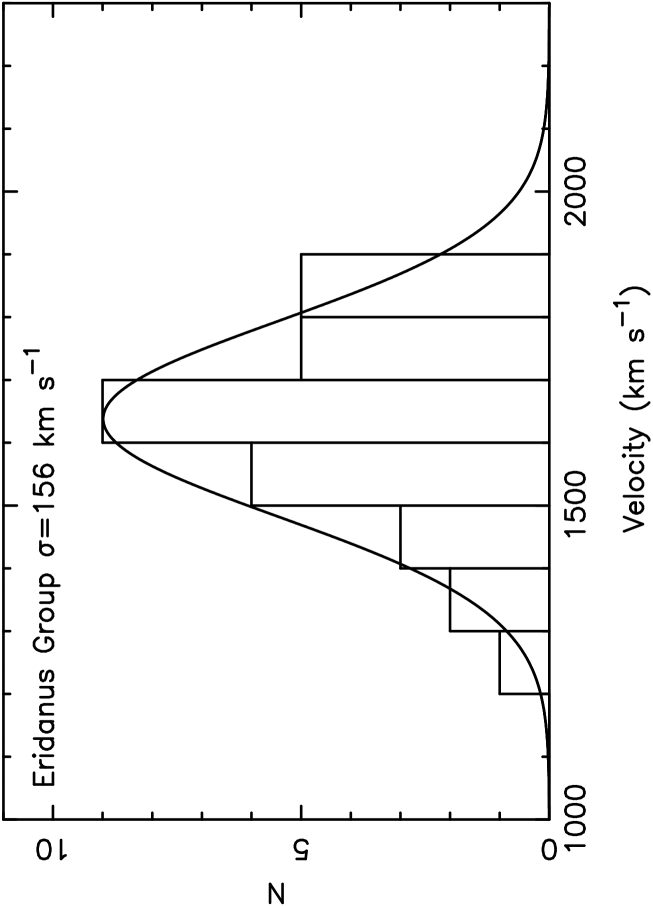
The velocity dispersion, , was calculated using the gapper algorithm. This is insensitive to outliers, giving a robust estimate of for small groups (Beers et al., 1990).
| (2) |
where and . The corresponding errors are estimated using the jackknife algorithm. The velocity distribution of each group with the calculated velocity dispersion overlaid are illustrated in Figure 6.


If these groups are not yet relaxed then there may be evidence of that in their velocity distributions. We examine the higher moments of the velocity distributions using the kurtosis and skew. Kurtosis indicates a difference in the length of tails of the distribution compared to a Gaussian. Zero values indicate a Gaussian distribution whilst positive kurtosis indicates longer tails than a Gaussian distribution. The standard deviation on this quantity is given by . Skewness indicates asymmetry, where zero again indicates Gaussianity and positive skewness implies that the distribution is depleted from values lower than the mean location. The standard deviation on this quantity is given by . Significant deviations from a Gaussian distribution are defined by values greater than the standard deviations on these quantities. All of our groups show large deviations such that none of the groups show significant signs of skewness or kurtosis. We conclude that their velocity distributions are consistent with their being virialized structures.
The crossing time is calculated as a function of the Hubble time () following Huchra & Geller (1982), as:
| (3) |
where the harmonic radius, , is independent of the velocity dispersion and is given below.
| (4) |
where is the distance to the group from the distance modulus of Forbes et al. (2005) i.e. Mpc, is the number of members of each group, and is the angular separation of group members. We calculated the error on using the jackknife method and then used standard error propagation analysis to calculate the rms error on the crossing time. Nolthenius & White (1987) indicate that a crossing time H suggests that a group has not yet had time to virialize.
The virial mass was calculated using the virial mass estimator of Heisler et al. (1985).
| (5) |
where is the observed radial component of the velocity of the galaxy with respect to the systemic group velocity and is its projected separation from the group centre. We estimate the rms error of the mass using the jacknife method (e.g. Biviano et al. 1993).
The radius corresponding to an overdensity of 500 times the critical density – , is calculated as a function of the velocity dispersion following Osmond & Ponman (2004) as,
| (6) |
The rms error on the values were estimated by standard error propagation. In Table 2 we also give the X-ray luminosities for these groups. For the NGC 1407 and NGC 1332 groups these were calculated by Osmond & Ponman (2004) using their values. The X-ray luminosity for the Eridanus group is calculated by Omar & Dwarakanath (2005a) for NGC 1395 in Eridanus.
The mass-to-light ratios were calculated by dividing the virial mass by the sum of the luminosities of the member galaxies for both the - and -bands. The errors were estimated using standard error propagation.
The spiral fraction, , was calculated as the fraction of galaxies in each group with mag and T-type . The errors quoted in Table 2 are the poisson errors on this value.
| NGC 1407 | Eridanus | NGC 1332 | |
|---|---|---|---|
| Centroid (J2000) | 03:40:02, | 03:38:32, | 03:25:50, |
| -18:35:03 | -22:18:51 | -21:22:8 | |
| Members | 19 (14) | 31 (18) | 10 (6) |
| (km s-1) | 1658 | 1638 | 1474 |
| Max. radial extent (Mpc) | 0.5 | 0.8 | 0.3 |
| (km s-1) | 372 | 156 | 163 |
| Skewness | -0.380.56 | -0.530.44 | 0.050.77 |
| Kurtosis | -1.361.12 | -0.140.88 | -1.281.55 |
| (H) | 0.02 | 0.03 | 0.02 |
| M | 5.3 | 0.9 | 0.6 |
| (Mpc) | 0.51 | 0.21 | 0.22 |
| Log (erg s | 41.920.02 | 40.83 | 40.930.02 |
| 230 | 27 | 35 | |
| 0.14 | 0.56 | 0.20 |
In order to determine how the FOF definition of membership affects the dynamical properties of these groups, we also examined the properties of groups consisting of all galaxies within the maximum radial extent of the groups defined by FOF. Their velocity-distance relationships are illustrated in Figure 7, and the associated parameters given in Table 3.
It is clear from Table 3 that the derived mean recession velocities, velocity dispersions and radii are, within the errors, consistent with those determined using the FOF membership and are clearly robust to the definition of group membership. However, when all galaxies are considered, the velocity dispersions are larger than the FOF measurements, hence the virial masses are larger


| NGC 1407 | Eridanus | NGC 1332 | |
|---|---|---|---|
| Members | 25 | 39 | 11 |
| (km s-1) | 1652 | 1657 | 1475 |
| (km s-1) | 384 | 179 | 198 |
| M | 7.9 | 2.1 | 1.4 |
| (Mpc) | 0.53 | 0.24 | 0.27 |
4.1 Evaluating the Effects of Incompleteness
We tested for the effects of incompleteness on our analysis by reducing the sample to those 121 galaxies with mag, at which point we know that our sample is complete. We then re-ran our group-finder and re-calculated the dynamical parameters for each group. We iterated this process increasing the limiting magnitude, , by mag each time.
At each iteration, three individual groups are found in the supergroup region. Therefore, the structure we are examining is robust to the effects of incompleteness.
In Figure 8, we illustrate how the dynamical parameters of these three groups vary with increasing magnitude limit. We study the number of galaxies in each group, the spiral fractions in those groups ( galaxy populations) and the velocity dispersions of those groups ( group mass). It is worth noting that all three parameters of all three groups reach a plateau at mag, the 2MASS apparent-magnitude limit. Examining Figure 8 it is clear that increasing the number of galaxies in the sample increases the number of galaxies in each group. The spiral fraction in each group also rises, although the spiral fractions calculated for a limiting magnitude mag are, within the errors, consistent with those calculated for the whole sample. The velocity dispersion also rises with an increasing number of galaxies in the sample. For the NGC 1332 and Eridanus groups the velocity dispersions calculated for a limiting magnitude mag are, within the errors, consistent with those calculated for the whole sample. However, for the NGC 1407 group the velocity dispersion of the whole sample is significantly larger than that calculated for the sample limited to mag. It is known that velocity dispersions calculated for undersampled groups are lower than they are in reality. It is therefore difficult to determine whether the significant change in the velocity dispersion of the NGC 1407 group with increasing magnitude limit is due to undersampling in the sample limited to or incompleteness in the whole sample. We test the effects of incompleteness by randomly removing a percentage of the dataset with magnitudes mag. We repeat the random removal 1000 times, and calculate the mean difference and the error on that mean. For the NGC 1407 group, removing 10 per cent of the faint-end of the sample results in (km s-1), removing 20 per cent (km s-1), and removing 40 per cent (km s-1). These values are all significantly lower than the observed difference and therefore the increase in with increasing limiting magnitude cannot be due to incompleteness in the sample. Rather it is more likely to be a result of better sampling of this group due to larger number statistics. We therefore conclude that the results we present are robust to the effects of incompleteness.

4.2 Individual Group Properties
4.2.1 NGC 1407 Group
The NGC 1407 group centroid defined by our FOF analysis is 121 km s-1 and 16 kpc away from the brightest galaxy in the group, the large elliptical NGC 1407. This difference is within the error of the mean recession velocity and the position of NGC 1407 itself. Thus, the brightest group galaxy, NGC 1407, lies at the spatial and kinematic centre of the group. The numbers of galaxies and mean velocity found are close to that determined by Osmond & Ponman (2004), who find km s-1. The FOF algorithm does not find NGC 1400 (at a recession velocity of km s-1) to be a member of this group. This is in contrast to previous work (e.g. Gould 1993; Quintana et al. 1994; Perrett et al. 1997; Tonry et al. 2001; Forbes et al. 2005) that suggests that this galaxy is actually at the same distance as NGC 1407. Table 3 shows that including NGC 1400 in the group does not have a significant effect on the derived velocity dispersion.
The velocity dispersion measured here is consistent with that measured by Osmond & Ponman (2004), i.e. km s-1. Miles et al. (2004) observe a dip in the luminosity function of groups with log erg s-1 and conclude that such groups are the present sites of rapid merging. The X-ray luminosity of the NGC 1407 group is higher than this, suggesting that it is unlikely to be undergoing rapid dynamical evolution at this time. The high mass-to-light ratio, low kurtosis and skewness, low spiral fraction, symmetric intra-group X-ray emission, bright central elliptical galaxy and short crossing time all indicate that this structure is virialized.
4.2.2 Eridanus Group
In contrast to the NGC 1407 group, the Eridanus group is not centred on any one galaxy. The brightest galaxy in the group, the large elliptical NGC 1395 with its galaxy group-sized X-ray halo, is 300 kpc and 79 km s-1 away from the centre defined by the FOF code. The Eridanus group is made up of more galaxies than the NGC 1407 group () but is a much looser, irregular structure. This is echoed in its high spiral fraction and low velocity dispersion.
4.2.3 NGC 1332 Group
The NGC 1332 group centroid is km s-1 and 43 kpc from the position of the brightest galaxy in the group, the large lenticular NGC 1332 and its associated X-ray emission. This is within the error of the mean recession velocity and the position of NGC 1332. Thus, similar to the NGC 1407 group, the brightest group galaxy, NGC 1332, lies at the spatial and kinematic centre of the group. This group has fewer galaxies () than either NGC 1407 or Eridanus. Osmond & Ponman (2004) found the same number of galaxies associated with this group at a similar recession velocity ( km s-1). The measured velocity dispersion is within the errors of that measured by Osmond & Ponman (2004), i.e. km s-1. The measured velocity dispersion is small, consistent with it being a low-mass group. Its skewness and kurtosis are consistent with virialisation. Its spiral fraction is similar to that of the NGC 1407 group. These properties suggest that NGC 1332 group is a low-mass, compact, virialized group with a galaxy population similar to that of a much more massive group like NGC 1407. However, its lack of intra-group X-ray emission suggests that it is not as dynamically mature as the NGC 1407 group.
4.3 The Eridanus Region – A Supergroup?
A supergroup is a group of groups that will eventually merge to form a cluster. In order to determine whether the three groups in the Eridanus region form a supergroup it is important to establish whether the groups are actually bound to one another.
We use the Newtonian binding criterion that a two-body system is bound if the potential energy of the bound system is equal to or greater than the kinetic energy. To assess the likelihood that the individual groups are bound to one another we require (e.g. Beers et al. 1982; Gregory & Thompson 1984; Cortese et al. 2004):
| (7) |
where is the total mass of the system, is the relative velocity between the groups, sin corrects for the projection effects, is the projected distance between the groups and cos corrects for projection. We analyse the three pairs of groups separately and give the variables used in the analysis for each pair in Table 4. The hashed regions in Figure 9 illustrate the solutions to Equation 7 for each pair of groups.
Considering the solid angles over which the systems are bound, given the observed relative velocity, we calculate the probabilities that each two-body system is bound following Girardi et al. (2005):
| (8) |
where the system is bound between angles and given the observed relative velocity. These probabilities are given for each pair in Table 4. Whilst the Eridanus and NGC 1407 pair is likely to be bound at the 96 per cent level, and the NGC 1407 and NGC 1332 pair at the 70 per cent level, the Eridanus and NGC 1332 pair are only likely to be bound at the 40 per cent level. As the conservative estimate that the three groups are bound is based on the minimum probability that each of the three pairs are bound, the low probability of the Eridanus and NGC 1332 pair being bound means that this system is not bound. However, individual groups are clearly showing close relationships.
| Group Pair | |||||||
|---|---|---|---|---|---|---|---|
| (km s-1) | (Mpc) | (per cent) | (per cent) | (per cent) | (per cent) | ||
| Eridanus & NGC 1407 | 6.2 | 2026 | 1.6 | 96.5 | 1.8 | 31 | 68 |
| Eridanus & NGC 1332 | 1.5 | 163 | 1.2 | 46 | 100 | - | - |
| NGC 1407 & NGC 1332 | 5.9 | 184 | 1.4 | 70 | 1.3 | 44 | 55 |
| Supergroup & Fornax | 13.7 | 186 | 5.9 | 56 | 100 | - | - |
We study this further by applying the two-body analysis described by Beers et al. (1982) to each pair. The two bodies are treated as point masses moving on radial orbits. They are assumed to start their evolution at time with no separation and are moving apart or coming together for the first time in their history. For bound radial orbits, the parametric solutions to the equations of motion are:
| (9) |
| (10) |
| (11) |
where is the components separation at time , is the separation of the components at maximum expansion, is the developmental angle and is their real, relative velocity. The observables and are related to the real parameters by:
| (12) |
We close the equations by setting Gyrs, the age of the Universe in a CDM cosmology. We can then solve the equations above for and using Equation 6 from Gregory & Thompson (1984):
| (13) |
These solutions are illustrated by the dashed (bound-outgoing; ) and dot-dashed (bound-incoming; ) lines in Figure 9. For some pairs of groups there are two solutions to the bound-incoming case within our observed relative velocities, owing to the ambiguity in the projection angle, . These are denoted and . We calculate the probabilities , and again following Girardi et al. (2005) by considering the range of solutions that are consistent with the observed relative velocities. Therefore,
| (14) |
| (15) |
| (16) |
where the angles etc. are the angular limits of the solutions and,
| (17) |
These probabilities are also given in Table 4. We find that the Eridanus and NGC 1407 pair is likely to be bound and incoming (i.e. contracting) at the 98.2 per cent level. The NGC 1407 and NGC 1332 group pair is also likely to be bound and incoming at the 98.7 per cent level. The bound-incoming solution for the Eridanus and NGC 1332 pair is unlikely given the observed relative velocities between the two groups, the bound-outgoing solution is therefore the most likely.
Beers et al. (1982), Gregory & Thompson (1984) and Cortese et al. (2004) also provide the parametric solutions for the unbound case:
| (18) |
| (19) |
| (20) |
where is the asymptotic expansion velocity. As for the bound case, we can then solve the equations above for and using Equation 6 from Gregory & Thompson (1984):
| (21) |
The solutions to the unbound case are plotted in Figure 9 as dotted lines. The relative velocities we observe are clearly inconsistent with the unbound orbits in all cases.
The calculated probabilities show that it is unlikely that the three Eridanus groups form a gravitationally bound structure. However, the Eridanus and NGC 1407 groups and, at a lesser level, the NGC 1407 and NGC 1332 groups are individually bound. The two-body orbital analysis then suggests that the Eridanus and NGC 1332 groups are falling into the NGC 1407 group. Which may explain why we do not find the Eridanus and NGC 1332 groups to be bound to one another. We therefore conclude that these groups do form a supergroup, that will merge in the future by dynamical friction to form a cluster.
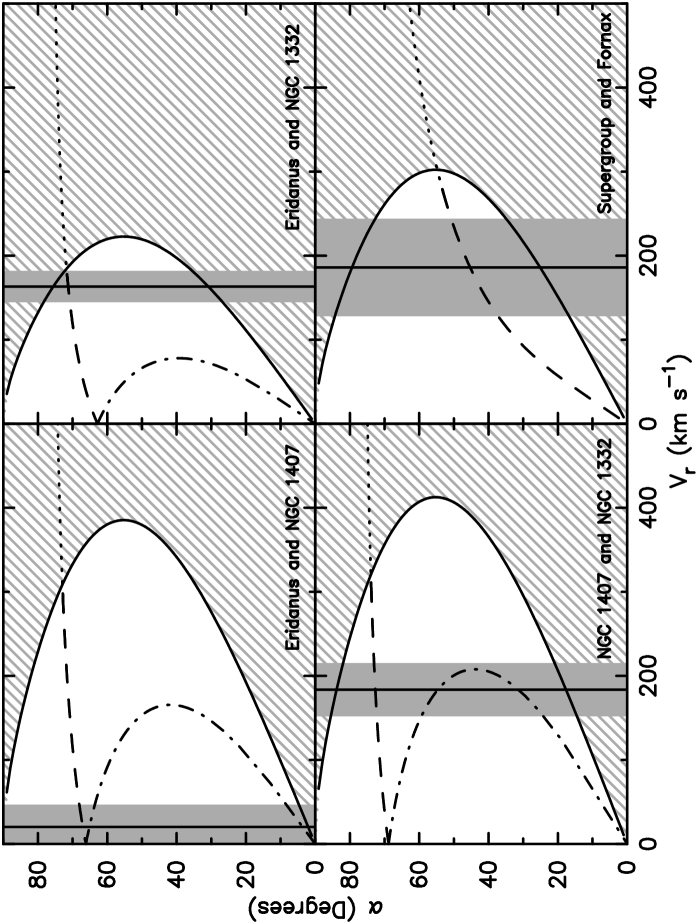
Using the equations above it is also possible to determine whether the supergroup-structure as a whole is bound to the Fornax cluster. The FOF code also provides parameters for Fornax ( km s-1, , centred on J2000). The parameters and probabilities for the supergroup–Fornax pair are given in Table 4. In summary, we find that the supergroup is bound to the Fornax cluster at the 56 per cent level, which is not significantly probable. Interestingly, given the observed properties of the two systems, only bound-outgoing solutions are applicable. We therefore conclude that the supergroup may be bound to the Fornax cluster, and if so, it is currently moving away from that system.
Studies of intra-cluster X-ray emission have concluded that substructures are common features of clusters of galaxies with per cent of clusters with redshifts showing substructure in their X-ray distributions (Jones & Forman, 1999). However, these subclusters already share common, massive, potential wells, as evidenced by their X-ray emission. The subcluster systems are, therefore, significantly more evolved than the supergroup structure examined here. Only 1 of the 25 low-richness clusters studied by Burgett et al. (2004) shows any similarity with the Eridanus supergroup: Abell 1750 is made up of four sub-clumps, two of which show extended intra-clump X-ray emission, at similar separations to those between the groups observed here. However, it is at a much higher redshift () than Eridanus.
The three groups in the Eridanus region form a rare, local example of a supergroup. Owing to its proximity to us it can be studied in more detail than similar structures at higher redshifts. It is, therefore, important to examine the properties of its constituent galaxies and compare them to previous work on larger scales.
5 Galaxy Properties
Previous studies examining the effects of environment on galaxy evolution have shown that luminous, red, early-type galaxies inhabit the cores of clusters and that the star formation rates of cluster galaxies are lower compared to the field population (e.g. Faber 1973; Oemler 1974; Visvanathan & Sandage 1977; Dressler 1980; Butcher & Oemler 1984). This has recently been established to occur at clustercentric radii of virial radii, equivalent to projected surface densities of galaxy Mpc-2 (e.g. Lewis et al. 2002; Gómez et al. 2003; Balogh et al. 2004).
Studying such a large area of sky means that our galaxy sample encompasses a wide range of environments, from the dense cluster environment of the Fornax cluster, through the Eridanus supergroup to the galaxies in the field around. This allows us to examine the effects of a wide range of environments on a sample of galaxies.
We calculated the local galaxy density of each galaxy as the projected surface density of the 5 nearest neighbours to that galaxy within km s-1 (; Balogh et al. 2004; Tanaka et al. 2004). The effects of edges in the plane of the sky were solved by excluding any galaxy whose 5th nearest neighbour is further away than the closest survey boundary, since the density of these galaxies is not correctly estimated (c.f. Balogh et al. 2004; Tanaka et al. 2004, 2005). These galaxies are still used in the local density calculation of other galaxies. To solve the effects of our velocity limit, we extended the data to recession velocities of 3500 km s-1 such that our density calculations are accurate to 2500 km s-1. We find that densities of 75–250 Mpc-2 correspond to the centre of the Fornax cluster whilst Mpc-2 corresponds to the density around the NGC 1407 galaxy, Mpc-2 to the NGC 1332 galaxy and Mpc-2 around the NGC 1395 galaxy.
Using the apparent-magnitude limited sample of 185 galaxies with 2MASS -band magnitudes mag and accurate density measurements, of which 183 have total -band magnitudes and 178 have morphological T-types, we are able to examine the distribution with environment of these properties.
In order to test the effects of incompleteness in this dataset we also repeated these analyses for the sample limited to 11 mag, and we find no change in the conclusions we present below.
5.1 Colours
The colours of galaxies follow a bimodal distribution (e.g. Balogh et al. 2004; Baldry et al. 2004; Blanton et al. 2005) depending on their luminosity, and also their environment. The reddest galaxies have long been known to have the highest luminosities (e.g. Faber 1973; Visvanathan & Sandage 1977) whilst the fraction of red galaxies is higher in the densest environments (e.g. Oemler 1974; Butcher & Oemler 1984; Kodama et al. 2001; Girardi et al. 2003). Previous analyses of the group environment have found that the colours of galaxies in groups are redder than those in the field (Girardi et al., 2003; Tovmassian et al., 2004).
In order to examine the relationship between colour and environment, we correct the galaxies to a specific mass by correcting the colours of the galaxies to the colour they would have at a specific magnitude, based on the slope of the colour-magnitude relation, , i.e. (c.f. Kodama et al. 2001; Tanaka et al. 2005). We therefore fit a colour-magnitude relation to our data. We use the non-parametric IRAF/STSDAS/STATISTICS/Buckley-James algorithm which uses the Kaplan-Meier estimator for the residuals to calculate the regression. The best-fit straight line to all 183 apparent-magnitude limited galaxies, is given by
| (22) |
with an rms scatter mag, and is shown in Figure 10.
Comparing with previous studies (e.g. Baldry et al. 2004; Blanton et al. 2005), it is evident that a strong red sequence is visible above the fitted colour-magnitude relation and a blue galaxy population is present below. The blue galaxy population is smaller than the red sequence, as would be expected at these magnitudes from the colour functions of Baldry et al. (2004).

The colours of the galaxies are corrected to the colour they would possess at a magnitude of , assuming the colour-magnitude relation fitted above. These corrected colours are compared with their projected surface density in Figure 11. A shallow trend of redder colour with increasing galaxy density is observed. A non-parametric Spearman rank correlation gives a correlation coefficient of . For 183 galaxies, the Student’s t-test rejects the null hypothesis that there is no correlation at per cent confidence level. Thus galaxies in the densest environments are redder than those in the least dense environments.

However, the relationship between colour and density does not show a sharp transition as observed by Kodama et al. (2001) and Tanaka et al. (2004), or by Lewis et al. (2002) and Gómez et al. (2003) in galaxy star formation rates with density. It is somewhat surprising that we do not observe this sharp transition as we study the same range of projected surface densities (after correcting for different values of ). However, the previous studies all had samples at least times larger (e.g. Gómez et al. 2003 with 8598 galaxies) than that available here.
We therefore examined the data to determine whether there is a density at which the colours of the galaxies in denser environments are significantly different to those in less dense environments. We calculated the probability, given by a non-parametric, two-tailed Kolmogorov-Smirnov (KS) test, that the galaxies in the high- and low-density subsamples are drawn from the same parent population. The minimum in this probability occurs at a projected local surface density of galaxies Mpc-2 with a probability of 99.98 per cent that the high- and low-density samples are not drawn from the same parent population. As this probability was determined a posteriori we examine the significance of this result using a Monte-Carlo simulation of the galaxy colours, randomized with respect to their surface density to remove the correlation with environment. Repeating this 1000 times, the minimum in the probability distribution never rose to 99.98 per cent. We conclude that the colours of the galaxies in the high- and low-density samples are not drawn from the same parent population with a probability of 99.98 per cent.
This density is not a break density as there is no sharp transition in the colours of the galaxies, it marks the density at which the colours of the galaxies in the lowest density environments are most different to those in the highest density environments. A local projected surface density of galaxies Mpc-2 corresponds to the density of galaxies on the outskirts of the supergroup structure and other surrounding groups. It is slightly higher than the break densities observed by Lewis et al. (2002); Gómez et al. (2003) and Balogh et al. (2004), galaxies Mpc-2 but is consistent with the break observed by Tanaka et al. (2004), galaxies Mpc-2. Tanaka et al. (2004) ascribe the difference in density to the shallower magnitude cuts used in Lewis et al. (2002); Gómez et al. (2003) and Balogh et al. (2004). We use an equivalent magnitude cut to Tanaka et al. (2004) and, taking that into account, this dividing density is in agreement with previous estimates of break densities. We therefore conclude that there are signs of a difference in colour with density around a density of galaxies Mpc-2, and that this value is consistent with previous estimates of break densities, however a significantly larger sample is required to determine whether this would translate into a sharp transition.
5.2 Morphologies and Luminosities
The morphology-density relation (e.g. Dressler 1980; de Propris et al. 2003) is one of the best known segregation effects of galaxies: early-type galaxies are preferentially found in the densest regions of the Universe. The luminosity functions of galaxies are also known to change with their environment. Ferguson & Sandage (1991); Zabludoff & Mulchaey (2000); Girardi et al. (2003); Croton et al (2005) and Wilman et al. (2005) all observe that the luminosity functions of galaxies in groups have more bright galaxies and less faint galaxies than the luminosity functions of galaxies in the field. However, Croton et al (2005) show that the mean luminosity of the galaxies does not change with environmental density over the range of environments they study (i.e. void to cluster).
Figure 12 compares the morphological distribution of galaxies with the projected local surface density. As a scatter plot of the T-types says more about the divisions used to define the morphologies, we also indicate the fraction of spiral galaxies (T-type ) in each density bin. There is a clear dependence of morphology on projected surface density with galaxies in the least dense environments consisting almost solely of spiral galaxies, reproducing the morphology-density relationship.

We examine the distribution of the galaxy magnitudes with their projected surface density in Figure 13. Whilst we correct the colours of the galaxies to a standard magnitude, as a proxy for a standard mass, in Figure 11, we do not show the luminosities corrected to a standard colour here. Adopting this correction has no effect on the results we obtain. A shallow trend of brighter median luminosity with increasing galaxy density is observed. A non-parametric Spearman rank correlation gives a correlation coefficient of . For 183 galaxies, the Student’s t-test rejects the null hypothesis that there is no correlation at per cent confidence level. Thus galaxies in the densest environments are brighter than those in the least dense environments.

6 Neutral Hydrogen
Wide-field neutral hydrogen (HI) observations of the NGC 1407 and NGC 1332 groups were made as part of the GEMS project using the Parkes radiotelescope (see Kilborn et al. 2006 for details of the observations and data reduction). A 5.5 5.5 degree region was mapped around each of the groups, to a sensitivity of . Figure 14 shows a velocity integrated map of the HI emission in the region of NGC 1332 and NGC 1407. It is clear that the HI emission is quite different for the two groups – the NGC 1407 group shows a total lack of HI in the centre of the group, while the HI emission is more central for the NGC 1332 group. The total HI mass within for the NGC 1407 group is just , with all the HI contained in one spiral galaxy, NGC 1390. This gives a group ratio of 0.002. The radius for NGC 1332 is much smaller than that of NGC 1407, and the total HI mass contained is , with two galaxies containing the HI, (NGC 1325 and NGC 1325A). This gives a group ratio of 0.12. The HI content of the NGC 1332 group is nearly two orders of magnitude greater than the HI content of the NGC 1407 group.
Omar & Dwarakanath (2005a, b) have made HI observations of selected galaxies in the Eridanus region using the Giant Meterwave Radio Telescope (GMRT) in India. If we compare our HI results to that of Omar & Dwarakanath (2005b), we see that for our overlapping galaxies, our HI masses are very similar. Their targeted observations are more sensitive than GEMS, and they detect three more late-type galaxies in HI in the NGC 1407 group – ESO 548- G 065, ESO 548- G 072 and ESO 549- G 002. All of these galaxies are at group-centric radii kpc and are HI deficient with regards to their optical type and luminosity, with ESO 548- G 072 and ESO 549- G 002 containing about one quarter as much HI as expected (Omar & Dwarakanath, 2005b). They also analyse the Eridanus group, but because they target a few individual galaxies for observation rather than scanning the whole area it is not possible to calculate the total HI mass within that region from their observations. Omar & Dwarakanath (2005b) postulate that the gas removal mechanism for galaxies in the Eridanus region is tidal interactions rather than ram pressure stripping.
7 Discussion and Conclusions
We have defined a supergroup as a group of groups that will eventually merge to form a cluster and examined a possible supergroup in the direction of the Eridanus constellation.
Our FOF analysis has determined that the region is made up of three individual groups, with varying properties: The NGC 1407 group is a massive group with symmetric intra-group X-ray emission centred on the large central elliptical galaxy, implying that this is a dynamically mature group. In contrast, the Eridanus group is a low-mass, irregular group with a high spiral fraction. It is not centred on any one galaxy and the spatial offset of the X-ray emission signifies that this group is dynamically young. The NGC 1332 group is a compact, low-mass group with a low spiral fraction, however there is no X-ray emission associated with this group, only with the central galaxy NGC 1332.
Our analysis of the dynamics of these groups indicates that, whilst the three groups are not gravitationally bound to one another, they are likely to merge into a single poor cluster, of mass . Furthermore, they may also be bound and expanding away from the Fornax cluster. We therefore conclude that Eridanus is a supergroup.
Previous studies of clusters of galaxies have determined that a large proportion of clusters show substructure in their X-ray properties and/or galaxy velocity distributions. However, this substructure is usually within a radius of Mpc of the cluster centroid (Burgett et al., 2004) and the structures share X-ray haloes with their host cluster, indicating that they are more compact, more massive and more tightly bound than the supergroup examined here. This supergroup is also a much less massive system than the one discovered by Gonzalez et al. (2005), i.e. SG 1120-1202 with . However, that supergroup is at a redshift and is made up of at least four individual groups, each of which have extended X-ray haloes, indicative of dynamically mature group structures.
Although one expects clusters to form from the merging of small galaxy group sized structures, this is expected to happen predominantly at high redshifts, . However, the properties and ratio of masses of the individual groups studied here argue that the supergroup consists of one massive, relaxed group (the NGC 1407 group) that formed at those epochs and now has two less massive groups falling in to form a cluster-mass structure. The merging timescale predicted for this mass of structure indicates that a recession velocity km s-1 places it at the tail-end of the likely formation times (Lacey & Cole, 1993), but still entirely consistent with the predictions of hierarchical structure formation in a CDM Universe.
An examination of the properties of the galaxies in this region indicates that the morphological T-types show a clear morphology-density relation. The three groups studied here have slightly higher spiral fractions than that of the Fornax cluster, consistent with their lower projected surface densities. The galaxy colours do not show a sharp transition, or break with density. However, the distribution of the colours with density shows the most difference around a projected surface density of galaxies Mpc-2. This density is significantly less than that within the supergroup structure itself and is equivalent to that of galaxies surrounding the supergroup and in outlying groups. This indicates that the colours and luminosities of the galaxies within the Eridanus supergroup are already similar to those of the dense core of a cluster like Fornax, whilst their morphologies show a higher fraction of spiral galaxies, consistent with their lower densities.
The galaxies within the supergroup are already similar to those in the Fornax cluster and thus any change is occuring at significantly lower densities. If the differences in galaxy properties with environment are due to nurture then these observations limit possible mechanisms for transforming the galaxies from blue, late-types to red, early-types by their environment to those which are active at low densities. We note that SPH/N-body simulations have shown that ram pressure stripping of cold gas is only effective in the cores of rich systems, where galaxies are moving at high speeds and there is a dense, hot, intracluster medium (Abadi et al., 1999; Quilis et al., 2000). Further simulations suggest that tidally induced collisions of galaxy disk gas clouds should also only be effective in dense clusters (Byrd & Valtonen, 1990). Harrassment, where galaxies in rich systems undergo high-velocity interactions with other galaxies, is also only effective in very dense environments (e.g. Moore et al. 1996). The densities of groups are not high enough for any of these processes to be responsible for the relationship of galaxy colour and morphology with environment. In contrast, mergers are much more likely in the group environment as the velocity of the encounter is similar to the orbital timescale within the galaxy (e.g. Barnes 1985). Strangulation, where galaxies lose their halo of gas as they fall in to the larger halo of a group or cluster leading to a slow decline in SFR as the galaxy consumes the remaining cold gas, is also more likely in the group environment (e.g. Balogh et al. 2000). The detection of HI deficient galaxies in the NGC 1332 group, where no intra-group X-ray emission exists, suggests that the gas-removal processes cannot be entirely due to ram pressure stripping.
This is a rare example of a supergroup in the local Universe. The mass ratios and properties of the individual groups are consistent with the predictions of hierarchical structure formation in a Universe. The properties of the constituent galaxies indicate that they are already similar to those of a cluster and that this is likely to be a result of merging or strangulation processes in group density environments.
Acknowledgments
SB would like to thank Chris Power, Huw Jones, Peder Norberg, Phil James and Marisa Girardi for helpful discussions. We would also like to thank the anonymous referee for their helpful suggestions that have improved the paper. This publication makes use of data products from the Two Micron All Sky Survey (2MASS) which is a joint project of the University of Massachusetts and the Infrared Processing and Analysis Center/California Institute of Technology, funded by the National Aeronautics and Space Administration and the National Science Foundation. This research has made use of the NASA/IPAC Extragalactic Database (NED) which is operated by the Jet Propulsion Laboratory, California Institute of Technology, under contract with the National Aeronautics and Space Administration. It has also made use of the HyperLEDA database.
References
- Abadi et al. (1999) Abadi M. G., Moore B., Bower R. G., 1999, MNRAS, 308, 947
- Abazajian et al. (2003) Abazajian K. et al. 2003, AJ, 126, 2081
- Baker & Shapley (1933) Baker R. H., Shapley H., 1933, Annals of the Astronomical Observatory of Harvard College, 88, 77
- Baldry et al. (2004) Baldry I. K., Glazebrook K., Brinkmann J., Ivezić ., Lupton R. H., Nichol R. C., Szalay A. S., 2004, ApJ, 600, 681
- Balogh et al. (1997) Balogh M. L., Morris S. L., Yee H. K. C., Carlberg R. G., Ellingson E., 1997, ApJ, 488, 75
- Balogh et al. (1998) Balogh M. L., Schade D., Morris S. L., Yee H. K. C., Carlberg R. G. & Ellingson E., 1998, ApJ, 504, L75
- Balogh et al. (2000) Balogh M. L., Navarro J. F., Morris S. L., 2000, ApJ, 540, 113
- Balogh et al. (2004) Balogh M. L., Baldry I. K., Nichol R., Miller C., Bower R., Glazebrook K., 2004, ApJ, 615, 101
- Balogh et al. (2004) Balogh M. L. et al., 2004, MNRAS, 348, 1355
- Barnes (1985) Barnes J., 1985, MNRAS, 215, 517
- Barton et al. (1996) Barton E., Geller M., Ramella M., Marzke R. O., da Costa L. N., 1996, AJ, 112,87
- Beers et al. (1982) Beers T. C., Geller M. J., Huchra J. P., 1982, ApJ, 257, 23
- Beers et al. (1990) Beers T. C., Flynn K., Gebhardt K., 1990, AJ, 100, 32
- Biviano et al. (1993) Biviano A., Girardi M., Giuricin G., Mardirossian F., Mezzetti M., 1993, ApJ, 411, 13
- Blanton et al. (2003) Blanton M. R. et al., 2003, ApJ, 594, 186
- Blanton et al. (2005) Blanton M. R., Eisenstein D., Hogg D. W., Schlegel D. J., Brinkmann J., 2005, ApJ, 629, 143
- Blumenthal et al. (1984) Blumenthal G. R., Faber S. M., Primack J. R., Rees M. J., 1984, Nature, 311, 517
- Burgett et al. (2004) Burgett W. S., 2004, MNRAS, 352, 605
- Butcher & Oemler (1984) Butcher H., Oemler A. Jr., 1984, ApJ, 285, 426
- Byrd & Valtonen (1990) Byrd G., Valtonen M., 1990, ApJ, 350, 89
- Cole et al. (2000) Cole S., Lacey C. G., Baugh C. M., Frenk C. S., 2000, MNRAS, 319, 168
- Cortese et al. (2004) Cortese L., Gavazzi G., Boselli A., Iglesias-Paramo J., Carrasco L., 2004, A&A, 425, 429
- Colless et al. (2001) Colless M. et al., 2001, MNRAS, 328, 1039
- Croton et al (2005) Croton D. J., 2005, MNRAS, 356, 1155
- da Costa et al. (1988) da Costa, L. N. et al., 1988, ApJ, 327, 544
- da Costa et al. (1998) da Costa, L. N. et al., 1998, AJ, 116, 1
- de Propris et al. (2003) de Propris R. et al., 2003, MNRAS, 342, 725
- de Vaucouleurs (1975) de Vaucouleurs G., 1975, Stars and stellar systems, 9, 557
- Diaferio et al. (1999) Diaferio A., Kauffmann G., Colberg J. M., White S. D. M., 1999, MNRAS, 307, 537
- Dressler (1980) Dressler A., 1980, ApJ, 236, 351
- Dressler et al. (1997) Dressler A. et al., 1997, ApJ, 490, 577
- Eke et al. (2004) Eke V. R. et al., 2004, MNRAS, 348, 866
- Faber (1973) Faber S. M., 1973, ApJ, 179, 731
- Ferguson & Sandage (1991) Ferguson H. C., Sandage A., 1991, AJ, 101, 765
- Forbes et al. (2005) Forbes D. A. et al. 2005, submitted to MNRAS
- Garcia (1993) Garcia A. M., 1993, A&AS, 100, 47
- Girardi et al. (2003) Girardi M., Mardirossian F., Marinoni C., Mezzetti M. & Rigoni E., 2003, A&A, 410, 461
- Girardi et al. (2005) Girardi M., Demarco R., Rosati P., Borgani S. 2005, A&A, 442, 29
- Giuricin et al. (2000) Giuricin G., Marinoni C., Ceriani L., Pisani A., 2000, ApJ, 543, 178
- Gnedin (2003) Gnedin O. Y. 2003, ApJ, 582, 141
- Gómez et al. (2003) Gómez P. L. et al., 2003, ApJ, 584, 210
- Gonzalez et al. (2005) Gonzalez A. H., Tran K. H., Conbere M. N. & Zaritsky D., 2005, ApJ, 624, 73
- Gould (1993) Gould A., 1993, ApJ, 403, 37
- Gregory & Thompson (1984) Gregory S. A., Thompson L., ApJ, 286, 422
- Gunn & Gott (1972) Gunn J. E., Gott J R., 1972, ApJ, 176, 1
- Hambly et al. (2001) Hambly N. C. et al., 2001, MNRAS, 326, 1279
- Hashimoto et al. (1998) Hashimoto Y., Oemler A. Jr., Lin H., Tucker D. L., 1998, ApJ, 499, 589
- Hashimoto & Oemler (2000) Hashimoto Y., Oemler A. Jr., 2000, ApJ, 530, 652
- Heisler et al. (1985) Heisler, Tremaine, Bahcall 1985, ApJ, 298, 8
- Helsdon & Ponman (2000) Helsdon S. F., Ponman T. J., 2000, MNRAS, 315, 356
- Hilton et al. (2005) Hilton M., 2005, MNRAS, accepted
- Huchra & Geller (1982) Huchra J. P., Geller M. J., 1982, ApJ, 257, 423
- Jarrett et al. (2000) Jarrett T. H., Chester T., Cutri R., Schneider S., Skrutskie M. & Huchra J. P., 2000, AJ, 119, 2498
- Jensen et al. (2003) Jensen J. B. et al., 2003, ApJ, 583, 712
- Jones & Forman (1999) Jones C., Forman W., 1999, ApJ, 511, 65
- Jones et al. (2004) Jones D. H. et al., 2004, MNRAS, 355, 747
- Jones et al. (2005) Jones D. H., Saunders W., Read M., Colless M., 2005, astro-ph/0505068
- Kauffmann et al. (2004) Kauffmann G. et al., 2004, MNRAS, 353, 713
- Kilborn et al. (2005) Kilborn V. A. Koribalski B. S., Forbes D. A., Barnes D. G., Musgrave R. C., 2005, MNRAS, 356, 77
- Kilborn et al. (2006) Kilborn V. A. et al., 2006, in preparation
- Kochanek et al. (2001) Kochanek C. S. et al., 2001, ApJ, 560, 566
- Kodama et al. (2001) Kodama, T., Smail, I., Nakata, F., Okamura, S., Bower, R. G. 2001, ApJL, 562, 9
- Lacey & Cole (1993) Lacey C. G., Cole S., 1993, MNRAS, 262, 627
- Lares et al. (2004) Lares M., Lambas D. G., Sánchez A. G., 2004, MNRAS, 352, 501
- Larson et al. (1980) Larson R. B., Tinsley B. M., Caldwell C. N., 1980, ApJ, 237, 692
- Lewis et al. (2002) Lewis I. et al., 2002, MNRAS, 334, 673
- Marinoni et al. (1998) Marinoni C., Monaco P., Giuricin G., Costantini B., 1998, ApJ, 505, 484
- Mieske et al. (2004) Mieske S., Hilker M., Infante L., 2004, A&A, 418, 445
- Miles et al. (2004) Miles T. A., Raychaudhury S., Forbes D. A., Goudfrooij P., Ponman T. J., Kozhurina-Platais V., 2004, MNRAS, 355, 785
- Moore et al. (1996) Moore B., Katz N., Lake G., Dressler A., Oemler A., 1996, Nature, 379, 613
- Nolthenius & White (1987) Nolthenius R., White S. D. M., 1987, MNRAS, 225, 505
- Nolthenius et al. (1997) Nolthenius R., Klypin A. A., Primack J. R., 1997, ApJ, 480, 43
- Oemler (1974) Oemler A. Jr., 1974, ApJ, 194, 1O
- Omar & Dwarakanath (2005a) Omar A. & Dwarakanath K. S., 2005, JApA, 26, 1
- Omar & Dwarakanath (2005b) Omar A. & Dwarakanath K. S., 2005, JApA, 26, 71
- Osmond & Ponman (2004) Osmond J. P. F., Ponman T. J., 2004, MNRAS, 350, 1511
- Paturel et al. (1997) Paturel G. et al., 1997, A&AS, 124, 109
- Perrett et al. (1997) Perrett K. M., Hanes D. A., Butterworth S. T., Kavelaars Jj, Geisler D., Harris W. E., 1997, AJ, 113, 895
- Pimbblet et al. (2002) Pimbblet K. A., Smail I., Kodama T., Couch W. J., Edge A. C., Zabludoff A. I., O’Hely E., 2002, MNRAS, 331, 333
- Ponman et al. (1996) Ponman T. J., Bourner P. D. J., Ebeling H., Bohringer H., 1996, MNRAS, 283, 690
- Postman & Geller (1984) Postman M., Geller M. J., 1984, ApJ, 281 ,95
- Quilis et al. (2000) Quilis V., Moore B., Bower R., 2000, Science, 288, 1617
- Quintana et al. (1994) Quintana H., Fouque P. & Way M. J., 1994, A&A, 283, 722
- Ramella et al. (1995) Ramella M., Geller M. J., Huchra J. P., Thorstensen J. R., 1995, AJ, 109, 1458
- Ramella et al. (2002) Ramella M., Geller M. J., Pisani A., da Costa L. N., 2002, AJ, 123, 2976
- Ramella et al. (2004) Ramella M., Boschin W., Geller M. J., Mahdavi A., Rines K., 2004, AJ, 128, 2022
- Schlegel et al. (1998) Schlegel D. J., Finkbeiner D. P., Davis M., 1998, ApJ, 500, 525
- Tanaka et al. (2004) Tanaka M., Goto T., Okamura S., Shimasaku K., Brinkmann J., 2004, AJ, 128, 2677
- Tanaka et al. (2005) Tanaka M. et al., 2005, MNRAS, 362, 268
- Tonry et al. (2001) Tonry J. L. et al., 2001, ApJ, 546, 681
- Tovmassian et al. (2004) Tovmassian H. M., Plionis M., Andernach H., 2004, ApJ, 617, 111
- Tran et al. (2001) Tran K-V. H., Simard L., Zabludoff A. I., Mulchaey J. S., 2001, ApJ, 549, 172
- Visvanathan & Sandage (1977) Visvanathan N., Sandage A, 1977, ApJ, 216, 214
- Wake et al. (2005) Wake D. A., Collins C. A., Nichol R. C., Jones L. R., Burke D. J., 2005, ApJ, 627, 186
- Wilman et al. (2005) Wilman D. J. et al., 2005, MNRAS, 358, 71
- Willmer et al. (1989) Willmer C. N. A., Focardi P., da Costa L. N. & Pellegrini P. S., 1989, AJ, 98, 1531
- Zabludoff & Mulchaey (1998) Zabludoff A. I., Mulchaey J. S., 1998, ApJ, 496, 39
- Zabludoff & Mulchaey (2000) Zabludoff A. I., Mulchaey J. S., 2000, ApJ, 539, 136
Appendix A 6dFGS Galaxies Data Table
| 6dFGS ID | Alternative Name | RA (J2000) | Dec (J2000) | (km s-1) | T-type | ||||
|---|---|---|---|---|---|---|---|---|---|
| 6dF J0223019-204243 | - | 2:23: 1.91 | -20:42:43.4 | 1717 | - | - | - | - | - |
| 6dF J0226215-241724 | - | 2:26:21.48 | -24:17:23.7 | 1500 | - | - | - | - | - |
| 6dF J0223046-211402 | NGC 0908 | 2:23: 4.55 | -21:14: 1.6 | 1486 | 7.36 | -24.24 | 10.93 | -20.78 | 5.2 |
| 6dF J0223029-204243 | NGC 0907 | 2:23: 2.94 | -20:42:42.7 | 1672 | 10.14 | -21.47 | 13.34 | -18.40 | 7.8 |
| 6dF J0226224-241719 | UGCA 032 | 2:26:22.44 | -24:17:18.8 | 1560 | 10.46 | -21.14 | 12.79 | -18.88 | 8.2 |
| 6dF J0234010-152155 | MCG -03-07-035 | 2:34: 0.99 | -15:21:55.2 | 1461 | - | - | 15.29 | -16.44 | 5.0 |
| 6dF J0238140-154833 | NGC 1034 | 2:38:14.02 | -15:48:32.7 | 1467 | 11.73 | -19.88 | 14.55 | -17.19 | 9.5 |
| 6dF J0238117-201001 | ESO 545- G 040 | 2:38:11.69 | -20:10: 1.2 | 1448 | 10.23 | -21.39 | 14.00 | -17.73 | -2.1 |
| 6dF J0242079-240746 | - | 2:42: 7.91 | -24: 7:45.5 | 1601 | - | - | - | - | - |
| 6dF J0254335-183806 | NGC 1145 | 2:54:33.51 | -18:38: 6.3 | 2073 | 9.28 | -22.34 | 13.80 | -17.96 | 4.9 |
| 6dF J0256124-193900 | ESO 546- G 033 | 2:56:12.35 | -19:39: 0.0 | 1607 | - | - | 14.54 | -17.15 | 7.5 |
| 6dF J0247440-203646 | ESO 546- G 022 | 2:47:44.01 | -20:36:46.0 | 1718 | - | - | 16.19 | -15.61 | 10.0 |
| 6dF J0241562-283836 | 2dFGRS S313Z081 | 2:41:56.21 | -28:38:35.5 | 1382 | - | - | - | - | - |
| 6dF J0243443-290012 | NGC 1079 | 2:43:44.34 | -29: 0:12.1 | 1502 | 8.46 | -23.15 | 12.63 | -19.08 | 0.5 |
| 6dF J0252259-270013 | - | 2:52:25.90 | -27: 0:13.0 | 1939 | - | - | - | - | - |
| 6dF J0248331-293447 | - | 2:48:33.05 | -29:34:46.8 | 2142 | - | - | - | - | - |
| 6dF J0254335-100143 | NGC 1140 | 2:54:33.54 | -10: 1:42.5 | 1485 | 10.62 | -20.99 | 13.09 | -18.67 | 9.5 |
| 6dF J0253335-103209 | APMUKS(BJ) B025108.32-104420.8 | 2:53:33.53 | -10:32: 8.5 | 1509 | - | - | - | - | - |
| 6dF J0249359-303441 | ESO 416- G 032 | 2:49:35.91 | -30:34:40.9 | 1272 | 10.82 | -20.79 | 14.40 | -17.29 | 1.0 |
| 6dF J0302385-185352 | NGC 1179 | 3: 2:38.48 | -18:53:52.0 | 1776 | 12.40 | -19.20 | 12.83 | -18.87 | 5.9 |
| 6dF J0306180-213007 | 2MASX J03061797-2130087 | 3: 6:17.99 | -21:30: 7.4 | 1336 | 13.54 | -18.07 | 15.93 | -15.75 | 0.0 |
| 6dF J0310191-222421 | IC 1898 | 3:10:19.07 | -22:24:21.4 | 1309 | 10.04 | -21.57 | 13.74 | -17.96 | 5.8 |
| 6dF J0308003-231850 | 2MASX J03080037-2318533 | 3: 8: 0.32 | -23:18:50.2 | 1570 | 14.04 | -17.57 | 15.95 | -15.73 | 5.0 |
| 6dF J0302376-225202 | NGC 1187 | 3: 2:37.57 | -22:52: 1.7 | 1386 | 8.31 | -23.29 | 11.39 | -20.30 | 5.1 |
| 6dF J0301170-233103 | 2MASX J03011693-2331036 | 3: 1:16.95 | -23:31: 3.4 | 1353 | 13.00 | -18.60 | 16.44 | -15.25 | - |
| 6dF J0304080-260411 | NGC 1201 | 3: 4: 7.98 | -26: 4:10.7 | 1650 | 7.74 | -23.87 | 12.06 | -19.61 | -2.5 |
| 6dF J0302344-230744 | 2MASX J03023438-2307438 | 3: 2:34.41 | -23: 7:43.9 | 1564 | 12.83 | -18.78 | 15.61 | -16.09 | -1.4 |
| 6dF J0309454-203445 | NGC 1232 | 3: 9:45.44 | -20:34:44.6 | 1652 | 7.73 | -23.88 | 10.65 | -21.06 | 5.2 |
| 6dF J0323066-212231 | NGC 1315 | 3:23: 6.60 | -21:22:30.7 | 1597 | 9.94 | -21.67 | 14.01 | -17.70 | -1.0 |
| 6dF J0318149-273637 | NGC 1292 | 3:18:14.89 | -27:36:37.2 | 1398 | 9.71 | -21.89 | 12.79 | -18.88 | 5.2 |
| 6dF J0318328-255008 | UGCA 064 | 3:18:32.82 | -25:50: 8.4 | 1797 | 11.22 | -20.38 | 13.76 | -17.90 | 6.0 |
| 6dF J0321030-253045 | NGC 1306 | 3:21: 2.99 | -25:30:45.2 | 1476 | 10.93 | -20.68 | 14.51 | -17.16 | 2.8 |
| 6dF J0321191-244611 | IRAS 03191-2456 | 3:21:19.09 | -24:46:10.5 | 1806 | - | - | 15.32 | -16.35 | -1.0 |
| 6dF J0331276-253711 | APMBGC 482+129+038 | 3:31:27.61 | -25:37:11.4 | 2005 | - | - | - | - | - |
| 6dF J0330497-255633 | 2MASXi J0330497-255632 | 3:30:49.74 | -25:56:32.5 | 1528 | - | - | - | - | - |
| 6dF J0329025-262643 | ESO 481- G 029 | 3:29: 2.49 | -26:26:43.1 | 1780 | 11.47 | -20.14 | 14.96 | -16.71 | -1.3 |
| 6dF J0325526-211721 | 2MASX J03255262-2117204 | 3:25:52.62 | -21:17:20.6 | 1428 | 11.77 | -19.84 | 15.72 | -16.00 | - |
| 6dF J0326283-212120 | NGC 1331 | 3:26:28.34 | -21:21:20.3 | 1242 | 10.87 | -20.74 | 14.40 | -17.32 | -4.7 |
| 6dF J0324256-213238 | NGC 1325 | 3:24:25.57 | -21:32:38.3 | 1590 | 8.83 | -22.78 | 12.26 | -19.44 | 4.2 |
| 6dF J0319360-192345 | - | 3:19:35.99 | -19:23:44.8 | 1697 | - | - | - | - | - |
| 6dF J0319142-190600 | NGC 1297 | 3:19:14.22 | -19: 6: 0.0 | 1538 | 9.13 | -22.48 | 13.49 | -18.23 | -2.3 |
| 6dF J0328145-172511 | UGCA 073 | 3:28:14.52 | -17:25:11.3 | 1884 | 12.03 | -19.58 | 15.00 | -16.77 | -3.6 |
| 6dF J0329317-174642 | NGC 1345 | 3:29:31.69 | -17:46:42.2 | 1558 | 11.58 | -20.03 | 14.30 | -17.47 | 4.9 |
| 6dF J0330359-175629 | ESO 548- G 028 | 3:30:35.90 | -17:56:29.1 | 1552 | 11.15 | -20.46 | 14.01 | -17.76 | -0.7 |
| 6dF J0331248-351952 | MCG -06-08-025 | 3:31:24.80 | -35:19:51.8 | 1327 | 11.89 | -19.71 | 14.70 | -16.96 | -1.4 |
| 6dF J0335166-351335 | NGC 1374 | 3:35:16.59 | -35:13:34.5 | 1477 | 8.25 | -23.35 | 12.02 | -19.63 | -4.8 |
| 6dF J0336543-352229 | MCG -06-09-008 | 3:36:54.32 | -35:22:29.0 | 1729 | 11.77 | -19.84 | 14.80 | -16.86 | -3.0 |
| 6dF J0333128-360103 | FCC 116 | 3:33:12.76 | -36: 1: 2.5 | 1527 | - | - | 15.85 | -15.85 | -3.5 |
| 6dF J0333364-360826 | NGC 1365 | 3:33:36.38 | -36: 8:25.9 | 1666 | 6.60 | -25.01 | 10.32 | -21.37 | 3.2 |
| 6dF J0333537-311139 | NGC 1366 | 3:33:53.68 | -31:11:38.8 | 1320 | 9.07 | -22.54 | 13.06 | -18.62 | -2.1 |
| 6dF J0328025-281641 | 2MASX J03280251-2816402 | 3:28: 2.54 | -28:16:41.0 | 1812 | 14.08 | -17.52 | 15.56 | -16.07 | -5.0 |
| 6dF J0332030-282131 | APMUKS(BJ) B032958.12-283137.5 | 3:32: 3.04 | -28:21:30.0 | 1356 | - | - | - | - | - |
| 6dF J0342115-295336 | NGC 1425 | 3:42:11.49 | -29:53:36.0 | 1606 | 8.56 | -23.05 | 11.44 | -20.22 | 3.2 |
| 6dF J0339233-311917 | NGC 1406 | 3:39:23.30 | -31:19:17.1 | 1035 | 8.61 | -23.00 | 12.93 | -18.71 | 4.2 |
| 6dF J0337283-243005 | NGC 1385 | 3:37:28.32 | -24:30: 4.7 | 1512 | 8.71 | -22.89 | 11.52 | -20.17 | 5.7 |
| 6dF J0337433-225430 | ESO 482- G 017 | 3:37:43.33 | -22:54:29.5 | 1515 | 12.75 | -18.86 | 14.86 | -16.84 | 0.8 |
| 6dF J0338166-222911 | LSBG J F482-034 | 3:38:16.55 | -22:29:11.4 | 1359 | - | - | - | - | - |
| 6dF J0333267-234246 | IC 1952 | 3:33:26.67 | -23:42:46.0 | 1853 | 9.87 | -21.74 | 13.53 | -18.19 | 4.1 |
| 6dF J0332283-232251 | ESO 482- G 003 | 3:32:28.29 | -23:22:51.3 | 1772 | - | - | 16.08 | -15.65 | 5.0 |
| 6dF J0335540-220823 | 2MASX J03355395-2208228 | 3:35:53.95 | -22: 8:23.0 | 1374 | 12.74 | -18.87 | 15.95 | -15.77 | 0.0 |
| 6dF J0335453-214659 | 2MASX J03354520-2146578 | 3:35:45.27 | -21:46:59.2 | 1638 | 13.68 | -17.93 | 16.25 | -15.46 | 0.0 |
| 6dFGS ID | Alternative Name | RA (J2000) | Dec (J2000) | (km s-1) | T-type | ||||
|---|---|---|---|---|---|---|---|---|---|
| 6dF J0329007-220848 | ESO 548- G 025 | 3:29: 0.69 | -22: 8:47.7 | 1706 | - | - | 14.98 | -16.76 | 1.1 |
| 6dF J0327422-214159 | ESO 548- G 022 | 3:27:42.16 | -21:41:58.6 | 1295 | - | - | 15.64 | -16.09 | 5.0 |
| 6dF J0333277-213353 | ESO 548- G 036 | 3:33:27.69 | -21:33:52.9 | 1520 | 10.54 | -21.07 | 14.89 | -16.84 | 0.1 |
| 6dF J0327356-211341 | ESO 548- G 021 | 3:27:35.57 | -21:13:41.4 | 1745 | - | - | 14.67 | -17.07 | 7.7 |
| 6dF J0332576-210522 | ESO 548- G 034 | 3:32:57.63 | -21: 5:21.9 | 1707 | 12.05 | -19.56 | 14.56 | -17.16 | 5.0 |
| 6dF J0332030-204908 | NGC 1353 | 3:32: 2.98 | -20:49: 8.2 | 1587 | 8.20 | -23.41 | 12.41 | -19.33 | 3.1 |
| 6dF J0335146-202225 | NGC 1370 | 3:35:14.57 | -20:22:25.2 | 1070 | 10.02 | -21.60 | 13.93 | -17.79 | -3.8 |
| 6dF J0336568-203523 | 2MASX J03365674-2035231 | 3:36:56.75 | -20:35:23.0 | 1689 | 12.42 | -19.19 | 15.78 | -15.95 | 0.0 |
| 6dF J0336391-205407 | NGC 1377 | 3:36:39.07 | -20:54: 7.2 | 1809 | 9.89 | -21.72 | 13.76 | -17.97 | -2.2 |
| 6dF J0341498-193453 | APMBGC 548-122-018 | 3:41:49.82 | -19:34:52.5 | 1914 | - | - | - | - | - |
| 6dF J0340362-213132 | ESO 548- G 069 | 3:40:36.17 | -21:31:32.4 | 1647 | - | - | 15.64 | -16.07 | 10.0 |
| 6dF J0340571-214250 | NGC 1414 | 3:40:57.14 | -21:42:49.9 | 1752 | - | - | 14.59 | -17.11 | 4.0 |
| 6dF J0343265-211944 | APMUKS(BJ) B034114.27-212912.6 | 3:43:26.46 | -21:19:44.2 | 1711 | - | - | - | - | - |
| 6dF J0341311-214054 | NGC 1422 | 3:41:31.07 | -21:40:53.5 | 1680 | 10.97 | -20.64 | 14.20 | -17.50 | 2.3 |
| 6dF J0345172-230009 | NGC 1438 | 3:45:17.23 | -23: 0: 8.9 | 1600 | 9.62 | -21.99 | 13.27 | -18.42 | 0.6 |
| 6dF J0340569-223352 | NGC 1415 | 3:40:56.86 | -22:33:52.1 | 1659 | 8.39 | -23.22 | 12.77 | -18.93 | 0.5 |
| 6dF J0340415-223904 | ESO 482- G 031 | 3:40:41.54 | -22:39: 4.1 | 1803 | 12.81 | -18.80 | 15.28 | -16.43 | -1.9 |
| 6dF J0344568-234200 | MCG -04-09-057 | 3:44:56.81 | -23:42: 0.0 | 1849 | - | - | 15.55 | -16.13 | 1.0 |
| 6dF J0338519-353539 | NGC 1404 | 3:38:51.91 | -35:35:39.1 | 1874 | 6.91 | -24.70 | 10.90 | -20.75 | -5.0 |
| 6dF J0338215-351535 | FCC 211 | 3:38:21.47 | -35:15:35.1 | 2090 | - | - | 15.89 | -15.77 | -5.0 |
| 6dF J0338292-352809 | CGF 01-01 | 3:38:29.19 | -35:28: 8.6 | 1148 | - | - | - | - | - |
| 6dF J0337117-354446 | NGC 1389 | 3:37:11.74 | -35:44:46.0 | 884 | 8.68 | -22.92 | 12.56 | -19.09 | -2.9 |
| 6dF J0333302-360932 | - | 3:33:30.24 | -36: 9:31.5 | 1781 | - | - | - | - | - |
| 6dF J0336475-344423 | NGC 1380A | 3:36:47.49 | -34:44:22.6 | 1586 | 9.68 | -21.92 | 13.42 | -18.24 | -1.5 |
| 6dF J0334592-351016 | NGC 1373 | 3:34:59.21 | -35:10:16.0 | 1394 | 10.73 | -20.87 | 14.13 | -17.53 | -3.8 |
| 6dF J0338192-350745 | FCC 207 | 3:38:19.23 | -35: 7:45.0 | 1445 | 13.40 | -18.20 | 15.60 | -16.06 | -3.5 |
| 6dF J0327180-343135 | ESO 358- G 006 | 3:27:18.04 | -34:31:35.2 | 1285 | 10.76 | -20.84 | 14.18 | -17.46 | -3.4 |
| 6dF J0335310-342649 | IC 0335 | 3:35:31.04 | -34:26:49.4 | 1649 | 9.23 | -22.38 | 13.37 | -18.29 | -1.4 |
| 6dF J0333339-333423 | FCC 119 | 3:33:33.86 | -33:34:23.4 | 1397 | - | - | 15.11 | -16.55 | -2.8 |
| 6dF J0335331-322754 | ESO 358- G 025 | 3:35:33.13 | -32:27:53.6 | 1433 | 10.89 | -20.72 | 13.95 | -17.70 | -2.9 |
| 6dF J0335203-323609 | ESO 358- G 022 | 3:35:20.32 | -32:36: 8.5 | 1310 | 10.60 | -21.00 | 13.87 | -17.77 | -1.8 |
| 6dF J0338136-330738 | ESO 358- G 043 | 3:38:13.59 | -33: 7:37.8 | 1430 | 12.16 | -19.44 | 14.79 | -16.85 | -2.4 |
| 6dF J0347048-334236 | IC 1993 | 3:47: 4.81 | -33:42:35.5 | 1116 | 9.11 | -22.49 | 12.52 | -19.12 | 3.0 |
| 6dF J0352009-332803 | ESO 359- G 003 | 3:52: 0.92 | -33:28: 3.4 | 1572 | 12.10 | -19.51 | 14.15 | -17.50 | 1.9 |
| 6dF J0343226-335625 | ESO 358- G 056 | 3:43:22.63 | -33:56:25.1 | 1128 | 12.80 | -18.80 | 15.14 | -16.48 | -1.7 |
| 6dF J0341036-334646 | ESO 358- G 050 | 3:41: 3.61 | -33:46:45.5 | 1331 | 10.59 | -21.02 | 13.93 | -17.69 | -2.0 |
| 6dF J0341326-345318 | ESO 358- G 051 | 3:41:32.60 | -34:53:18.0 | 1743 | 11.45 | -20.16 | 14.11 | -17.56 | 0.3 |
| 6dF J0346190-345637 | ESO 358- G 063 | 3:46:19.01 | -34:56:36.8 | 1941 | 9.14 | -22.46 | 12.57 | -19.06 | 5.5 |
| 6dF J0341455-334729 | FCC 267 | 3:41:45.48 | -33:47:28.6 | 854 | - | - | 15.82 | -15.80 | 6.2 |
| 6dF J0342194-352334 | NGC 1427 | 3:42:19.43 | -35:23:33.5 | 1452 | - | - | 11.84 | -19.81 | -4.1 |
| 6dF J0341318-195419 | ESO 548- G 076 | 3:41:31.81 | -19:54:18.5 | 1545 | 11.88 | -19.75 | 14.94 | -16.96 | -1.3 |
| 6dF J0341561-185343 | ESO 548- G 079 | 3:41:56.08 | -18:53:42.6 | 2031 | 11.11 | -20.52 | 14.78 | -17.18 | -1.2 |
| 6dF J0339348-200053 | ESO 548- G 063 | 3:39:34.78 | -20: 0:53.3 | 2048 | 12.18 | -19.45 | 15.13 | -16.72 | 3.7 |
| 6dF J0341044-190540 | ESO 548- G 073 | 3:41: 4.41 | -19: 5:40.0 | 987 | 12.91 | -18.72 | 15.34 | -16.58 | 3.3 |
| 6dF J0340159-190454 | 2MASX J03401592-1904544 | 3:40:15.93 | -19: 4:54.4 | 1614 | 12.26 | -19.36 | 15.59 | -16.31 | -3.5 |
| 6dF J0340432-183843 | 2MASX J03404323-1838431 | 3:40:43.23 | -18:38:43.1 | 1374 | 12.36 | -19.26 | 15.41 | -16.50 | -1.6 |
| 6dF J0340001-192535 | ESO 548- G 064 | 3:40: 0.08 | -19:25:34.7 | 1874 | 11.03 | -20.59 | 14.80 | -17.11 | -2.7 |
| 6dF J0340527-182841 | APMBGC 548-110-078 | 3:40:52.73 | -18:28:40.8 | 1680 | - | - | - | - | - |
| 6dF J0339308-184117 | NGC 1400 | 3:39:30.84 | -18:41:17.4 | 528 | 7.88 | -23.74 | 12.29 | -19.59 | -3.2 |
| 6dF J0334192-192528 | ESO 548- G 044 | 3:34:19.24 | -19:25:27.7 | 1553 | 10.56 | -21.05 | 14.23 | -17.53 | -0.8 |
| 6dF J0337392-182022 | NGC 1383 | 3:37:39.24 | -18:20:22.1 | 2009 | 9.51 | -22.12 | 13.79 | -18.13 | -1.9 |
| 6dF J0342314-160007 | MCG -03-10-038 | 3:42:31.36 | -16: 0: 6.8 | 1561 | 12.45 | -19.18 | 15.03 | -16.93 | 2.2 |
| 6dF J0346491-161557 | APMUKS(BJ) B034431.63-162511.1 | 3:46:49.06 | -16:15:56.7 | 1260 | - | - | - | - | - |
| 6dF J0346381-163301 | MCG -03-10-045 | 3:46:38.10 | -16:33: 0.6 | 1273 | 9.86 | -21.76 | 13.62 | -18.22 | 8.6 |
| 6dF J0341091-181851 | IC 0345 | 3:41: 9.13 | -18:18:50.9 | 1245 | 11.22 | -20.41 | 15.04 | -16.85 | -2.0 |
| 6dF J0344115-191910 | 2MASX J03441148-1919101 | 3:44:11.48 | -19:19: 9.9 | 1479 | 12.83 | -18.79 | 15.45 | -16.39 | -1.4 |
| 6dF J0346155-155953 | 2MASX J03461548-1559527 | 3:46:15.49 | -15:59:52.5 | 1826 | 12.07 | -19.55 | 15.75 | -16.05 | -1.0 |
| 6dF J0342278-260243 | - | 3:42:27.80 | -26: 2:42.5 | 1739 | - | - | - | - | - |
| 6dF J0340294-265144 | NGC 1412 | 3:40:29.37 | -26:51:44.1 | 1820 | 9.72 | -21.89 | 14.70 | -16.96 | -2.2 |
| 6dF J0336539-245445 | ESO 482- G 013 | 3:36:53.93 | -24:54:45.2 | 1862 | - | - | 15.16 | -16.51 | 2.2 |
| 6dF J0352266-230239 | ESO 482- G 049 | 3:52:26.59 | -23: 2:39.3 | 1500 | - | - | 15.31 | -16.49 | 8.1 |
| 6dF J0349423-265936 | UGCA 085 | 3:49:42.26 | -26:59:36.3 | 1521 | 11.06 | -20.55 | 13.76 | -17.90 | 5.1 |
| 6dF J0356012-203319 | - | 3:56: 1.17 | -20:33:18.8 | 1559 | - | - | - | - | - |
| 6dF J0354290-202538 | NGC 1481 | 3:54:29.01 | -20:25:38.0 | 1706 | 11.44 | -20.17 | 14.86 | -16.91 | -3.0 |
| 6dFGS ID | Alternative Name | RA (J2000) | Dec (J2000) | (km s-1) | T-type | ||||
|---|---|---|---|---|---|---|---|---|---|
| 6dF J0352420-184518 | 2MASX J03524198-1845179 | 3:52:41.97 | -18:45:17.8 | 1880 | 12.67 | -18.95 | 15.88 | -15.97 | 0.0 |
| 6dF J0349534-321533 | FCCB 2144 | 3:49:53.36 | -32:15:32.7 | 1202 | - | - | - | - | - |
| 6dF J0400416-304952 | ESO 419- G 013 | 4: 0:41.61 | -30:49:51.6 | 1515 | 12.36 | -19.24 | 14.43 | -17.21 | -0.8 |
| 6dF J0355228-280930 | IC 2007 | 3:55:22.76 | -28: 9:30.0 | 1292 | 10.59 | -21.02 | 13.90 | -17.75 | 3.7 |
| 6dF J0408076-171134 | NGC 1519 | 4: 8: 7.60 | -17:11:34.4 | 1810 | 10.41 | -21.20 | 13.72 | -17.99 | 3.1 |
| 6dF J0357287-231048 | - | 3:57:28.68 | -23:10:48.1 | 1579 | - | - | - | - | - |
| 6dF J0406497-211022 | NGC 1518 | 4: 6:49.72 | -21:10:21.5 | 710 | 11.16 | -20.46 | 12.26 | -19.55 | 7.7 |
| 6dF J0412411-230932 | ESO 483- G 013 | 4:12:41.12 | -23: 9:32.0 | 905 | 11.38 | -20.24 | 14.19 | -17.64 | -2.9 |
| 6dF J0421137-215045 | UGCA 090 | 4:21:13.73 | -21:50:45.3 | 858 | 10.77 | -20.84 | 12.94 | -18.76 | 6.9 |
| 6dF J0427198-223333 | ESO 484- G 019 | 4:27:19.83 | -22:33:33.3 | 1611 | - | - | 16.05 | -15.68 | 5.5 |
Appendix B NED Galaxies Data Table
| Galaxy Name | RA (J2000) | Dec (J2000) | (km s-1) | T-type | ||||
|---|---|---|---|---|---|---|---|---|
| ESO 545- G 005 | 2:20: 6.11 | -19:45: 2.0 | 2338 | 10.84 | -21.77 | 13.61 | -18.71 | 8.6 |
| UGCA 027 | 2:22: 7.08 | -21: 7:54.0 | 1622 | - | - | 15.86 | -15.83 | 10.0 |
| ESO 415- G 023 | 2:22:29.32 | -28:51:20.0 | 1615 | - | - | 16.32 | -15.35 | 7.5 |
| MCG -03-07-009 | 2:24:14.73 | -19:49:30.0 | 1052 | - | - | 15.52 | -16.22 | 5.5 |
| 2dFGRS S230Z178 | 2:24:35.71 | -26:48:32.0 | 1096 | - | - | - | - | - |
| ESO 545- G 015 | 2:25:57.94 | -19:41:29.0 | 2286 | - | - | 16.72 | -15.03 | 10.0 |
| VV 525 | 2:26:21.30 | -9:50:27.0 | 2109 | - | - | 14.54 | -17.17 | 8.0 |
| MRK 1039 | 2:27:32.77 | -10: 9:56.0 | 2111 | 12.33 | -19.28 | 14.56 | -17.14 | 5.3 |
| MRK 1042 | 2:28: 4.57 | -10:11: 0.0 | 2133 | 13.36 | -18.25 | 16.11 | -15.60 | - |
| 2dFGRS S231Z084 | 2:28:41.68 | -27:55:40.0 | 1586 | - | - | 17.27 | -14.40 | - |
| DDO 023 | 2:30:25.46 | -10:44:55.0 | 2110 | 14.63 | -16.98 | 14.77 | -16.96 | 10.0 |
| APMBGC 479+057-087 | 2:31:42.16 | -23:15:52.0 | 1892 | - | - | - | - | - |
| SHOC 124 | 2:31:46.00 | -9: 8:47.0 | 1622 | - | - | - | - | - |
| ESO 355- G 026 | 2:32:17.51 | -35: 1:48.0 | 2020 | 11.04 | -20.57 | 14.13 | -17.58 | 4.2 |
| 2dFGRS S232Z245 | 2:33:26.09 | -26:59:30.0 | 1511 | - | - | - | - | - |
| RC3 0231.5-0635 | 2:33:57.04 | -6:21:36.0 | 1410 | - | - | - | - | - |
| NGC 0988 | 2:35:27.75 | -9:21:22.0 | 1510 | 7.00 | -24.61 | 11.42 | -20.30 | 5.8 |
| USGC S092 NED09 | 2:35:28.79 | -7: 8:59.0 | 1532 | - | - | - | - | - |
| NGC 0991 | 2:35:32.69 | -7: 9:16.0 | 1532 | 11.18 | -20.43 | 13.41 | -18.31 | 5.0 |
| SDSS J023533.89-092147.3 | 2:35:33.91 | -9:21:47.0 | 1373 | - | - | - | - | - |
| NGC 1022 | 2:38:32.70 | -6:40:38.0 | 1453 | 8.63 | -22.98 | 12.32 | -19.39 | 1.1 |
| SDSS J023848.50-080257.7 | 2:38:48.50 | -8: 2:57.0 | 1665 | - | - | - | - | - |
| NGC 1035 | 2:39:29.09 | -8: 7:58.0 | 1241 | 9.12 | -22.49 | 13.20 | -18.50 | 5.1 |
| NGC 1042 | 2:40:23.97 | -8:26: 0.0 | 1371 | 9.44 | -22.17 | 12.11 | -19.62 | 6.1 |
| UGCA 038 | 2:40:30.19 | -6: 6:23.0 | 1327 | - | - | 16.43 | -15.28 | 9.0 |
| NGC 1047 | 2:40:32.84 | -8: 8:51.0 | 1340 | 11.37 | -20.24 | 14.50 | -17.21 | -0.7 |
| NGC 0961 | 2:41: 2.46 | -6:56: 9.0 | 1295 | - | - | - | - | - |
| NGC 1052 | 2:41: 4.80 | -8:15:20.0 | 1470 | 7.50 | -24.11 | 11.63 | -20.08 | -4.8 |
| SDSS J024120.22-071706.0 | 2:41:20.22 | -7:17: 6.0 | 1681 | - | - | - | - | - |
| VC94 023858-0820.4 | 2:41:25.53 | -8: 7:36.0 | 1412 | - | - | - | - | - |
| SDSS J024129.37-072046.0 | 2:41:29.37 | -7:20:46.0 | 1155 | - | - | - | - | - |
| 2MASX J02413514-0810243 | 2:41:35.06 | -8:10:24.0 | 1530 | 13.15 | -18.46 | - | - | |
| SDSS J024149.96-075530.0 | 2:41:49.96 | -7:55:30.0 | 1372 | - | - | - | - | - |
| SDSS J024246.84-073230.3 | 2:42:46.84 | -7:32:30.0 | 1344 | - | - | - | - | - |
| MCG -01-08-001 | 2:43:42.80 | -6:39: 5.0 | 1410 | - | - | - | - | 9.8 |
| NGC 1097B | 2:45:49.91 | -30:25:33.0 | 1015 | - | - | - | - | - |
| NGC 1084 | 2:45:59.93 | -7:34:43.0 | 1407 | 8.01 | -23.60 | 11.61 | -20.10 | 5.1 |
| SDSS J024600.31-073416.8 | 2:46: 0.31 | -7:34:16.0 | 1323 | - | - | - | - | - |
| 2dFGRS S313Z003 | 2:46: 9.94 | -29: 0:39.0 | 1184 | - | - | 17.57 | -14.10 | - |
| 2dFGRS S466Z138 | 2:47:15.13 | -31:16:49.0 | 2095 | - | - | 17.42 | -14.29 | - |
| SHOC 137 | 2:48:15.93 | -8:17:16.0 | 1378 | - | - | - | - | - |
| SDSS J024839.95-074848.3 | 2:48:39.96 | -7:48:48.0 | 1465 | - | - | - | - | - |
| Galaxy Name | RA (J2000) | Dec (J2000) | (km s-1) | T-type | ||||
|---|---|---|---|---|---|---|---|---|
| SHOC 138a | 2:49: 9.32 | -7:50:27.0 | 1290 | - | - | - | - | - |
| SDSS J024911.16-082828.7 | 2:49:11.16 | -8:28:28.0 | 1461 | - | - | - | - | - |
| SDSS J024913.41-080653.2 | 2:49:13.42 | -8: 6:53.0 | 1369 | - | - | - | - | - |
| SDSS J024911.16-082828.7 | 2:49:11.16 | -8:28:28.0 | 1461 | - | - | - | - | - |
| SDSS J024913.41-080653.2 | 2:49:13.42 | -8: 6:53.0 | 1369 | - | - | - | - | - |
| LSBG F416-012 | 2:51:47.97 | -30: 6:30.0 | 1076 | - | - | - | - | - |
| SDSS J025328.64-085905.5 | 2:53:28.64 | -8:59: 5.0 | 1457 | - | - | - | - | - |
| SHOC 142 | 2:53:46.71 | -7:23:44.0 | 1355 | - | - | - | - | - |
| APMUKS(BJ) B025254.79-110123.4 | 2:55:19.66 | -10:49:16.0 | 1568 | - | - | - | - | - |
| ESO 546- G 034 | 2:58:37.31 | -18:41:56.0 | 1568 | - | - | 15.98 | -15.73 | 8.7 |
| 2dFGRS S317Z164 | 3: 1:53.78 | -29:10:40.0 | 1280 | - | - | 17.77 | -13.91 | - |
| ESO 480- G 022 | 3: 2:34.47 | -23: 7:42.0 | 1566 | - | - | 15.61 | -16.09 | -1.4 |
| SDSS J030420.91-065946.6 | 3: 4:20.91 | -6:59:46.0 | 2159 | - | - | - | - | - |
| 2dFGRS S317Z075 | 3: 5:24.63 | -29:55:30.0 | 1127 | - | - | - | - | - |
| UGCA 051 | 3: 5:58.68 | -19:23:28.0 | 1684 | - | - | 16.79 | -14.90 | 10.0 |
| 2dFGRS S397Z183 | 3: 7:25.18 | -29:56: 8.0 | 1209 | - | - | 17.86 | -13.79 | - |
| ESO 547- G 011 | 3: 9:29.73 | -17:24:58.0 | 2204 | - | - | 16.14 | -15.62 | 9.1 |
| ESO 547- G 012 | 3: 9:36.87 | -17:49:53.0 | 2006 | - | - | 16.50 | -15.30 | 7.6 |
| APMBGC 547+004+085 | 3:10:51.94 | -21:29: 8.0 | 1536 | - | - | - | - | - |
| 2dFGRS S470Z147 | 3:11:29.33 | -31:22:54.0 | 1625 | - | - | 17.21 | -14.46 | - |
| ESO 547- G 020 | 3:12:57.54 | -17:55:46.0 | 1994 | - | - | 15.99 | -15.75 | 9.9 |
| UGCA 063 | 3:16: 9.66 | -24:12: 2.0 | 2087 | - | - | 15.58 | -16.11 | 10.0 |
| 2dFGRS S471Z114 | 3:16:15.19 | -31:12:32.0 | 1114 | - | - | 18.13 | -13.56 | - |
| SDSS J031702.71-061220.9 | 3:17: 2.71 | -6:12:20.0 | 2105 | - | - | - | - | - |
| 2MASX J03172972-0808431 | 3:17:29.72 | -8: 8:42.0 | 2057 | 13.31 | -18.33 | 15.43 | -16.59 | - |
| APMUKS(BJ) B031527.68-250529.9 | 3:17:37.86 | -24:54:34.0 | 1949 | - | - | - | - | - |
| 2dFGRS S241Z183 | 3:18:18.05 | -28:20:41.0 | 1691 | - | - | 18.44 | -13.23 | - |
| SDSS J031828.50-075335.3 | 3:18:28.51 | -7:53:35.0 | 2079 | - | - | 16.53 | -15.37 | - |
| SDSS J031829.05-075330.7 | 3:18:29.05 | -7:53:30.0 | 2078 | - | - | - | - | - |
| UGCA 065 | 3:18:43.14 | -23:46:57.0 | 1538 | - | - | 15.48 | -16.21 | 10.0 |
| SDSS J031903.37-060654.1 | 3:19: 3.38 | -6: 6:54.0 | 2224 | - | - | - | - | - |
| LSBG F418-059 | 3:19:24.97 | -32:38:58.0 | 1751 | - | - | - | - | - |
| MRK 1075 | 3:19:26.05 | -6: 7:16.0 | 2270 | 11.47 | -20.15 | 14.74 | -17.06 | 1.7 |
| IC 1913 | 3:19:34.53 | -32:27:54.0 | 1451 | - | - | 14.52 | -17.15 | 3.5 |
| SDSS J032009.02-061549.2 | 3:20: 9.02 | -6:15:49.0 | 2265 | - | - | - | - | - |
| NGC 1299 | 3:20: 9.69 | -6:15:43.0 | 2319 | 10.23 | -21.39 | 13.85 | -17.95 | 3.0 |
| SDSS J032032.77-060707.5 | 3:20:32.78 | -6: 7: 7.0 | 2358 | - | - | - | - | - |
| MCG -03-09-027 | 3:21:51.31 | -15:42:36.0 | 2004 | - | - | 15.57 | -16.23 | 9.0 |
| SGC 0321.2-1929 | 3:23:25.10 | -19:17: 0.0 | 1545 | - | - | - | - | - |
| ESO 548- G 004 | 3:23:32.22 | -18:39:59.0 | 1528 | - | - | 17.70 | -14.08 | - |
| ESO 548- G 009 | 3:24:38.20 | -19:17:53.0 | 1885 | - | - | 17.08 | -14.67 | 7.0 |
| ESO 358- G 005 | 3:27:16.61 | -33:29:10.0 | 1628 | - | - | 15.07 | -16.58 | 8.7 |
| FCCB 0470 | 3:27:33.80 | -35:43: 4.0 | 723 | - | - | - | - | - |
| 2dFGRS S321Z246 | 3:27:51.12 | -29: 8:27.0 | 1068 | - | - | 18.19 | -13.44 | - |
| FCC 085 | 3:30:46.21 | -35:32:57.0 | 1509 | - | - | 15.96 | -15.70 | -5.0 |
| AM 0329-321 | 3:31:19.10 | -32: 3:11.0 | 1590 | - | - | - | - | - |
| 2dFGRS S322Z237 | 3:32:48.62 | -29:29:47.0 | 1040 | - | - | 17.30 | -14.35 | - |
| ESO 358- G 016 | 3:33: 9.20 | -35:43: 6.0 | 1700 | - | - | 16.17 | -15.49 | 7.0 |
| AM 0331-360 NED01 | 3:33:43.40 | -35:51:33.0 | 1540 | - | - | - | - | - |
| FCCB 0904 | 3:33:56.20 | -34:33:43.0 | 2254 | - | - | - | - | - |
| FCCB 0905 | 3:33:57.20 | -34:36:43.0 | 1242 | - | - | - | - | - |
| FCC 132 | 3:34:18.33 | -35:47:41.0 | 1883 | - | - | 17.99 | -13.67 | -5.0 |
| 2dFGRS S324Z209 | 3:35: 6.55 | -28:42:17.0 | 1881 | - | - | - | - | - |
| FCSS J033634.6-351819 | 3:36:34.60 | -35:18:19.0 | 1901 | - | - | - | - | - |
| FCC 174 | 3:36:45.49 | -33: 0:50.0 | 1645 | - | - | 16.23 | -15.40 | -5.0 |
| FCC 181 | 3:36:53.27 | -34:56:19.0 | 1113 | - | - | 16.93 | -14.75 | -5.0 |
| FCSS J033703.3-353804 | 3:37: 3.24 | -35:38: 4.0 | 1491 | - | - | - | - | - |
| LSBG F358-045 | 3:37:17.98 | -35:41:54.0 | 1237 | - | - | - | - | - |
| FCC 195 | 3:37:23.35 | -34:54: 1.0 | 1315 | - | - | 16.51 | -15.16 | -5.0 |
| FCOS 2-2165 | 3:37:28.22 | -35:21:23.0 | 1356 | - | - | - | - | - |
| FCOS 2-2161 | 3:37:33.86 | -35:22:19.0 | 2009 | - | - | - | - | - |
| LSBG F358-044 | 3:37:34.05 | -35:49:45.0 | 1797 | - | - | - | - | - |
| FCOS 2-2094 | 3:37:42.24 | -35:30:33.0 | 1462 | - | - | - | - | - |
| FCOS 4-2028 | 3:37:43.49 | -35:15:10.0 | 1240 | - | - | - | - | - |
| FCC 200 | 3:37:54.65 | -34:52:56.0 | 1184 | - | - | 17.31 | -14.35 | -5.0 |
| FCOS 2-2100 | 3:38: 0.17 | -35:30: 8.0 | 997 | - | - | - | - | - |
| Galaxy Name | RA (J2000) | Dec (J2000) | (km s-1) | T-type | ||||
|---|---|---|---|---|---|---|---|---|
| FCSS J033805.0-352409 | 3:38: 5.08 | -35:24: 9.0 | 1244 | - | - | - | - | - |
| FCSS J033806.3-352858 | 3:38: 6.29 | -35:28:58.0 | 1312 | - | - | - | - | - |
| FCOS 2-2153 | 3:38: 6.48 | -35:23: 3.0 | 1390 | - | - | - | - | - |
| FCOS 2-2134 | 3:38:10.73 | -35:25:46.0 | 1683 | - | - | - | - | - |
| FCOS 2-2127 | 3:38:11.69 | -35:27:16.0 | 1476 | - | - | - | - | - |
| FCOS 0-2023 | 3:38:12.70 | -35:28:57.0 | 1705 | - | - | - | - | - |
| CGF 03-29 | 3:38:14.75 | -35:33:39.0 | 1331 | - | - | - | - | - |
| FCOS 0-2024 | 3:38:16.51 | -35:26:19.0 | 902 | - | - | - | - | - |
| FCCB 1241 | 3:38:16.67 | -35:30:27.0 | 2115 | - | - | - | - | - |
| FCOS 0-2089 | 3:38:17.09 | -35:26:30.0 | 1294 | - | - | - | - | - |
| FCOS 0-2025 | 3:38:17.98 | -35:15: 6.0 | 1401 | - | - | - | - | - |
| FCOS 0-2062 | 3:38:18.43 | -35:27:39.0 | 1338 | - | - | - | - | - |
| LSBG F358-043 | 3:38:18.71 | -35:31:52.0 | 1720 | - | - | - | - | - |
| FCOS 0-2026 | 3:38:19.03 | -35:32:22.0 | 1726 | - | - | - | - | - |
| FCOS 0-2063 | 3:38:19.08 | -35:26:37.0 | 1692 | - | - | - | - | - |
| FCOS 0-2027 | 3:38:19.49 | -35:25:52.0 | 1289 | - | - | - | - | - |
| FCOS 0-2065 | 3:38:21.84 | -35:29:23.0 | 1804 | - | - | - | - | - |
| FCOS 0-2066 | 3:38:23.23 | -35:20: 0.0 | 1255 | - | - | - | - | - |
| FCOS 3-2027 | 3:38:23.74 | -35:13:49.0 | 1553 | - | - | - | - | - |
| FCOS 2-2106 | 3:38:25.06 | -35:29:25.0 | 1313 | - | - | - | - | - |
| FCOS 1-2024 | 3:38:25.54 | -35:37:42.0 | 1789 | - | - | - | - | - |
| FCOS 2-2107 | 3:38:25.66 | -35:29:19.0 | 1267 | - | - | - | - | - |
| FCOS 0-2069 | 3:38:26.71 | -35:30: 7.0 | 1914 | - | - | - | - | - |
| FCOS 0-2030 | 3:38:28.34 | -35:25:38.0 | 1771 | - | - | - | - | - |
| FCOS 0-2031 | 3:38:28.97 | -35:22:55.0 | 1654 | - | - | - | - | - |
| FCOS 0-2032 | 3:38:30.22 | -35:21:31.0 | 1402 | - | - | - | - | - |
| FCOS 0-2033 | 3:38:30.72 | -35:27:46.0 | 1400 | - | - | - | - | - |
| FCOS 0-2072 | 3:38:32.06 | -35:28:12.0 | 1559 | - | - | - | - | - |
| FCOS 1-2095 | 3:38:33.82 | -35:25:57.0 | 1245 | - | - | - | - | - |
| FCOS 0-2074 | 3:38:35.66 | -35:27:15.0 | 2274 | - | - | - | - | - |
| FCOS 1-2077 | 3:38:40.56 | -35:29:10.0 | 586 | - | - | - | - | - |
| FCOS 1-2080 | 3:38:41.35 | -35:28:46.0 | 1647 | - | - | - | - | - |
| FCCB 1281 | 3:38:42.26 | -35:33: 8.0 | 2010 | - | - | - | - | - |
| FCOS 0-2041 | 3:38:44.11 | -35:19: 1.0 | 1287 | - | - | - | - | - |
| FCOS 1-2089 | 3:38:48.86 | -35:27:43.0 | 1559 | - | - | - | - | - |
| FCOS 1-2115 | 3:38:49.18 | -35:21:42.0 | 872 | - | - | - | - | - |
| FCSS J033854.1-353333 | 3:38:54.05 | -35:33:33.0 | 1591 | - | - | - | - | - |
| FCOS 0-2007 | 3:38:54.67 | -35:29:44.0 | 1761 | - | - | - | - | - |
| FCOS 1-2103 | 3:38:57.38 | -35:24:50.0 | 896 | - | - | - | - | - |
| FCOS 0-2092 | 3:39: 5.02 | -35:26:53.0 | 970 | - | - | - | - | - |
| AM 0337-353 | 3:39:13.35 | -35:22:18.0 | 824 | - | - | - | - | - |
| FCOS 1-2050 | 3:39:19.06 | -35:34: 7.0 | 1635 | - | - | - | - | - |
| AM 0337-355 | 3:39:19.55 | -35:43:35.0 | 902 | - | - | - | - | - |
| FCOS 3-2004 | 3:39:20.50 | -35:19:14.0 | 1341 | - | - | - | - | - |
| FCSS J033935.9-352824 | 3:39:35.92 | -35:28:24.0 | 1920 | - | - | - | - | - |
| FCOS 3-2019 | 3:39:37.18 | -35:15:22.0 | 1921 | - | - | - | - | - |
| ESO 482- G 027 | 3:39:41.21 | -23:50:39.0 | 1626 | - | - | 16.75 | -14.94 | 10.0 |
| FCSS J033952.5-350424 | 3:39:52.58 | -35: 4:24.0 | 1321 | - | - | - | - | - |
| FCCB 1379 | 3:39:55.00 | -33: 3: 9.0 | 708 | - | - | - | - | - |
| FCC 230 | 3:40: 1.26 | -34:45:30.0 | 1149 | - | - | 16.85 | -14.79 | -5.0 |
| FCSS J034003.4-352944 | 3:40: 3.40 | -35:29:44.0 | 2251 | - | - | - | - | - |
| FCSS J034007.2-353705 | 3:40: 7.26 | -35:37: 5.0 | 2058 | - | - | - | - | - |
| APMUKS(BJ) B033815.38-354624.4 | 3:40: 9.89 | -35:36:46.0 | 2024 | - | - | - | - | - |
| LSBG F358-037 | 3:40:23.58 | -35:16:36.0 | 2045 | - | - | - | - | - |
| LSBG F358-036 | 3:40:30.70 | -35:52:41.0 | 687 | - | - | - | - | - |
| ESO 548- G 070 | 3:40:40.99 | -22:17:13.0 | 1422 | - | - | 15.42 | -16.29 | 7.0 |
| LSBG F358-034 | 3:40:42.46 | -35:39:40.0 | 1097 | - | - | - | - | - |
| FCC 252 | 3:40:50.42 | -35:44:53.0 | 1415 | 13.44 | -18.16 | 15.74 | -15.90 | -5.0 |
| LSBG F358-033 | 3:41: 0.80 | -35:44:33.0 | 1517 | - | - | - | - | - |
| FCC 264 | 3:41:31.76 | -35:35:22.0 | 2033 | - | - | 16.16 | -15.48 | -2.0 |
| FCCB 1554 | 3:41:59.45 | -35:20:54.0 | 1735 | - | - | - | - | - |
| FCC 274 | 3:42:17.30 | -35:32:27.0 | 1073 | - | - | 16.26 | -15.39 | -5.0 |
| ESO 482- G 036 | 3:42:18.80 | -22:45: 9.0 | 1567 | - | - | 15.36 | -16.32 | 9.1 |
| 2MASX J03421942-3523337 | 3:42:19.43 | -35:23:33.0 | 1416 | 8.26 | -23.34 | 11.84 | -19.81 | -4.1 |
| Galaxy Name | RA (J2000) | Dec (J2000) | (km s-1) | T-type | ||||
|---|---|---|---|---|---|---|---|---|
| FCC 278 | 3:42:27.10 | -33:52:15.0 | 2125 | - | - | 16.25 | -15.37 | -5.0 |
| ESO 548- G 082 | 3:42:43.27 | -17:30:26.0 | 1716 | - | - | 15.38 | -16.69 | 5.0 |
| NGC 1436 | 3:43:37.08 | -35:51:10.0 | 1387 | 9.02 | -22.58 | 12.86 | -18.78 | 3.3 |
| ESO 482- G 039 | 3:43:57.20 | -24:55:21.0 | 1381 | - | - | 17.64 | -14.01 | 10.0 |
| ESO 549- G 007 | 3:44:11.45 | -19:19:12.0 | 1527 | - | - | 15.45 | -16.39 | -1.4 |
| FCC 298 | 3:44:44.40 | -35:41: 1.0 | 1719 | - | - | 16.10 | -15.56 | -5.0 |
| ESO 358- G 059 | 3:45: 3.56 | -35:58:21.0 | 1007 | 10.79 | -20.81 | 14.12 | -17.52 | -3.2 |
| ESO 358- G 060 | 3:45:12.14 | -35:34:15.0 | 803 | - | - | 15.63 | -16.01 | 9.8 |
| ESO 419- G 007 | 3:47:16.22 | -32:18:10.0 | 1445 | - | - | 16.34 | -15.29 | -5.0 |
| FGC 0453 | 3:47:18.23 | -14:41:49.0 | 1697 | - | - | 15.67 | -16.18 | 8.5 |
| FCC 332 | 3:49:49.02 | -35:56:44.0 | 1326 | 13.69 | -17.91 | 15.43 | -16.23 | -1.5 |
| ESO 359- G 002 | 3:50:36.73 | -35:54:33.0 | 1430 | 11.53 | -20.08 | 14.31 | -17.36 | -3.2 |
| FCC 336 | 3:50:52.50 | -35:10:18.0 | 1956 | - | - | 17.71 | -13.94 | -5.0 |
| IC 2006 | 3:54:28.45 | -35:58: 1.0 | 1382 | 8.57 | -23.03 | 12.51 | -19.14 | -4.7 |
| ESO 549- G 051 | 4: 3: 7.26 | -18:22:20.0 | 2069 | - | - | 16.38 | -15.33 | - |
| ESO 359- G 018 | 4: 5: 4.45 | -35: 0:32.0 | 1694 | - | - | 16.10 | -15.53 | -1.6 |
| ESO 359- G 022 | 4: 8:45.58 | -35:23:22.0 | 1430 | - | - | 15.83 | -15.80 | 8.5 |
| RC3 0406.7-0845 | 4: 9: 4.05 | -8:37:36.0 | 894 | - | - | - | - | - |
| ESO 420- G 005 | 4: 9:13.40 | -30:24:54.0 | 941 | 11.32 | -20.29 | 13.79 | -17.91 | 2.4 |
| APMBGC 359-095+013 | 4:10:28.88 | -35: 9:44.0 | 1473 | - | - | - | - | - |
| ESO 359- G 024 | 4:10:57.47 | -35:49:52.0 | 850 | - | - | 15.41 | -16.25 | 10.0 |
| 2dFGRS S922Z181 | 4:11:26.44 | -32:51:27.0 | 1088 | - | - | 17.19 | -14.47 | -5.0 |
| NGC 1531 | 4:11:59.32 | -32:51: 2.0 | 1169 | 9.16 | -22.45 | 12.90 | -18.76 | -2.6 |
| NGC 1532 | 4:12: 4.33 | -32:52:27.0 | 1196 | 6.86 | -24.75 | 10.68 | -20.98 | 3.0 |
| IC 2041 | 4:12:34.90 | -32:49: 2.0 | 1260 | 11.92 | -19.69 | 14.68 | -16.99 | -2.1 |
| ESO 359- G 029 | 4:12:50.67 | -33: 0: 4.0 | 878 | - | - | 15.11 | -16.57 | 9.9 |
| ESO 420- G 011 | 4:12:53.34 | -31:18:23.0 | 1402 | - | - | 15.51 | -16.19 | 4.0 |
| IC 2040 | 4:12:59.77 | -32:33:11.0 | 1338 | 10.97 | -20.64 | 13.94 | -17.75 | -0.8 |
| 2dFGRS S922Z534 | 4:13:13.87 | -32: 6: 2.0 | 1178 | - | - | 16.83 | -14.85 | - |
| APMBGC 483-129-114 | 4:14:38.14 | -22:48:38.0 | 2189 | - | - | - | - | - |
| APMUKS(BJ) B041335.87-150845.7 | 4:15:53.47 | -15: 1:21.0 | 1873 | - | - | - | - | - |
| RC3 0414.1-1515 | 4:16:24.16 | -15: 7:16.0 | 2000 | - | - | - | - | - |
| ESO 360- G 008 | 4:21:45.37 | -33:50:39.0 | 1267 | - | - | 16.83 | -14.92 | - |
| 2MASX J04272160-1438368 | 4:27:21.59 | -14:38:37.0 | 2241 | 13.20 | -18.42 | 15.84 | -16.00 | - |
| ESO 360- G 010 | 4:27:23.98 | -33:31:23.0 | 1153 | - | - | 16.63 | -15.09 | 10.0 |
| MCG -02-12-024 | 4:28:45.14 | -12:30:40.0 | 1800 | - | - | 15.35 | -16.41 | 9.1 |
| ESO 421-IG 002 NED01 | 4:29:38.33 | -27:24:26.0 | 948 | - | - | - | - | - |
| NGC 0899 | 2:21:53.14 | -20:49:23.7 | 1563 | 10.73 | -20.88 | 13.26 | -18.46 | 9.3 |
| IC 0223 | 2:22: 0.83 | -20:44:42.8 | 1579 | - | - | 14.41 | -17.31 | 9.8 |
| UGCA 031 | 2:25:59.85 | -21:25:17.8 | 1555 | - | - | 14.47 | -17.27 | 9.0 |
| LCSB F0005O | 2:28:31.56 | -27:58:38.0 | 1506 | - | - | - | - | - |
| IC 1826 | 2:39: 3.55 | -27:26:35.3 | 1375 | 10.40 | -21.20 | 13.29 | -18.38 | -0.6 |
| ESO 479- G 025 | 2:42: 6.99 | -24: 7:54.7 | 1431 | - | - | 14.60 | -17.10 | 6.0 |
| NGC 1076 | 2:43:29.25 | -14:45:15.5 | 2135 | 10.09 | -21.52 | 13.55 | -18.15 | 0.1 |
| NGC 1097A | 2:46: 9.89 | -30:13:40.9 | 1368 | 10.64 | -20.97 | 14.31 | -17.40 | -4.4 |
| NGC 1097 | 2:46:18.99 | -30:16:28.7 | 1271 | 6.44 | -25.17 | 10.16 | -21.55 | 3.1 |
| IC 0271 | 2:55:59.45 | -12: 0:28.6 | 1588 | - | - | 14.73 | -17.03 | -1.0 |
| MCG -02-08-032 | 2:56:46.21 | -11: 5: 2.2 | 1589 | 13.98 | -17.63 | 15.19 | -16.58 | 5.0 |
| NGC 1163 | 3: 0:22.09 | -17: 9: 9.1 | 2284 | 10.34 | -21.27 | 14.70 | -17.04 | 3.9 |
| MCG -03-08-057 | 3: 0:31.74 | -15:44:10.2 | 1490 | 10.80 | -20.83 | 13.57 | -18.40 | 6.9 |
| 2MASX J03004280-1607518 | 3: 0:42.81 | -16: 7:51.9 | 1535 | 12.38 | -19.26 | 15.64 | -16.31 | 5.0 |
| NGC 1172 | 3: 1:36.05 | -14:50:11.8 | 1669 | 9.41 | -22.22 | 12.87 | -19.02 | -3.9 |
| IRAS 03007-1531 | 3: 3: 7.58 | -15:19:33.5 | 1652 | - | - | - | - | - |
| ESO 547- G 005 | 3: 3:34.76 | -18:21:55.8 | 1593 | - | - | 15.43 | -16.33 | 10.0 |
| UGCA 050 | 3: 3:50.56 | -25:16:20.4 | 1726 | - | - | 15.28 | -16.39 | 8.6 |
| NGC 1231 | 3: 6:29.30 | -15:34: 8.7 | 2329 | 13.13 | -18.48 | 14.89 | -16.89 | 4.9 |
| UGCA 052 | 3: 7: 4.35 | -14: 0:16.5 | 1526 | - | - | 16.02 | -15.91 | 9.1 |
| MRK 1069 | 3: 8:19.02 | -13:54:10.6 | 1562 | 11.56 | -20.06 | 14.61 | -17.29 | 1.0 |
| ESO 357- G 007 | 3:10:23.83 | -33: 9:16.2 | 1121 | - | - | 14.68 | -16.99 | 8.8 |
| MCG -04-08-040 | 3:12:16.32 | -21: 2:58.0 | 1541 | 12.19 | -19.42 | 15.38 | -16.32 | -1.0 |
| NGC 1255 | 3:13:32.04 | -25:43:30.6 | 1686 | 8.83 | -22.77 | 11.62 | -20.04 | 4.5 |
| UGCA 061 | 3:13:40.30 | -25:11:17.2 | 1733 | - | - | 14.16 | -17.51 | 8.5 |
| NGC 1258 | 3:14: 5.48 | -21:46:27.4 | 1501 | 11.73 | -19.87 | 13.89 | -17.82 | 5.9 |
| MCG -04-08-055 | 3:16:21.31 | -25:51:17.4 | 1309 | 11.32 | -20.28 | 14.57 | -17.10 | -1.0 |
| Galaxy Name | RA (J2000) | Dec (J2000) | (km s-1) | T-type | ||||
|---|---|---|---|---|---|---|---|---|
| ESO 357- G 012 | 3:16:53.35 | -35:32:28.7 | 1567 | - | - | 14.78 | -16.92 | 7.0 |
| NGC 1300 | 3:19:41.06 | -19:24:40.3 | 1577 | 7.90 | -23.72 | 11.22 | -20.51 | 3.7 |
| NGC 1302 | 3:19:51.21 | -26: 3:38.1 | 1710 | 7.94 | -23.67 | 11.98 | -19.73 | 0.0 |
| ESO 481- G 021 | 3:20:17.71 | -26:27:50.3 | 1753 | - | - | 16.34 | -15.33 | 6.8 |
| 2MASX J03202693-3114531 | 3:20:26.85 | -31:14:52.6 | 1830 | 13.96 | -17.65 | 16.11 | -15.55 | - |
| NGC 1309 | 3:22: 6.56 | -15:24: 0.2 | 2136 | 9.22 | -22.40 | 12.08 | -19.69 | 3.9 |
| ESO 357- G 025 | 3:23:37.26 | -35:46:42.2 | 1823 | 12.98 | -18.63 | 15.18 | -16.49 | -2.7 |
| UGCA 068 | 3:23:47.02 | -19:45:12.4 | 1838 | - | - | 14.67 | -17.07 | 8.5 |
| NGC 1325A | 3:24:48.50 | -21:20:11.5 | 1333 | 14.03 | -17.57 | 13.62 | -18.09 | 6.6 |
| FCC 032 | 3:24:52.47 | -35:26: 7.6 | 1318 | 13.39 | -18.22 | 15.36 | -16.30 | -2.3 |
| ESO 548- G 011 | 3:24:55.31 | -21:47: 0.6 | 1453 | - | - | 16.07 | -15.62 | 8.4 |
| FCC 036 | 3:25:12.17 | -32:54: 9.4 | 2325 | - | - | 15.99 | -15.67 | -1.9 |
| UGCA 071 | 3:25:24.93 | -16:13:59.5 | 1873 | 11.29 | -20.32 | 14.65 | -17.12 | 7.8 |
| IC 1919 | 3:26: 2.24 | -32:53:40.4 | 1323 | 11.01 | -20.59 | 13.91 | -17.75 | -3.0 |
| ESO 548- G 016 | 3:26: 2.42 | -21:20:26.1 | 2119 | - | - | 15.62 | -16.12 | 7.0 |
| NGC 1332 | 3:26:17.25 | -21:20: 7.2 | 1524 | 7.12 | -24.49 | 11.39 | -20.36 | -3.1 |
| 2MASX J03263135-2113003 | 3:26:31.34 | -21:13: 0.5 | 1548 | 11.26 | -20.35 | 15.32 | -16.39 | -2.5 |
| NGC 1336 | 3:26:32.19 | -35:42:48.8 | 1418 | 10.08 | -21.52 | 13.41 | -18.24 | -3.2 |
| NGC 1337 | 3:28: 5.95 | -8:23:18.3 | 1239 | 9.64 | -21.99 | 12.53 | -19.37 | 6.0 |
| NGC 1339 | 3:28: 6.58 | -32:17:10.0 | 1392 | 8.77 | -22.84 | 12.80 | -18.86 | -4.2 |
| NGC 1344 | 3:28:19.64 | -31: 4: 5.2 | 1169 | 7.55 | -24.06 | 11.23 | -20.45 | -4.6 |
| NGC 1351A | 3:28:48.72 | -35:10:41.3 | 1353 | 10.66 | -20.94 | 14.17 | -17.50 | 4.2 |
| NGC 1338 | 3:28:54.55 | -12: 9:12.1 | 2476 | 10.23 | -21.41 | 13.72 | -18.29 | 3.1 |
| 2dFGRS S243Z114 | 3:28:54.81 | -27:23:19.4 | 1437 | - | - | 16.41 | -15.23 | - |
| UGCA 075 | 3:29:33.39 | -15:14:17.2 | 1887 | - | - | 14.79 | -17.18 | 8.7 |
| ESO 481- G 030 | 3:29:38.25 | -23:21: 2.0 | 1639 | - | - | 15.46 | -16.24 | 7.8 |
| NGC 1347 NED01 | 3:29:41.79 | -22:16:44.1 | 1760 | - | - | - | - | - |
| ESO 358- G 010 | 3:29:43.16 | -33:33:26.6 | 1808 | - | - | 14.75 | -16.90 | -2.5 |
| NGC 1351 | 3:30:34.98 | -34:51:14.2 | 1514 | 8.88 | -22.73 | 12.43 | -19.23 | -3.2 |
| ESO 548- G 029 | 3:30:47.17 | -21: 3:29.6 | 1215 | 11.21 | -20.40 | 14.33 | -17.43 | 3.4 |
| NGC 1350 | 3:31: 8.04 | -33:37:42.1 | 1905 | 7.53 | -24.07 | 11.22 | -20.44 | 1.9 |
| ESO 418- G 008 | 3:31:30.65 | -30:12:48.0 | 1195 | 12.40 | -19.21 | 13.93 | -17.73 | 7.9 |
| FCC 100 | 3:31:47.60 | -35: 3: 5.3 | 1660 | - | - | 15.27 | -16.39 | -2.1 |
| ESO 418- G 009 | 3:31:55.71 | -31:20:17.6 | 972 | - | - | 14.18 | -17.50 | 9.8 |
| UGCA 077 | 3:32:19.16 | -17:43: 5.5 | 1961 | - | - | 15.81 | -16.04 | 9.0 |
| ESO 548- G 033 | 3:32:28.63 | -18:56:54.6 | 1699 | 10.77 | -20.85 | 14.53 | -17.23 | -1.8 |
| NGC 1354 | 3:32:29.37 | -15:13:16.1 | 1802 | 9.02 | -22.61 | 13.28 | -18.72 | 0.0 |
| LSBG F358-061 | 3:32:47.65 | -34:14:19.3 | 2064 | 12.13 | -19.47 | - | - | - |
| ESO 482- G 006 | 3:32:59.19 | -26:28:23.0 | 1535 | 11.80 | -19.81 | 15.77 | -15.87 | -2.1 |
| ESO 482- G 005 | 3:33: 2.19 | -24: 7:58.5 | 1915 | - | - | 15.24 | -16.47 | 7.6 |
| ESO 358- G 015 | 3:33: 6.85 | -34:48:29.2 | 1388 | - | - | 14.91 | -16.75 | 8.8 |
| NGC 1357 | 3:33:17.08 | -13:39:50.9 | 2009 | 8.57 | -23.04 | 12.44 | -19.34 | 2.1 |
| LSBG F418-009 | 3:33:39.12 | -28:57:26.0 | 1751 | - | - | - | - | - |
| IC 1953 | 3:33:41.87 | -21:28:43.1 | 1867 | 10.10 | -21.51 | 12.71 | -19.02 | 6.7 |
| NGC 1359 | 3:33:47.71 | -19:29:31.4 | 1973 | 11.64 | -19.98 | 13.04 | -18.72 | 8.3 |
| NGC 1362 | 3:33:53.07 | -20:16:57.0 | 1233 | 10.34 | -21.27 | 14.21 | -17.52 | -2.0 |
| ESO 548- G 043 | 3:34:10.54 | -19:33:29.9 | 1931 | 11.59 | -20.02 | 15.78 | -15.98 | 2.2 |
| MCG -06-08-027 | 3:34:29.48 | -35:32:47.0 | 1205 | 12.28 | -19.33 | 14.72 | -16.95 | -2.2 |
| ESO 358- G 019 | 3:34:30.86 | -34:17:51.3 | 1254 | 13.44 | -18.16 | 15.35 | -16.31 | -2.8 |
| ESO 548- G 047 | 3:34:43.48 | -19: 1:44.1 | 1606 | 9.92 | -21.70 | 14.06 | -17.76 | -0.7 |
| ESO 358- G 020 | 3:34:57.35 | -32:38:23.4 | 1769 | 12.69 | -18.91 | 14.76 | -16.89 | 9.3 |
| NGC 1371 | 3:35: 1.33 | -24:55:59.6 | 1463 | 7.84 | -23.77 | 11.56 | -20.15 | 0.9 |
| NGC 1375 | 3:35:16.82 | -35:15:56.4 | 740 | 9.75 | -21.86 | 13.35 | -18.31 | -2.1 |
| ESO 548- G 049 | 3:35:28.27 | -21:13: 2.2 | 1510 | - | - | 15.22 | -16.50 | 5.6 |
| IC 1962 | 3:35:37.38 | -21:17:36.8 | 1806 | - | - | 14.81 | -16.92 | 7.5 |
| NGC 1379 | 3:36: 3.95 | -35:26:28.3 | 1324 | 8.32 | -23.28 | 11.94 | -19.71 | -4.9 |
| ESO 482- G 011 | 3:36:17.39 | -25:36:17.0 | 1595 | 12.01 | -19.60 | 14.73 | -16.93 | 4.3 |
| NGC 1380 | 3:36:27.58 | -34:58:33.6 | 1877 | 6.96 | -24.64 | 11.05 | -20.62 | -2.1 |
| NGC 1381 | 3:36:31.69 | -35:17:42.7 | 1724 | 8.47 | -23.13 | 12.66 | -19.00 | -2.0 |
| NGC 1386 | 3:36:46.22 | -35:59:57.3 | 868 | - | - | 12.17 | -19.49 | -0.8 |
| FCCB 1108 | 3:36:49.73 | -33:27:39.0 | 1734 | - | - | - | - | - |
| 2MASX J03365236-2756010 | 3:36:52.40 | -27:56: 1.6 | 1342 | 13.40 | -18.20 | 16.30 | -15.35 | - |
| NGC 1387 | 3:36:57.06 | -35:30:23.9 | 1302 | 7.53 | -24.08 | 11.76 | -19.89 | -2.9 |
| FCC 188 | 3:37: 4.57 | -35:35:24.1 | 999 | - | - | 15.94 | -15.72 | -0.4 |
| NGC 1380B | 3:37: 8.96 | -35:11:42.1 | 1740 | 10.21 | -21.39 | 13.80 | -17.87 | -2.8 |
| Galaxy Name | RA (J2000) | Dec (J2000) | (km s-1) | T-type | ||||
|---|---|---|---|---|---|---|---|---|
| NGC 1390 | 3:37:52.17 | -19: 0:30.1 | 1207 | 11.70 | -19.92 | 14.94 | -16.93 | 1.2 |
| NGC 1396 | 3:38: 6.59 | -35:26:23.7 | 808 | 12.08 | -19.52 | 14.93 | -16.73 | -3.0 |
| ESO 358- G 042 | 3:38: 9.17 | -34:31: 7.2 | 1138 | 13.32 | -18.29 | 15.49 | -16.16 | -1.9 |
| ESO 482- G 018 | 3:38:17.64 | -23:25: 9.0 | 1687 | 11.77 | -19.84 | 15.43 | -16.27 | 0.3 |
| NGC 1399 | 3:38:29.01 | -35:27: 1.7 | 1425 | 6.44 | -25.16 | 10.33 | -21.32 | -4.9 |
| NGC 1395 | 3:38:29.72 | -23: 1:38.7 | 1717 | 7.02 | -24.58 | 10.68 | -21.02 | -5.0 |
| NGC 1393 | 3:38:38.58 | -18:25:40.7 | 2127 | 9.31 | -22.31 | 13.36 | -18.54 | -1.7 |
| NGC 1398 | 3:38:52.06 | -26:20:15.7 | 1396 | 6.69 | -24.91 | 10.53 | -21.12 | 1.9 |
| MCG -04-09-043 | 3:39:21.57 | -21:24:54.6 | 1588 | - | - | 15.10 | -16.61 | 2.9 |
| NGC 1401 | 3:39:21.85 | -22:43:28.9 | 1495 | 9.45 | -22.16 | 13.70 | -17.99 | -2.1 |
| ESO 548- G 065 | 3:40: 2.64 | -19:22: 0.7 | 1221 | 13.21 | -18.42 | 15.31 | -16.62 | 1.3 |
| IC 0343 | 3:40: 7.14 | -18:26:36.5 | 1841 | 10.65 | -20.98 | 14.26 | -17.64 | -0.8 |
| NGC 1427A | 3:40: 9.42 | -35:37:46.4 | 2028 | - | - | 14.17 | -17.48 | 10.0 |
| NGC 1407 | 3:40:11.84 | -18:34:48.5 | 1779 | 6.86 | -24.77 | 10.91 | -20.99 | -4.9 |
| ESO 548- G 068 | 3:40:19.17 | -18:55:53.4 | 1693 | 10.43 | -21.20 | 14.27 | -17.63 | -2.6 |
| FCC 245 | 3:40:33.86 | -35: 1:22.6 | 2177 | - | - | 15.73 | -15.92 | -5.0 |
| ESO 482- G 032 | 3:40:41.46 | -26:47:11.4 | 1765 | - | - | 15.94 | -15.72 | 9.9 |
| ESO 548- G 072 | 3:41: 0.25 | -19:27:19.4 | 2034 | - | - | 16.11 | -15.83 | 5.0 |
| NGC 1416 | 3:41: 2.90 | -22:43: 8.9 | 2167 | 10.90 | -20.71 | 14.65 | -17.05 | -4.7 |
| ESO 482- G 035 | 3:41:14.65 | -23:50:19.9 | 1890 | 10.97 | -20.64 | 14.25 | -17.45 | 2.3 |
| FCC 261 | 3:41:21.36 | -33:46:11.4 | 1492 | - | - | 15.44 | -16.19 | - |
| 2MASX J03412708-2228220 | 3:41:27.12 | -22:28:22.4 | 2270 | 13.54 | -18.06 | 16.31 | -15.38 | -0.5 |
| FCC 266 | 3:41:41.34 | -35:10:12.0 | 1558 | 13.24 | -18.36 | 15.70 | -15.95 | -3.5 |
| IC 0346 | 3:41:44.67 | -18:16: 1.2 | 2013 | 10.04 | -21.59 | 13.94 | -17.97 | -0.5 |
| NGC 1428 | 3:42:22.79 | -35: 9:15.2 | 1640 | 10.20 | -21.41 | 14.02 | -17.62 | -3.0 |
| NGC 1421 | 3:42:29.28 | -13:29:16.9 | 2087 | 8.60 | -23.02 | 12.38 | -19.51 | 4.1 |
| MCG -06-09-023 | 3:42:45.32 | -33:55:13.8 | 1225 | 11.96 | -19.65 | 14.53 | -17.09 | -0.5 |
| NGC 1426 | 3:42:49.11 | -22: 6:30.1 | 1443 | 8.76 | -22.84 | 12.72 | -18.95 | -4.8 |
| MCG -02-10-009 | 3:42:56.08 | -12:54:59.1 | 2161 | 9.39 | -22.23 | 14.10 | -17.81 | 4.9 |
| ESO 549- G 002 | 3:42:57.39 | -19: 1:14.9 | 1111 | - | - | 14.93 | -17.01 | 9.5 |
| MCG -03-10-041 | 3:43:35.52 | -16: 0:51.9 | 1215 | 12.38 | -19.24 | 14.40 | -17.45 | 8.0 |
| ESO 549- G 006 | 3:43:38.25 | -21:14:13.7 | 1609 | - | - | 15.70 | -16.07 | 9.7 |
| MCG -03-10-042 | 3:44: 1.04 | -14:21:31.2 | 1578 | 9.91 | -21.71 | 13.41 | -18.45 | 3.9 |
| APMBGC 549+118-079 | 3:44: 2.52 | -18:28:18.5 | 1979 | - | - | - | - | - |
| FCC 296 | 3:44:32.85 | -35:11:45.5 | 695 | - | - | 15.90 | -15.74 | -5.0 |
| NGC 1439 | 3:44:49.95 | -21:55:14.0 | 1670 | 8.73 | -22.88 | 12.38 | -19.35 | -5.0 |
| NGC 1440 | 3:45: 2.91 | -18:15:57.7 | 1597 | 8.28 | -23.35 | 12.91 | -19.16 | -1.9 |
| NGC 1452 | 3:45:22.31 | -18:38: 1.1 | 1737 | 8.77 | -22.86 | 12.90 | -19.12 | 0.2 |
| 2MASX J03455939-1231489 | 3:45:59.41 | -12:31:49.1 | 955 | 11.25 | -20.37 | 15.23 | -16.63 | -2.0 |
| ESO 549- G 018 | 3:48:14.08 | -21:28:28.1 | 1587 | 10.64 | -20.98 | 13.35 | -18.51 | 5.0 |
| NGC 1461 | 3:48:27.14 | -16:23:34.4 | 1467 | 8.42 | -23.20 | 12.85 | -18.96 | -1.9 |
| NGC 1464 | 3:51:24.52 | -15:24: 8.1 | 1661 | 10.89 | -20.72 | 14.71 | -17.04 | - |
| NGC 1482 | 3:54:38.92 | -20:30: 7.8 | 1916 | 8.56 | -23.05 | 13.28 | -18.49 | -1.0 |
| ESO 549- G 035 | 3:55: 3.89 | -20:23: 0.3 | 1778 | - | - | 15.24 | -16.53 | 5.3 |
| ESO 483- G 003 | 3:58:10.57 | -22:34: 2.3 | 1530 | - | - | 15.02 | -16.76 | 7.0 |
| SGC 0401.3-1720 | 4: 3:34.66 | -17:11:50.2 | 1890 | - | - | - | - | - |
| UGCA 087 | 4: 5:59.76 | -17:46:26.6 | 1883 | - | - | 15.00 | -16.68 | 8.5 |
| ESO 483- G 008 | 4: 6: 2.62 | -22:37:52.1 | 1494 | - | - | 16.01 | -15.80 | 8.9 |
| UGCA 088 | 4: 7:12.96 | -17:12:12.6 | 1856 | - | - | 14.93 | -16.78 | 7.5 |
| ESO 550- G 008 | 4: 7:36.34 | -21:25:51.9 | 1610 | 12.66 | -18.95 | 14.90 | -16.86 | -1.0 |
| UGCA 089 | 4:10: 1.54 | -31:15:28.9 | 1387 | - | - | 15.39 | -16.28 | 9.9 |
| ESO 420- G 009 | 4:11: 0.60 | -31:24:28.2 | 1367 | - | - | 13.93 | -17.77 | 5.0 |
| MCG -03-11-018 | 4:11:19.52 | -16:13:47.5 | 1883 | - | - | 15.02 | -16.72 | 8.6 |
| NGC 1537 | 4:13:40.68 | -31:38:42.9 | 1362 | 7.85 | -23.76 | 11.65 | -20.06 | -3.4 |
| 2MASX J04134354-1729369 | 4:13:43.54 | -17:29:37.1 | 2040 | 11.31 | -20.31 | 14.44 | -17.30 | -2.0 |
| MCG -03-11-019 | 4:16:12.61 | -16:45: 1.3 | 1953 | - | - | 14.41 | -17.34 | 8.1 |
| LCSB S0588P | 3:34:50.67 | -16:15: 2.8 | 722 | 12.90 | -18.74 | - | - | - |
| APMUKS(BJ) B040450.22-172054.9 | 4: 7: 5.73 | -17:12:56.1 | 1856 | - | - | - | - | - |
| APMUKS(BJ) B033140.61-142543.0 | 3:34: 0.69 | -14:15:42.7 | 2071 | - | - | - | - | - |
| 2MASX J03353051-1412368 | 3:35:30.53 | -14:12:37.0 | 1879 | 12.70 | -18.92 | 15.79 | -16.00 | - |
| 2MASX J03193457-3227544 | 3:19:34.57 | -32:27:54.4 | 1451 | 11.93 | -19.68 | 14.52 | -17.15 | 3.5 |
| APMUKS(BJ) B040910.60-232232.9 | 4:11:18.23 | -23:14:42.4 | 1615 | - | - | - | - | - |
| 2MASX J04243069-2703366 | 4:24:30.68 | -27: 3:36.5 | 1160 | 12.82 | -18.8 | 17.16 | -14.66 | - |
| APMUKS(BJ) B032446.82-265758.1 | 3:26:54.16 | -26:47:36.6 | 1439 | - | - | - | - | - |
| Galaxy Name | RA (J2000) | Dec (J2000) | (km s-1) | T-type | ||||
|---|---|---|---|---|---|---|---|---|
| DUKST 481-041 | 3:25:53.58 | -25:48:39.5 | 1828 | - | - | 16.66 | -15.00 | - |
| APMUKS(BJ) B033830.70-222643.7 | 3:40:41.35 | -22:17:10.5 | 1737 | - | - | - | - | - |
| 2MASX J03184089-2545279 | 3:18:40.87 | -25:45:27.8 | 1678 | 13.85 | -17.76 | 16.25 | -15.40 | 0.0 |
| 2MASX J04125330-3118316 | 4:12:53.33 | -31:18:29.5 | 1391 | 13.39 | -18.22 | 15.51 | -16.19 | 4.0 |
| 2MASX J04110053-3124413 | 4:11: 0.49 | -31:24:41.1 | 1367 | - | - | - | - | - |
| 2MASX J03481580-2128131 | 3:48:15.81 | -21:28:13.2 | 1587 | 13.21 | -18.41 | - | - | - |
| APMUKS(BJ) B041228.64-225548.4 | 4:14:37.41 | -22:48:25.1 | 2278 | - | - | - | - | - |
| APMBGC 550+098+084 | 4: 6:18.37 | -21:31:30.4 | 1010 | - | - | - | - | - |
| LSBG F358-091 | 3:32:10.73 | -36:13:13.7 | 1199 | - | - | - | - | - |
| 2MASX J03231011-3437594 | 3:23:10.12 | -34:37:59.4 | 1522 | 13.07 | -18.53 | 17.90 | -13.75 | - |
| FCCB 0692 | 3:31: 0.19 | -35:28: 9.1 | 1795 | 13.19 | -18.42 | - | - | - |
| ESO 548- G 046 | 3:34:38.12 | -17:28:34.8 | 1567 | - | - | 15.69 | -16.24 | 3.9 |