Jet Breaks in Short Gamma-Ray Bursts. I: The Uncollimated Afterglow of GRB 050724
Abstract
We report the results of the Chandra observations of the Swift-discovered short Gamma-Ray Burst GRB 050724. Chandra observed this burst twice, about two days after the burst and a second time three weeks later. The first Chandra pointing occurred at the end of a strong late-time flare. About 150 photons were detected during this 49.3 ks observation in the 0.4-10.0 keV range. The spectral fit is in good agreement with spectral analysis of earlier Swift XRT data. In the second Chandra pointing the afterglow was clearly detected with 8 background-subtracted photons in 44.6 ks. From the combined Swift XRT and Chandra-ACIS-S light curve we find significant flaring superposed on an underlying power-law decay slope of =0.98. There is no evidence for a break between about 1 ks after the burst and the last Chandra pointing about three weeks after the burst. The non-detection of a jet break places a lower limit of 25∘ on the jet opening angle, indicating that the outflow is less strongly collimated than most previously-reported long GRBs. This implies that the beaming corrected energy of GRB 050724 is at least ergs.
Subject headings:
GRBs:individual(GRB 050724)1. Introduction
Gamma-Ray Bursts (GRBs) are separated into two classes (Kouveliotou et al., 1993; Paciesas et al., 1999): long, soft bursts ( s, where is the time interval within which 90% of the flux arrives), which are associated with the formation of a black hole during massive star core collapse (Woosley, 1993); and short, hard bursts ( s), thought to be the result of mergers of compact objects (e.g Eichler et al., 1989; Paczyński, 1991; Gehrels et al., 2005; Fox et al., 2005; Barthelmy et al., 2005b; Bloom et al., 2006; Berger et al., 2005). Both types of GRBs are thought to produce a highly relativistic fireball that results in the prompt -ray emission through internal shocks in the outflow, and subsequently causes a broad-band afterglow when it shocks the surrounding medium (Mészáros & Rees, 1997; Zhang & Mészáros, 2004). Much progress has been made since 1997 on the nature of long GRBs, primarily through the study of their radio, optical, and X-ray afterglows, but no afterglows of short GRBs had been detected until 2005, so our understanding of short GRB production mechanisms and environments is still in its infancy. The discoveries by Swift and HETE of the afterglows and counterparts for short GRB’s 050509B (Gehrels et al., 2005; Bloom et al., 2006), 050709 (Villasenor et al., 2005; Fox et al., 2005; Hjorth et al., 2005), and 050724 (Barthelmy et al., 2005b; Berger et al., 2005) was a tremendous breakthrough in the field, on par with the discovery of the first GRB afterglow by Beppo-SAX (GRB 970228; Costa et al, 1997). The X-ray light curve of GRB 050724 displays several flares including a late time flare starting at about 20 ks after the detection of the burst and lasting for about a day (Campana et al., 2006). The early X-ray observations of GRB 050724 by Swift also revealed the first Swift-discovered dust-scattered halo (Romano et al., 2005a; Vaughan et al., 2005), which was only the second time that an X-ray halo was seen around a GRB afterglow. We report here on combined Chandra and Swift XRT observations of the X-ray afterglow of GRB 050724, the first high-quality X-ray afterglow of a short burst, and their implications for beaming in this object.
The paper is organized as follows: In §2 we describe the observations and the data reduction. In §3 we present the data analysis. The discussion of our results is given in §4. Throughout the paper decay and energy spectral indices and are defined by , with the trigger time of the burst. Luminosities are calculated assuming a CDM cosmology with =0.27, =0.73 and a Hubble constant of =71 km s-1 Mpc-1 using the luminosity distances given by Hogg (1999). All errors are 1 unless stated otherwise.
2. Observations and data reduction
The Burst Alert Telescope (BAT, Barthelmy et al., 2005a) onboard the Swift Gamma-Ray-Burst-Explorer Mission (Gehrels et al., 2004) triggered on GRB 050724 at 12:34:09 UT on 2005 July 24 (Covino et al., 2005). The burst had =3.01.0 s, but most of the flux was released in a hard spike with a duration of 0.25 s (Barthelmy et al., 2005b). Therefore it was considered to be a short GRB. Swift’s X-ray Telescope (XRT, Burrows et al., 2005b) began observing the afterglow 74 s after the trigger. GRB 050724 was not detected by Swift’s UV-Optical Telescope (UVOT, Roming et al., 2005) and only a 3 limit of V18.84 was reported by Chester et al. (2005). Spectroscopic redshifts were reported by Prochaska et al. (2006) (z=0.2580.002) and Berger et al. (2005) (z=0.2570.001), who also report on the radio and NIR observations of GRB 050724.
The Chandra X-ray Observatory performed two Target of Opportunity observations of GRB 050724. The first occurred two days after the burst at 2005 July 26 20:10 - 2005 July 27 10:45 (UT) for a total of 49.3 ks. The second observation was about three weeks after the burst for a total of 44.6 ks at 2005 August 14 20:29 - 2005 August 15 10:15. All observations were performed in Very-Faint mode with the standard 3.2s read-out time on the on-axis position on the back-illuminated ACIS-S3 CCD. We reprocess all Chandra event data using CIAO and applied VF mode cleaning in order to reduce the ACIS particle background. Source photons were collected in a circular region with r= and r= for the first and second Chandra observations, respectively. The background photons were selected from the primary event file in a circle with r= and r=, respectively. The data reduction was performed using the Chandra analysis software CIAO version 3.3. The X-ray spectrum from the first Chandra observation was extracted with the CIAO tool dmextract and was analyzed with XSPEC version 12.2.1 (Arnaud, 1996). The calibration database was CALDB version 3.2.0. The response matrix and the auxiliary response file were created by the CIAO tools mkrmf and mkarf. The spectrum was rebinned using the FTOOL grppha version 3.0.0 to have at least 15 photons per bin.
The Swift XRT observed GRB 050724 in the Windowed Timing (WT) and Photon Counting (PC) observing modes (Hill et al., 2004). These X-ray observations have been discussed in detail by Campana et al. (2006) and in this paper we only concentrate on the PC mode data of the later time flare (T20 ks after the burst) in order to compare the XRT data with our Chandra data. The XRT data were reduced by the xrtpipeline task version 0.9.9. Source photons were selected by XSELECT version 2.3 in a circular region with a radius of r=47′′ and the background photons in a circular region close by with a radius r=96′′. For the spectral data only events with grades 0-12 were selected with XSELECT. The spectral data were re-binned by using grppha having 20 photons per bin. The spectra were analyzed with XSPEC version 12.2.1. The auxiliary response files were created by xrtmkarf and the standard response matrix swxpc0to12_20010101v008.rmf was used.
Background-subtracted X-ray flux light curves in the 0.3-10.0 keV energy range of the Chandra and Swift observations were constructed using the ESO Munich Image Data Analysis Software MIDAS (version 04Sep). The count rates were converted into unabsorbed flux units using energy conversion factors (ECF) which were determined by calculating the count rates and the unabsorbed fluxes in the 0.3-10.0 keV energy band using XSPEC as described in Nousek et al. (2006). The ECFs are 8.3 ergs s-1 cm-2 counts-1 for the Swift observation 1.6 ergs s-1 cm-2 counts-1 for the Chandra observations.
3. Data Analysis
3.1. Position
The first Chandra observation found a single source located within the Swift XRT error circle at RA (J2000) = , Dec (J2000) = , with an error radius of (Burrows et al., 2005d). This places the X-ray afterglow south of the center of an elliptical galaxy (Barthelmy et al., 2005b; Berger et al., 2005), coincident with the optical afterglow position reported by Berger et al. (2005) and with the VLA radio position given by Berger et al. (2005) and Soderberg (2005).
3.2. Light curve
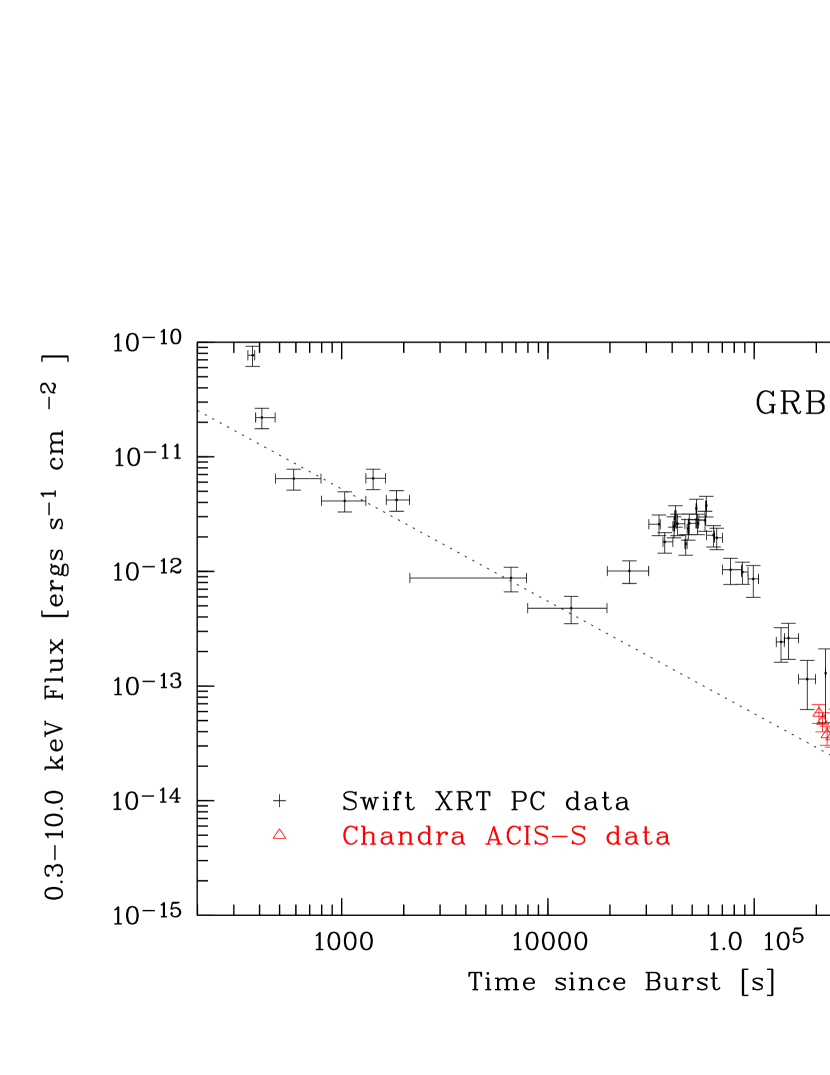
The left panel of Figure 1 displays the 0.3-10 keV unabsorbed flux light curve of the Swift XRT PC mode and Chandra ACIS-S observations. Table 1 lists the times and fluxes of the Swift and Chandra observations. Following the early very steep decay (between 100 and 300 s; see Campana et al. (2006)), the light curve is well fit by a single underlying power law decay slope of =0.98 (indicated by the dotted line in Figure 1), with one small and one very large flare superposed. The slope was determined from a linear regression fit to the four underlying afterglow data points in the Swift XRT light curve plus the final Swift XRT data point. Note, that the last XRT data point is just a marginal detection at the 2 level containing a total observing time of 47.1 ks. The afterglow decay slope =0.98 deviates from the slope =0.600.20 given in Campana et al. (2006). We analyzed our afterglow light curves by using different fitting routines within XSPEC, IDL, and MIDAS and always found a decay slope 1.0. Most likely the difference between our decay slope and that found by Campana et al. (2006) is due to different binning methods and/or treatment of the various flares that complicate modeling the underlying afterglow.
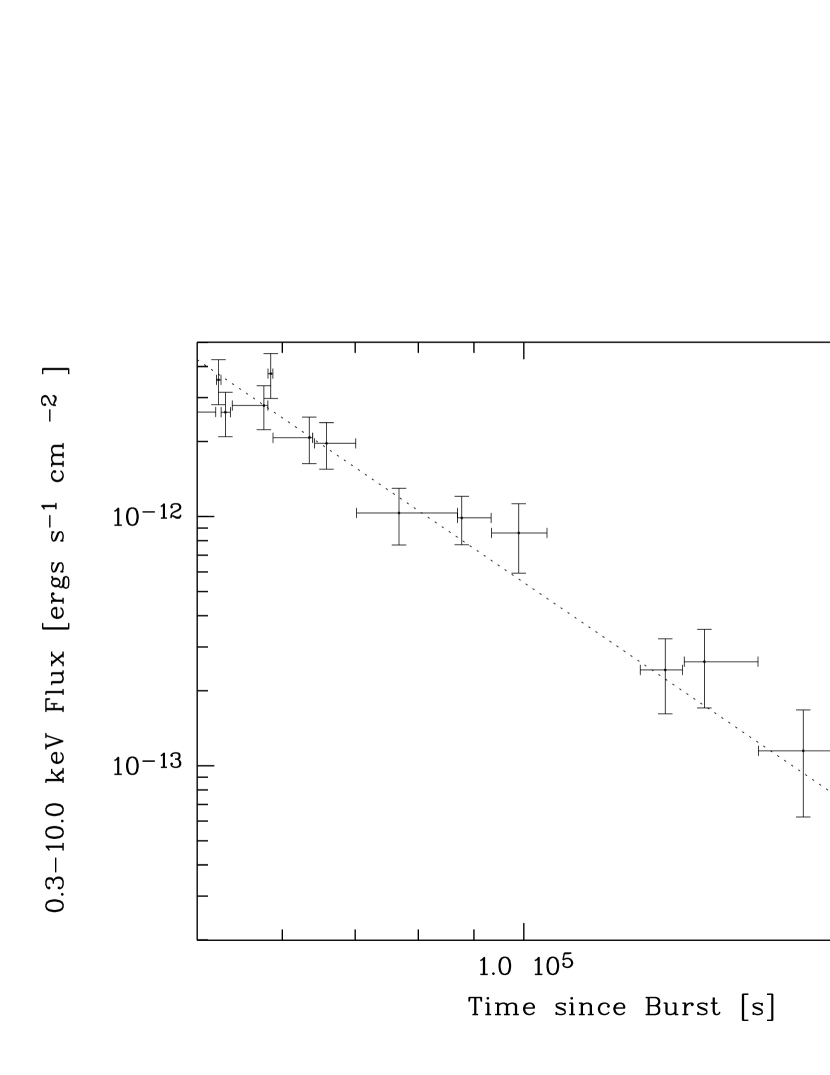
The largest flare occurs about 50ks after the burst. This flare has a fluence of 7.7 ergs cm-2 (Campana et al., 2006). The first Chandra observation from 2005-July-26/27 occurred at the end of this late-time flare. While the afterglow was almost undetectable with the Swift XRT, Chandra was able to detect 150 source photons in the 49.3 ks observation in the 0.4-10.0 keV band. A combined XRT and ACIS-S light curve of the decaying flare as displayed in the right panel of Figure 1 results in a decay slope =2.98 ().
During the second Chandra observation three weeks after the burst 8 background-subtracted source photons were detected in 44.6 ks. As shown in the left panel of Figure 1 this last data point is consistent with a flat decay slope =0.98, representing the underlying afterglow due to the forward external shock in the ambient medium. There is no sign of a jet break in the light curve up to the final Chandra point three weeks after the burst.
3.3. Spectral Analysis
Figure 2 displays the Chandra ACIS-S spectrum of GRB 050724. This spectrum was obtained during the decay of the late-time flare in the light curve of GRB 050724 (left panel of Figure 1). This spectrum can be well-fitted by a single absorbed power law (using in XSPEC). The results of the fits to the X-ray data are listed in Table 2. A free fit to the data results in an absorption column density at z=0 of =5.86 cm-2, which is significantly in excess of the Galactic value =1.48 cm-2 given by Dickey & Lockman (1990). However, as noticed by Vaughan et al. (2005), the line-of-sight of GRB 050724 passes close to the Ophiuchus molecular cloud and the Galactic column density is therefore significantly higher than what is given by Dickey & Lockman (1990). Vaughan et al. (2005) estimated the real value of the Galactic column density to be 3.4-4.2 cm-2. Therefore the fit to the Chandra ACIS-S data is consistent with the Galactic value and no additional absorption is required. Figure 2 displays the single power law fit to the Chandra ACIS-S data. The left panel of Figure 2 shows the ACIS-S spectrum and the right panel displays a contour plot of the absorption column density and the photon spectral index =+1. We conclude that no intrinsic absorber is required in the host galaxy. The X-ray energy spectral slope as listed in Table 2 is =0.86, where the absorption column density is fixed to the Galactic value with =4.0cm-2 as given by Vaughan et al. (2005).
For comparison, we examine the Swift XRT spectrum of the late-time flare of GRB 050724, shown in Figure 3. As listed in Table 2, our analysis of the XRT data of the late time flare (T20 ks after the burst) results in an energy spectral index =0.85 when the absorption column density is left as a free parameter. The absorption column density =4.44cm-2 also agrees with the Galactic absorption column density as given by Vaughan et al. (2005) and does not require any additional absorption. This result agrees well with the analysis reported by Campana et al. (2006). The right panel of Figure 3 displays the contour plot between the absorption column density and the photon index .
Table 2 also lists the results from a joint fit to the Chandra ACIS-S and Swift XRT spectra. This joint fit yields similar results to those obtained from the separate spectral fits.
The Chandra spectral analysis from the fading tail of this flare is in excellent agreement with the spectral fit for the flare as a whole, confirming the conclusion of Campana et al. (2006) that there is no evidence for spectral evolution in this afterglow.
4. Discussion
The main result of our late time Chandra observation is that there is no jet break observed in the X-ray afterglow of GRB 050724. Our last Chandra data point connects to the lower envelope of the XRT data points before ks as a single power law decay with =0.98. We interpret this slope as the afterglow from the forward shock, extending from ks after the burst until after the last Chandra observation 3 weeks later, with flaring superposed on this steady decay. Following the slow cooling ISM case listed in Table 1 in Zhang & Mészáros (2004) we find that the slope of the electron spectrum is and that the observed emission frequency is with the injection frequency and the cooling frequency (See Zhang & Mészáros, 2004, for details.).
The non-detection of a jet break up until 22 days after the burst places constraints on the jet opening angle. Using the relations given by Sari et al. (1999) and Frail et al. (2001), we can estimate the jet opening angle as:
| (1) |
using an ambient medium density of cm-3, an isotropic equivalent energy of 4 ergs s-1 and an isotropic-equivalent kinetic energy of = 1.5 ergs, and an efficiency of the fireball =0.2, as given by Berger et al. (2005). If the density is as high as cm-3 (Panaitescu, 2006), the inferred jet angle must be larger than .
This result differs from the conclusions of Panaitescu (2006) and Berger et al. (2005), who estimated an opening angle of 8 based on the radio and NIR observations of the afterglow of GRB 050724. The radio data seem to suggest an early jet break about 1–2 days after the burst, based on the steep radio decay slope =2.0, but the paucity of both the optical and radio observations and the possibility of strong Galactic interstellar scintillation in the 8.5 GHz radio band make this conclusion uncertain (Panaitescu, 2006). In addition, we point out that both the optical and radio data occur on the declining side of the large X-ray flare. If this flare is caused by central engine activity, the optical and radio behavior may be related to this flare rather than to a jet break. In any case, since a jet break is expected to be achromatic, the Chandra data strongly rule out a jet break at one day post-burst. The energy of the prompt emission is ergs (Barthelmy et al., 2005b) while the energy in the late-time flare is ergs (Campana et al., 2006) which is about 7% of the energy of the prompt emission. This result supports central engine models which predict a reduced activity at later times (e.g. Zhang & Mészáros, 2004).
Until recently, no jet break has ever been convincingly found in a short GRB afterglow. Fox et al. (2005) discussed the possibility of a jet break in the HETE-2-discovered short burst GRB 050709. However, their conclusions are based on few data points that poorly constrain jet parameters (Panaitescu, 2006) and may be open to other interpretations, particularly given the complex nature of X-ray afterglows, even for short GRBs (e.g. GRB 050724). The only convincing case of a jet break found in a short GRB afterglow is GRB 051221A (Burrows et al., 2006, Paper II), based on detailed, well-sampled Swift and Chandra observations.
The large lower limit of the jet angle inferred from our data suggests that the jet of this particular short GRB is much less collimated than typical long GRBs reported in previous works (Frail et al., 2001; Bloom et al., 2003; Soderberg et al., 2006), although we note that Swift afterglows in general may not support those early results (Sato et al. 2006, in preparation; Willingale et al. 2006, in preparation). The elliptical host galaxy of GRB 050724 suggests that the progenitor is not a collapsar and is likely a compact star merger (NS-NS or NS-BH). The wide jet angle inferred from the data is consistent with such a progenitor scenario (e.g. Mészáros, Rees, & Wijers, 1999), since there is no extended massive stellar envelope as in long GRBs that serves to naturally collimate the outflow (e.g. Zhang, Woosley, & Heger, 2004). Numerical simulations of mergers (e.g. Aloy et al., 2005) suggest a varying degree of short GRB collimation angles, which are in general wider than those of long GRBs. A wide angle also potentially explains why short GRBs are less bright (e.g. Mészáros, Rees, & Wijers, 1999). The total energy budget (collimation corrected) of short GRBs then should not be orders of magnitudes lower than that of long GRBs. Swift observations show that short GRBs typically have a very low isotropic gamma-ray energy given their very low redshifts (e.g. Gehrels et al., 2005; Barthelmy et al., 2005b; Fox et al., 2005). However, if short GRBs typically have wide jets, this would reduce the large gap in the total energy budget of short and long GRBs implied by the isotropic energies, which differ by several orders of magnitude (Frail et al., 2001) under the assumption of similar jet angles. Applying the beaming correction of as given by Sari et al. (1999) and Rhoads (1999) and using the isotropic energy given by Berger et al. (2005) of ergs, the beaming corrected energy of GRB 050724 is to ergs, depending on the beaming angle. This energy is comparable with the modest fireball energies predicted from neutron star - neutron star mergers based on neutrino - anti-neutrino annihilation as given by, e.g., Popham et al. (1999).
The long measurement baseline for the afterglow slope enabled by the late Chandra observation also guides the interpretation of the late flare, making it clear that the rapid decline in the X-ray light curve after 60 ks is the decay of a flare and not a jet break. In the Swift era, X-ray flares have generally been interpreted as due to late central engine activity (Burrows et al., 2005c; Zhang et al., 2006; Falcone et al., 2006; Romano et al., 2006). Zhang et al. (2006) pointed out that the steep decay () after this flare may be an indication of the curvature effect of a late internal dissipation activity. Liang et al. (2006) have tested such a model by searching for the required time zero point of this flare to satisfy the curvature effect interpretation and found that it is right at the rising part of the flare. Our late Chandra data point suggests that this flare is an independent component that is superimposed on the otherwise power-law decaying afterglow component. This flare may then originate from a different emission site, adding credence to the late central engine activity interpretation.
This is a particularly long and bright flare for such late times, and it is surprising to find it in a short GRB afterglow, since models of NS-NS mergers have typically suggested rapid creation of a black hole with little material left over to feed the central engine at such late times. These observations suggest that the central engine of GRB 050724 may have reactivated at around a day after the burst, which calls for central engine models that can extend the short GRB central engine to such a late time. Possible scenarios include fragmentation of a neutron star by a black hole in a NS-BH merger (Faber et al., 2006), fragmentation of the accretion disk (Perna et al., 2006), a magnetic-barrier-modulated accretion flow (Proga & Zhang, 2006), or the magnetic activity of a post-merger massive neutron star (Dai et al., 2006). Future extensive afterglow observations and more detailed theoretical modeling will be required to further understand the progenitor and the central engine of short GRBs.
Our observations of GRB 050724 have demonstrated the importance of late time Chandra observations of GRB afterglows. Our last Chandra observation from 2005 August provides crucial information about the late time behavior of the afterglow that no other X-ray observatory is able to measure at these low flux levels. Further late time X-ray observations of GRB afterglows will provide an improved understanding of the characteristics of jets of both long and short GRBs.
References
- Aloy et al. (2005) Aloy, M.A., Janka, H.-T., Müller, E., 2005, A&A, 436, 273
- Arnaud (1996) Arnaud, K. A., 1996, ASP Conf. Ser. 101: Astronomical Data Analysis Software and Systems V, 101, 17
- Barthelmy et al. (2005a) Barthelmy, S.D., et al. 2005a, Space Science Reviews, 120, 143
- Barthelmy et al. (2005b) Barthelmy, S.D., et al. 2005b, Nature, 438, 994
- Berger et al. (2005) Berger, E., et al., 2005, Nature, 438, 988
- Bloom et al. (2003) Bloom, J.S., Frail, D.A., & Kulkarni, S.R., 2003, ApJ, 594, 674
- Bloom et al. (2006) Bloom, J.S., et al., 2006, ApJ, 638, 354
- Burrows et al. (2005a) Burrows, D.N., Hill, J.E., Chincarini, G., et al., 2005a, ApJ, 622, L85
- Burrows et al. (2005b) Burrows, D.N., et al., 2005b, Space Science Reviews, 120, 165
- Burrows et al. (2005c) Burrows, D. N. et al. 2005c, Science, 309, 1833
- Burrows et al. (2005d) Burrows, D.N., Grupe, D., Kouveliotou, C., Patel, S., Meszaros, P., Zhang, B., and Wijers, R.A.M.J., 2005d, GCN 3697
- Burrows et al. (2006) Burrows, D.N., et al. 2006, ApJ, accepted, astro-ph/0604320
- Campana et al. (2006) Campana, S., et al., 2006, A&A, 454, 113
- Chester et al. (2005) Chester, M., et al., 2005, GCN 3670
- Costa et al (1997) Costa, E., et al., 1997, Nature, 387, 783
- Covino et al. (2005) Covino, S., et al., 2005, GCN 3665
- Dai et al. (2006) Dai, Z. G., Wang, X. Y., Wu, X. F. & Zhang, B. 2006, Science, 311, 1127
- Dickey & Lockman (1990) Dickey, J.M., & Lockman, F.J., 1990, ARA&A, 28, 215
- Eichler et al. (1989) Eichler, D., Livio, M., Piran, T., & Schramm, D.N., 1989, Nature, 340, 126
- Faber et al. (2006) Faber, J. A., Baumgarte, T. W., Shapiro, S. L., and Taniguchi, K. 2006, ApJ, submitted, astro-ph/0603277
- Falcone et al. (2006) Falcone, A. et al. 2006, ApJ, 641, 1010
- Fox et al. (2005) Fox, D.B., et al., 2005, Nature, 437, 845
- Frail et al. (2001) Frail, D.A., Kulkarni, S.R., Sari, R., et al., 2001, ApJ, 562, L55
- Gehrels et al. (2004) Gehrels, N., et al., 2004, ApJ, 611, 1005
- Gehrels et al. (2005) Gehrels, N., et al., 2005, Nature, 437, 851
- Hill et al. (2004) Hill, J.E., et al., 2004, SPIE, 5165, 217
- Hjorth et al. (2005) Hjorth, J., et al., 2005, Nature, 437, 859
- Hogg (1999) Hogg, D., 1999, astro-ph/9905116
- Kouveliotou et al. (1993) Kouveliotou, C., et al., 1993, ApJ, 541, L101
- Liang et al. (2006) Liang, E. et al. 2006, ApJ, accepted, astro-ph/0602142
- Mészáros & Rees (1997) Mészáros , P., & Rees, M. J. 1997, ApJ, 476, 232
- Mészáros, Rees, & Wijers (1999) Mészáros, P., Rees, M. J., Wijers, R. 1999, New Astron. 4, 303
- Nousek et al. (2006) Nousek, J., Kouveliotou, C., Grupe, D., Page, K.L., et al., 2006, ApJ, 642, 389
- Paciesas et al. (1999) Paciesas, W.S., et al., 1999, ApJS, 122, 465
- Paczyński (1991) Paczyński, B., 1991, Acta Astron., 41, 257
- Panaitescu (2006) Panaitescu, A., 2006, MNRAS, 367, 42
- Perna et al. (2006) Perna, R., Armitage, P.J., & Zhang, B., 2006, ApJ, 636, L29
- Popham et al. (1999) Popham, R., Woosley, S.E., & Freyer, C., 1999, ApJ, 518, 356
- Prochaska et al. (2006) Prochaska, J.X., et al., 2006, ApJ, 642, 1160
- Proga & Zhang (2006) Proga, D., & Zhang, B., 2006, MNRAS, 370, 61
- Rhoads (1999) Rhoads, J.E., 1999, ApJ, 487, 737
- Romano et al. (2005a) Romano, P., et al., 2005, GCN 3685.
- Romano et al. (2006) Romano, P. et al. 2006, A&A, 450, 59
- Roming et al. (2005) Roming, P.W.A., et al., 2005, Space Science Reviews, 120, 95
- Sari et al. (1999) Sari, R., Piran, T., & Halpern, J.P., 1999, ApJ, 519, L17
- Soderberg (2005) Soderberg, A.M., 2005, GCN 3696
- Soderberg et al. (2006) Soderberg, A. M., et al., 2006, ApJ, in press, astro-ph/0601455
- Vaughan et al. (2005) Vaughan, S., et al., 2005, ApJ, 639, 323
- Villasenor et al. (2005) Villasenor, J.S., et al., 2005, Nature, 437, 855
- Woosley (1993) Woosley, S.E., 1993, ApJ, 405, 273
- Zhang & Mészáros (2004) Zhang, B., & Mészáros , P., 2004, Int. Journal of Modern Physics A, Vol. 19, No. 15, 2385
- Zhang et al. (2006) Zhang, B., Fan, Y.Z., Dyks, J., Kobayashi, S., Mészáros , P., Burrows, B.N., Nousek, J.A., & Gehrels, N., 2006, ApJ, 642, 354
- Zhang et al. (2005b) Zhang, B., 2005b, Proc. of ”Astrophysics Sources of High Energy Particles and Radiation” (eds. T. Bulik, G. Madejski and B. Rudak), AIP conf. proc., Vol 801, 106
- Zhang, Woosley, & Heger (2004) Zhang, W., Woosley, S. E. & Heger, A. 2004, ApJ, 608, 365


| Observatory | Time after burst11In units of s. | 11In units of s. | Flux22In units of ergs s-1 cm-2. | Flux error22In units of ergs s-1 cm-2. |
|---|---|---|---|---|
| Swift | 348 | 15 | 1.40 | 0.28 |
| 370 | 28 | 7.68 | 1.53 | |
| 410 | 95 | 2.20 | 0.45 | |
| 586 | 318 | 6.45 | 1.33 | |
| 1035 | 514 | 4.12 | 0.82 | |
| 1421 | 323 | 6.48 | 1.31 | |
| 1847 | 493 | 4.20 | 0.86 | |
| 6625 | 2033 | 8.75 | 2.12 | |
| 12960 | 3415 | 4.77 | 1.27 | |
| 24813 | 1910 | 1.00 | 0.22 | |
| 34556 | 805 | 2.58 | 0.53 | |
| 36840 | 1158 | 1.81 | 0.37 | |
| 40898 | 830 | 2.47 | 0.51 | |
| 41485 | 652 | 3.08 | 0.65 | |
| 42476 | 772 | 2.60 | 0.55 | |
| 46608 | 1196 | 1.73 | 0.36 | |
| 47881 | 880 | 2.35 | 0.48 | |
| 48481 | 790 | 2.62 | 0.54 | |
| 52419 | 587 | 3.53 | 0.72 | |
| 53191 | 800 | 2.62 | 0.53 | |
| 57706 | 759 | 2.79 | 0.56 | |
| 58551 | 554 | 3.74 | 0.77 | |
| 63527 | 972 | 2.07 | 0.44 | |
| 65890 | 1023 | 1.96 | 0.42 | |
| 76802 | 1639 | 1.03 | 0.26 | |
| 87692 | 1973 | 9.88 | 2.16 | |
| 98926 | 1208 | 8.59 | 2.66 | |
| 134892 | 4438 | 2.43 | 0.81 | |
| 146538 | 3952 | 2.62 | 0.91 | |
| 180599 | 6980 | 1.15 | 0.53 | |
| 221928 | 2121 | 1.29 | 0.81 | |
| 560000 | 47109 | 1.30 | 0.75 | |
| Chandra | 205920 | 8270 | 5.80 | 1.08 |
| 214612 | 9610 | 4.93 | 0.93 | |
| 225551 | 12546 | 3.76 | 0.72 | |
| 238353 | 13065 | 3.62 | 0.69 | |
| 248605 | 6465 | 5.14 | 1.16 | |
| 1867280 | 43218 | 3.12 | 1.20 |
| Observation | 11Galactic absorption column density in units of cm-2. For the Galactic value we use cm-2 as given by Vaughan et al. (2005) | ||
|---|---|---|---|
| Chandra ACIS-S | 5.86 | 1.08 | 4.6/5 |
| 4.00 (fix) | 0.86 | 5.3/6 | |
| Swift XRT | 4.44 | 0.85 | 20/15 |
| 4.00 (fix) | 0.79 | 20/16 | |
| ACIS-S + XRT | 4.41 | 0.85 | 26/21 |
| 4.00 (fix) | 0.81 | 26/22 |