11email: suebsuwo@cesr.fr
Gravitational effects on the high energy emission of accreting black holes
Abstract
Context. We extend the investigation of general relativistic effects on the observed X-ray continuum of Kerr black holes in the context of the light bending model (Miniutti & Fabian, 2004).
Aims. Assuming a ring-like illuminating source, co-rotating with the underlying accretion disk, we study the shape and normalisation of the primary and disc reflected continuum as well as the dependence of the observed spectrum on the line of sight for various source heights and radii.
Methods. These calculations are performed using Monte-Carlo methods to compute the angle dependent reflection spectrum from the disc. The effects of general relativity are illustrated by a comparison with Newtonian and Special Relativity calculations.
Results. Relativistic distortions can strongly affect the shape of the reflected spectrum. Light bending can dramatically increase the observable reflected flux and reduce the primary emission. In addition, multiple reflections due to the reflected photons deflected toward the disc can alter significantly the shape of the spectrum above 10 keV. We explore the predicted variations of the observed reflected and primary fluxes with the height and radius of the source. Large variations of the ring radius at constant height can lead to an (unobserved) anti-correlation between primary and reflected flux. In another side, the variability behaviour of several sources can be reproduced if the ring source radius is small (), and its height varies by a large factor. In particular, a non-linear flux-flux relation, similar to that observed in several sources, can be produced. We compare our model with the flux-flux plot of NGC4051, and find an agreement for low inclination angles (), ring source radius 3 and a height varying between 0.5 to 10 . Regarding the angular distribution of the radiation, we find some important qualitative differences with respect to the Newtonian case. The reflected flux at larger inclination is relatively stronger than in the Newtonian model, the reflection fraction increasing with inclination.
Key Words.:
Accretion discs - Black hole physics - Gravitation - Methods: numerical - Relativity - X-rays: galaxies1 Introduction
The power-law X-ray spectra of Seyfert galaxies and black hole binaries are generally believed to originate from the central parts of the accretion flow trough inverse Compton process in a relativistic plasma. This hot plasma could be either the innermost part of a hot geometrically thick optically thin accretion disc (Shapiro et al. 1976; Narayan & Yi 1994) or a hot magnetic corona atop a cold standard geometrically thin optically thick accretion disc (Bisnovatyi-Kogan & Blinnikov 1976; Haardt & Maraschi 1993). In addition, the high energy spectra often show the presence of reprocessing features such as a line at (or close to) 6.4 keV and a Compton reflection bump peaking around 30 keV. Such features are expected from reprocessing and reflection of the hard X-ray continuum by cold and dense gas in the accretion disc (George & Fabian 1991; Matt et al. 1991) and/or by more distant material (Malzac & Petrucci 2002), such as the torus of the unified model for AGN (Antonucci 1993). In many instances, there is strong evidence that these reflection features are formed in the accretion disc in the direct vicinity of the black hole. Indeed during the last decade, many studies have shown that this radiation exhibits the imprints of strong gravitational field and rapid orbital motion of matter near a black hole (Fabian et al. 1989; Laor 1991; Matt et al. 1996; Reynolds & Begelman 1997; Martocchia et al. 2000). The spectacular relativistic profile of the iron line observed by ASCA in the Seyfert galaxy MGC6-30-15 (Tanaka et al. 1995) confirmed by BeppoSAX (Guainazzi et al. 1999), and XMM-Newton (Wilms et al. 2001) and Chandra (Lee et al. 2002) is the most impressive example. Although recent Chandra and XMM results have shown that the presence of relativistic lines in Seyfert 1s is far from being the rule, broad and asymmetric profiles appear to be quite common (Fabian 2004). Gravitational effects affect not only the line profile but also the shape and strength of the reflected continuum. Actually, the spectra of many several luminous Seyfert galaxies are very well described by photoionized and strongly relativistically blurred reflection models (Fabian et al. 2004; Crummy et al. 2005, Fabian et al. 2005; Porquet 2006). In these sources the primary continuum often appears to be strongly suppressed which could represent further evidence for light bending effects. In a number of Narrow Line Seyfert 1 (NLS1) galaxies and galactic black holes in the very high state, the variabilities of the continuum and of the iron line are decoupled, in apparent contradiction with the predictions of simple disc reflection models (see, e.g. Miniutti et al. 2003; Miniutti, Fabian & Miller 2004; Fabian et al. 2004; Rossi et al. 2005).
Miniutti & Fabian (2004) interpret these otherwise puzzling variability properties in terms of light bending effects (previously suggested by Fabian & Vaughan, 2003). In their model, the active coronal region(s) illuminating the disc are idealised as a ring source at some height above, and corotating with the accretion disc. When the source is close enough to the black hole, the primary component is strongly suppressed leading to reflection dominated spectra. Moreover, as shown by these authors, fluctuations in the height of the source can lead to strong variability in the primary component with little variability in the reflected flux, as observed.
In this work we investigate further the light bending model of Miniutti and Fabian. We use detailed Monte-Carlo simulations to compute not only the iron line profile (as done by these authors) but also the shape of the reflection continuum. Previous calculations of the relativistically blurred reflection spectra are based on a simple convolution of a Newtonian reflection with a relativistic kernel assuming a given emissivity law in the accretion disc (e.g. Dovčiak et al. 2004; Ross & Fabian 2005). In these latter works the authors focus only on the shape of the reflected spectrum while very little attention is paid to the effects on the primary emission and how they affect the ratio between primary and reflected fluxes. Moreover in all the previous studies of the GR effects on the iron line and reflection continuum, the possible multiple disc reflections, due to the reflected photons being gravitationally deflected again toward the disc, were neglected. Here, we will compute consistently the reflection and iron line expected from the ring source model including the contribution from multiple reflections and taking into account the exact angular dependence of the illuminating radiation in Kerr geometry. We will present a detailed investigation of the effects of general relativity on both the shape and normalisation of the primary and reflected components, with a particular emphasis on their dependence on the inclination of the line of sight.
We also extend the work of Miniutti & Fabian by showing the effects of varying the radius of the ring source in addition to its height. For reference, we also compare all our general relativistic simulations with the results obtained for the Newtonian geometry with both a static and a rotating disc. This enables us to disentangle the effects of general relativity from Newtonian and disc rotation effects. In particular, we show that due to light bending, the changes in the appearance of a source according to the viewing angle are very different from what is expected from the Newtonian calculations. Finally our self-consistent computations of the reflected continuum enable us to estimate the relative variations of the flux in two different energy bands when the geometry of the ring source changes. Comparing the results with data, we show that the predictions of the light bending model would be compatible with the non-linear flux-flux relation observed in the Seyfert galaxy NGC4051.
The structure of the paper is the following: Sec. 2 is devoted to the description of our calculations. Sec. 3 presents the results for the limiting case in which the ring source radius is zero i.e. a on-axis point source (the so-called lamp-post model) and studies the effect of the height of the source. The more general ring source model is studied in Sec. 4 and spectra for various source radii are presented and discussed. In Sec. 5 we discuss the relation between our results and the observations. We conclude in Sec. 6 with a short summary of our results.
2 Model description
2.1 Model assumptions
We use the Kerr metric to represent space-time curved by an uncharged rotating black hole. In Kerr geometry, the black hole is characterised by its mass, and its angular momentum, or a dimensionless spin parameter . We consider an extremely rotating black hole with (Thorne 1974). The unit of length in this study is the gravitational radius, . The inclination of the line of sight to the black hole rotation axis is given by , we note . The hard X-ray primary source has a ring-like axisymmetric geometry and is located above the disc with a radius, and a height . As we consider that the primary source represents a corona close to the disc or flares associated with magnetic activity of the disc, we can assume that the ring is in co-rotation with the underlying accretion disc. Since the orbital time-scale in the vicinity of black hole is usually much shorter than the integration time needed in observations, the choice of an axisymmetric geometry is then relevant even if the actual shape of the corona is more complex. It emits isotropically in its rest frame with an e-folded power law spectrum. We assume that the accretion disc lies on the equatorial plane of the Kerr geometry, . The disc is geometrically thin, optically thick and its innermost radius is the marginally stable orbit, extending to an outer radius of . For (Bardeen et al. 1972). The disc rotates with an angular velocity (Bardeen et al. 1972),
| (1) |
The accretion disc material is assumed to be neutral and cold, (George & Fabian 1991).
The intrinsic spectra emitted by the disc and the ring source are altered by Doppler effects due to the rotation, and the gravitational shift and light bending. In order to understand and disentangle these different effects, it is interesting to compare the results of the full general relativistic calculations with simplified approaches. Namely, we will compare the three following models:
-
•
Newtonian Model (hereafter NN): a static accretion disc and ring source in Newtonian geometry. The direction and the energy of the photons in the observer frame are identical to the emitted ones.
-
•
Special Relativistic Model (hereafter SR): a rotating accretion disc (and primary source) in Newtonian geometry. The direction and the energy of the photons are affected by beaming and Doppler effects. 111In this model the radial dependence of the disc velocity is taken to be that of a general relativistic accretion disc (Eq. 1). We consider Newtonian geometry for light propagation only.
-
•
General Relativistic Model (hereafter GR): a rotating accretion disc in Kerr geometry. Each photon trajectory in this model follows a geodesic in Kerr geometry. Its energy is different in the observer and the emitter rest frame due to the gravitational shift.
2.2 Calculation
We use the Boyer-Lindquist coordinates (, , , ; the black hole rotates in the direction) as coordinate system of observers at infinity in Kerr geometry. The static limit is a surface described by . The region of space-time between the horizon and the static limit is called ”ergosphere”. In this region, all observers must orbit the black hole in the same direction. We calculate photon trajectories using Carter’s equations of motion (Carter 1968). The constants of motion are derived from the emitted angle and energy in the source rest frame as detailed in Appendix A.
To compute the overall spectrum we use a Monte-Carlo method consisting in tracking the path and interactions of individual photons. First, we draw the direction and energy of the primary photons. Their directions are drawn from an isotropic distribution in the ring source rest frame. Their energies are generated from the following energy distribution:
| (2) |
where is photon index and is cut-off energy. In most of our simulations and unless specified otherwise, we set and 200 keV.
From these quantities we compute the constants of motion and solve the equations of motion. A photon geodesic can either intercept the disc or reach infinity directly. In both cases, we calculate the local power (i.e. either at infinity or on the disc), by
| (3) |
where , is the energy locally measured by observers and is the emitted energy. The direction of propagation in the local frame can then be derived by inverting Eqs A5 - A7.
If a photon does not intercept the disc, its energy and direction at infinity are stored and used to build up the observed spectrum. Otherwise, we use the Monte-Carlo code of Malzac et al. (1998) to track its interactions inside the accretion disc. This reflection code takes into account Compton diffusions in cold neutral matter, photoabsorption and iron fluorescence. The column density of the disc is fixed at . We use the photo-absorption opacities from Morrisson & McCammon (1983) which assume neutral matter with standard abundances. We found the results calculated from this code in good agreement with those of Magdziarz & Zdziarski (1995). As the mean free path of the X-ray photons in the disc is much shorter than any radius of curvature, the Euclidean metric approximation is generally applicable (George & Fabian 1991), and we neglect GR effects on radiative transfer in the disc. Using the incident energy and direction as input, the photon is followed until it is absorbed or escapes from the disc. When a photon escapes, the new constants of motion are computed from its outgoing energy and direction. Its trajectory toward the observer is solved and its energy and direction at infinity are stored to build up the observed spectrum, unless the photon intercepts the disc again, in which case the Monte-Carlo reflection routine is used again, until it finally escapes to infinity or is absorbed in the disc. This calculation method allows us to study the effects of returning radiation and multiple-reflections that can not be considered by ray tracing methods. These effects are therefore fully taken into account and will be discussed on the basis of a few examples in Sect. 4.4.
We tested our gravitational shift calculation by computing and comparing the Iron line profile with the results of Miniutti & Fabian (2004), that are calculated by means of the ray tracing method. We obtained a good agreement, see Fig. 1. In this simulation, the line emission was assumed to be locally isotropic to follow Miniutti & Fabian (2004). We stress however that our method can handle the (non-isotropic) angle dependence of the reflection component which, in the rest of the paper, is computed self consistently.
3 Results for an on-axis Source
For the presentation of the results of the simulations we distinguish two different cases. In this section we will consider the limiting case of a point source on the rotation axis of the black hole (i.e. =0). This simple situation often referred to as the ”lampost model” was considered by numerous authors in the context of disc illumination and reflection/line studies (see Petrucci & Henri 1997, Martocchia et al. 2000; Beckwith & Done 2004, and references cited therein). It will enable us to illustrate the effects of the height of the source on the shape and relative amplitude of the reflection continuum. The more general case where the radius of the source ring is non zero will be treated in Sec. 4 allowing us to study the effect of the radial distance of the source. In the on-axis case we assume that the source is static. The differences between the NN and the SR are attributable only to the rotation of the disc. The on-axis case is therefore simpler than the off-axis case, where the primary emission is beamed due to the ring rotation, affecting strongly the angular distribution of radiation observed at infinity and impinging on the disc which in turn alters the reflected emission. For both cases, we will compare the spectra obtained for the purely Newtonian, Special Relativistic and fully general relativistic calculations, considering successively the effects on the primary emission (i.e. the observed luminosity originating directly from the hard X-ray source) and the reflected component.
3.1 Primary component
Since the point source is static, the primary spectra of NN and SR are identical as shown in Fig. 2. The effects of space-time curvature manifest themselves through spectral shift and the loss of primary component intensity. For lower source heights, more photons are deflected toward the accretion disc or to the horizon and the primary source appears fainter to an observer at infinity. In addition, the gravitational redshift decreases the energy of the observed primary flux. Obviously, these effects are more important for lower source heights. In the GR models, the higher () and the lower () source heights considered in Fig. 2 have an apparent luminosity differing by a factor of about 20. The gravitational redshift for () is of order of , as a consequence the cut-off energy is reduced by a factor of about two with respect to the newtonian case. Quite surprisingly, although the photons travel across the rotating curved space-time, the angular distribution of the primary component at infinity is very close to isotropic whatever , as shown in the left panel of Fig. 2.
3.2 Reflection component
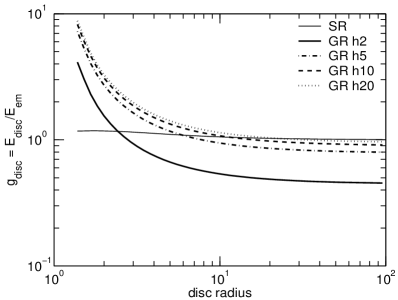
Since the shape of the reflected component depends on the spectrum and angular distribution of the impinging radiation, it is interesting to study the effects of special and general relativity on the irradiation as seen in the disc rest frame. Fig. 3 shows the gravitational photon energy shift between the source and disc frame, = as a function of disc radius. In the inner disc region (approximatively for ) the impinging photons have been falling deeper into the potential wheel and have therefore gained energy. In this region the material in the disc sees a harder spectrum. The amplification factor can be of almost 10 at the inner stable orbit. This gravitational effect is much stronger than the simple Doppler boosting due to disc rotation which leads at most to a 20 % gain in energy as can be seen on Fig. 3. On the other hand, in the outer part of the disc the impinging photons have travelled against the gravitational potential and the radiation is redshifted.
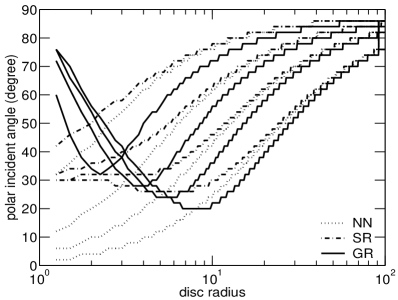
The disc rotation and the rotating curved space-time have also an effect on the photon incident angle in the inner region. Fig. 4 compares the incident angle of the photons as a function of radius obtained for the NN, SR and GR cases. In the newtonian static case, the incident angle (with respect to the disc normal) is simply given by . The aberration of light caused by the disc rotation in SR leads to a higher inclination than in the static disc NN. The effect is stronger in the inner part of the disc where the rotation velocity is larger. In the Kerr metric, light bending causes the incidence angle to be smaller than in the newtonian case at large radii. On the other hand, the photons emitted toward the inner parts of the disc () are dragged by the rotation of the metric and start spiraling fast around the axis of the black hole. Those photons impinge the innermost parts of the disc with an almost grazing incidence, so that at short radii the incident inclination of photons is higher than both in the SR and NN.
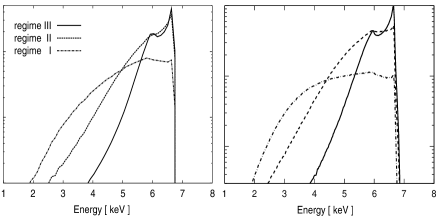
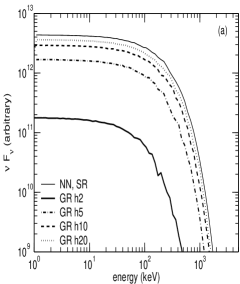
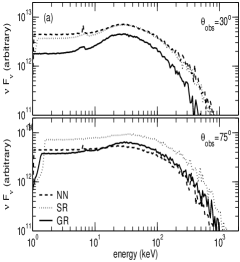
Fig. 5(a) shows examples of reflection spectra computed according to our three fiducial models and two different inclinations of the line of sight. At low inclination, the SR effects are weak and the NN and SR spectra are very similar. The GR spectrum has a lower amplitude and lacks high energy photons due to gravitational redshift. On the other hand, for large inclinations, the spectral shifts are more important. The iron line in the SR spectrum is significantly blurred, and the overall spectrum is blueshifted. The GR spectrum shape is then similar to the SR spectrum, the Doppler effects dominate over gravitational redshift. Their normalisations however differ due to the effects of light bending.
We notice also that the reflected spectra of GR have more photons at high energy for high inclination, as shown in Fig. 5(a). Indeed, the incident photon energies, in the disc frame, in the central area are amplified by the gravitational shift. Most of these reflected photons are observed at large inclinations. By means of the reflected spectra of NN as a reference, the spectra of GR shift to the red side for low inclinations and to the blue side for high inclinations. The importance of spectral shifts increases with the lowness of the source location.
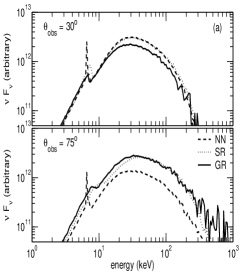
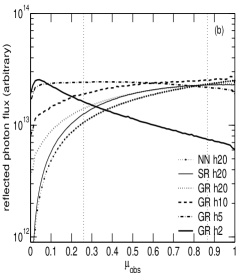
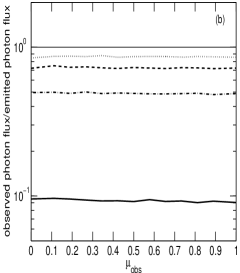
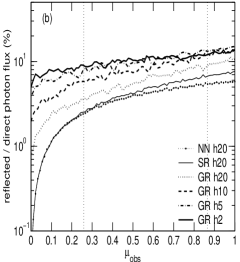
Fig. 5(b) shows the angular distribution of the reflected energy flux for different models. The intrinsic angle dependence of the Compton reflected component already differs significantly from isotropy with more photons reflected toward highly inclined lines of sight. In the SR case, the beaming effects due to the rotation of the disc lead to an overall larger reflected luminosity. Those beaming effects also affect the shape of the angular distribution by enhancing the reflected flux at higher inclination (i.e. in the directions close to the direction of motion of the material in the disc). This trend (larger reflection component at larger inclination) is further enhanced by the GR effects. The effects of light bending and gravitational shift are two-fold: First, the number and average energy of the illuminating photons are larger, as a result the total reflected flux is larger. Second, the path of the reflected photons is deflected toward higher inclinations.
Contrary to the NN and SR cases, in the GR model the angular distribution of the reflected component strongly depends on the source height. For lower source heights, the stronger illumination increases the reflected flux (by a factor of about two between and ). However when the X-ray source is very close to the black hole most of the radiation is lost in the hole and the reflected luminosity is decreased (by almost 40 between and ). Because the illumination of the central parts of the disc is stronger at low source heights, the light bending of reflected photons toward large inclination angles is then dramatically enhanced. So that, for or lower, the angular distribution peaks above , as shown in Fig. 5(b). This behaviour is qualitatively very different from the Newtonian case where the observed flux is stronger at low inclination.
3.3 Both components
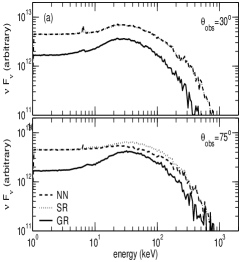
In this section, we combine the results from the Sec. 3.1 and 3.2 to study the dependence of the total (primary+reflected) spectrum on the parameters of the model. Fig. 6(a) shows the total spectra obtained for our three fiducial models at inclinations of and . Since the NN and SR spectra are dominated by the primary component they depend only weakly on the inclination angle. We can note however that the reflected features appear weaker at large inclination. The difference between SR and NN models appears only at high inclination when the reflection component is more strongly smeared.
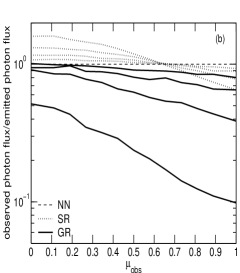
On the other hand the GR spectra have a reduced normalisation due to deflection of photons towards the disc and gravitational redshift. Moreover contrary to the NN and SR models the reflection bump appears much stronger at high inclination. This is a consequence of the light bending effects on the reflection component (see Sec. 3.2), while, as mentioned in Sec. 3.1 the primary emission remains almost isotropic.
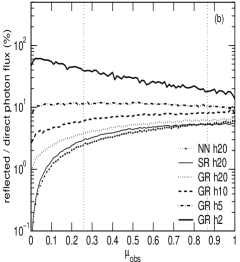
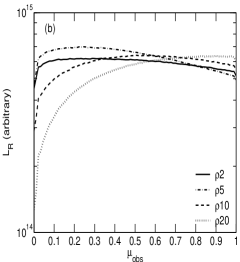
Let us consider further the angular dependence of the relative strength of the reflection. Fig. 6(b) shows the angular distribution of the fraction of the reflected flux to the primary flux, hereafter RPF. This figure shows that in all GR models the RPF is higher than in the simple NN or SR models. The relative amplitude of the reflection component strongly increases for lower source heights, specially at large inclinations, as discussed above.
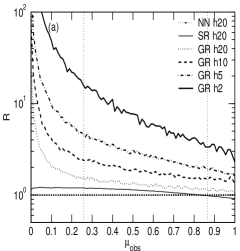
For the purpose of the comparison with data it is useful to transpose our results in terms of the usual reflection coefficient commonly used to quantify the relative fraction of reflection in observed spectra. By definition is unity for an isotropic source above an infinite reflector. This situation is closely approached for our NN model at large source height. Therefore we can estimate for our different models by simply computing the ratio of their RPF to that of the NN model. The result is shown in Fig. 7. In GR models is always larger than unity. It increases with both higher inclinations and lower source heights up to huge values (10-1000) in the most extreme cases.
4 Results for a ring-like source
In this section, we study the effects of the co-rotating source in flat space-time and in rotating curved space time with different heights, , and different radii, .
4.1 Primary component
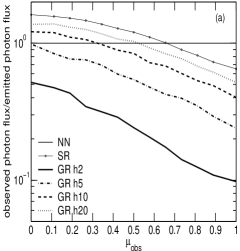
Contrary to the static on-axis case, in the off-axis source model, the rotation of the ring source affects the primary component through Doppler and beaming effects. In particular significant changes are expected in the angular distribution of the observed primary radiation, as can be seen in Fig. 8. The SR calculation shows that the effect of rotation is to beam the emission toward large inclination angles, as expected. This effect is stronger at lower distances to the axis i.e. at larger disc/ring velocities (see Fig. 8(b)). We obtain almost identical results for the GR model except that the total number of photons reaching infinity is lower due to light bending. As in the on-axis model, in GR, the reduction of the primary component is stronger for lower source heights, but contrary to the on-axis model the observed angular distribution of radiation is no longer isotropic (see Fig. 8(a)).
4.2 Reflection component
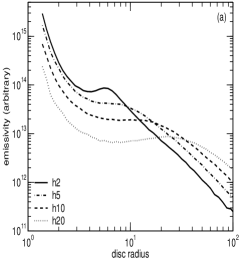
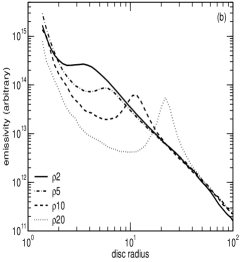
What is the effect of varying ring inner radius on the reflected component? Fig. 9 shows the disc emissivity for various values of the radius and height of the ring. For shorter (and/or ) the emission of the source is more sensitive to GR effects that tend to deflect its emission toward the disc. As a consequence, the overall illumination and reflected flux are larger. In addition, at short (and/or ) the emissivity of the central parts of the disc is larger. This means that most of the reflection is produced close to the black hole, leading to strong light bending toward the highly inclined lines of sight. Fig. 10 shows the angular distribution of the reflected radiation in the off-axis model for different source heights and ring radii. As discussed above, the qualitative dependences of the angular distribution of the reflected radiation on the ring radius and height of the source are very similar: smaller values lead to larger reflection fluxes strongly deflected toward large inclination observers.
4.3 Both components
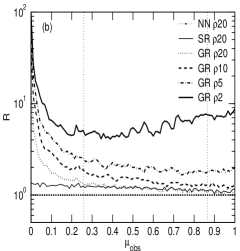
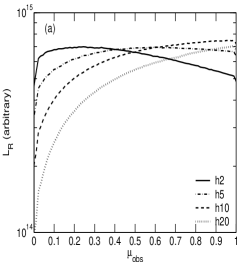
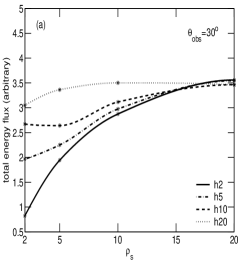
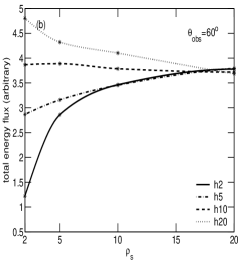
The dependence of total observed luminosity, in energy range 1-30 keV, on the ring source radius are shown in Fig. 11. As can be seen on this figure, the variations of the observed flux with are strongly angle dependent. For an inclination of at = 2, the luminosity drops by about 45% when the ring source radius decreases from 20 to 5 and only about 25% for . For , the luminosity even increases when is reduced from 20 to 2 for . There are similar effects when the source height diminishes for the fixed radius source. Fig. 12(a) compares total spectra obtained for the NN, SR, and GR models. The main difference with the results obtained for the on-axis model (Fig. 6) is that, at high inclinations the observed primary flux is boosted by the rotation of the ring (as discussed in Sec. 4.1). This beaming effect compensates the drop in luminosity due to light bending and at the normalisation of the NN and GR models are comparable. This strong Doppler beaming of the primary emission leads to a reduction of the RPF at large inclination at all and as shown in Fig 12(b). This is an important qualitative difference with the on-axis model where the overall spectra can become increasingly reflection dominated at large inclination. However the decline in the relative fraction of the reflected flux at large inclinations is less pronounced than in the NN model, and therefore the reflection coefficient (defined as the GR to NN RPF ratio, see Sec. 3.3) can still increase at large inclinations (see Fig. 7(b)).
4.4 Effects of returning radiation
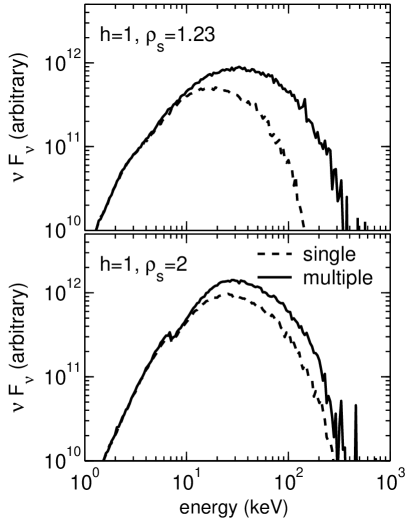
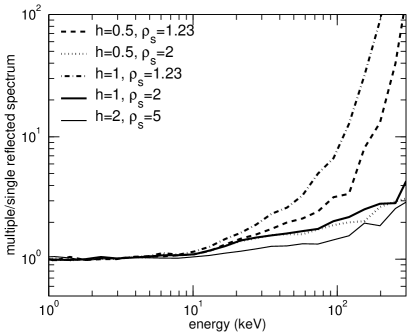
The first investigation on this effect is done by Cunningham (1976). Multiple reflections occur when reflected photons are deflected again toward the disc. Ross et al.(2002) study multiple reflection spectra from ionized slabs in newtonian geometry. These effects can be simply implemented into our numerical scheme, enabling us for the first time to evaluate accurately their influence. We now compare our results with what is obtained when they are neglected. The result is that although the returning radiation has always a negligible effect on the total reflected photon flux (less than 1 %), it can have a modest but significant impact on the total reflected energy flux, which is increased by up to 30 % in the extreme case , (the effect is stronger when the source is closer to the black hole). Indeed, multiple reflection photons have on average a higher energy. In fact, when the irradiation is concentrated close to the black hole a significant fraction of the reflected photons returns to the disc. Such as for and , there are about 16 % of reflected photons returning to the disc but there are only 5 %, for and . Below 10 keV most of them are absorbed while, at higher energy, more and more photons are reflected. The twice reflected is therefore harder than the single reflected spectrum. Fig. 13 compares reflected spectra calculated with and without returning radiation. Below 10 keV there is no significant difference and the returning radiation can safely be neglected. On the other hand, at higher energies, the two spectra differ significantly. Fig. 14 shows the ratio of spectra computed with and without returning radiation for different values of and . The difference between the two spectra increases strongly with energy. In the most extreme cases, the returning radiation can enhance the reflected flux by more than one order of magnitude, above 100 keV. We note that surprisingly, in our extreme limit the effect is more important for than for for which the illumination is concentrated closer to the black hole and the effects of returning radiation could be expected to be stronger. This is because when the source gets so close to the black hole, more photons are trapped into the hole instead of intercepting the disc or reaching infinity. Consequently both single and multiple reflections are reduced (it can be seen on Fig 16 that the reflected flux is larger at than at by a factor of ). At larger the effects of returning radiation are less dramatic and start being negligible for or/and (less than 10 % below 100 keV). In conclusion, the effects of returning radiation are relatively weak except above 10 keV when the illumination is concentrated within a few gravitational radii. These effects should be taken into account when fitting the spectra of extreme sources such as MGC 6-30-15 with broad band missions such as BeppoSAX, INTEGRAL or the recently launched Suzaku.
5 Connections with observations
In this section, we discuss our results in the context of current observations of AGN and black hole binaries. In Sec. 5.1, we check the consequences of neglecting the GR effects on the resulting best fit parameters when fitting observed spectra with a Newtonian reflection model. In Sec. 5.2 we discuss the predictions of the light bending model in the context of recent monitoring campaigns showing, in several sources, the absence of a linear correlation between reflection (or iron line flux) and primary emission. Finally, in Sec. 5.3 we show that the light bending model produces a non-linear relation between fluxes measured in different energy bands that we compare to the flux-flux relation observed in the narrow line Seyfert galaxy NGC4051.
5.1 Fits with a Newtonian model
| () | () | () | () | () | () | () | () | |
|---|---|---|---|---|---|---|---|---|
| 2 s | 6.9290 | 2.5484 | 52.293 | 358/ 60 | 5.0553 | 2.4555 | 20.260 | 167/ 60 |
| 2 m | 8.3042 | 2.3500 | 35.850 | 210/ 60 | 6.0765 | 2.1809 | 11.562 | 83/ 60 |
| 5 s | 1.7605 | 1.8170 | 0.6400 | 81/ 60 | 2.0264 | 1.96093 | 1.4027 | 11/ 60 |
| 5 m | 1.9595 | 1.8732 | 1.1093 | 63/ 60 | 2.2319 | 1.9761 | 1.7323 | 13/ 60 |
| 10 s | 1.3532 | 1.9163 | 0.7715 | 39/ 60 | 1.6105 | 1.9710 | 1.1996 | 10/ 60 |
| 10 m | 1.4258 | 1.9347 | 0.9354 | 32/ 60 | 1.6918 | 1.9796 | 1.3394 | 13/60 |
| 20 s | 1.1641 | 1.9700 | 0.8956 | 26/ 60 | 1.3458 | 1.9754 | 0.9947 | 7/ 60 |
| 20 m | 1.1876 | 1.9636 | 0.8905 | 26/ 60 | 1.3628 | 1.9787 | 1.0368 | 7/ 60 |
Actually, when dealing with real data, the amplitude of reflection is usually measured by spectral fits using a Newtonian reflection model. We therefore fitted our simulated GR spectra with the PEXRAV model (Magdziarz & Zdziarski 1995) under XSPEC. This procedure provides us with the estimate of that would be obtained if these GR spectra were observed and fit with this standard reflection model. The spectra calculated from PEXRAV correspond the NN with on-axis source. We fit the spectra in the energy range from 2 to 30 keV. Since the formation of the iron line is included in our Monte-Carlo simulations and not in the PEXRAV model, the 6.8-8 keV energy band was ignored. The results for = 2 with different are presented in Table 1
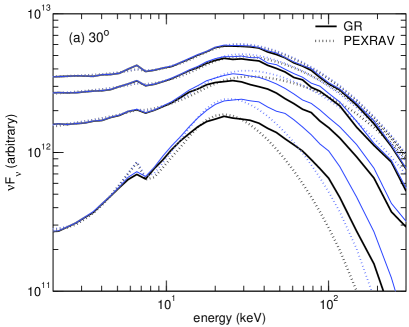
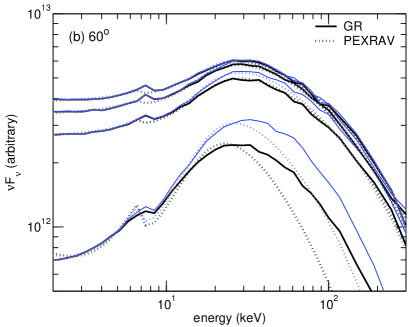
Although in most cases the 2-30 keV relativistic spectra are well described by the PEXRAV model (see Fig. 15), there are important differences between the values of estimated from spectral fits and those determined theoretically from the RPF ratios. These differences are due to the relativistic distortions of the reflected spectrum and illustrate their effects on the best-fit parameters obtained with a non-relativistic reflection model. Overall, fitting with PEXRAV tends to underestimate the reflection fraction. The discrepancies between the two estimates tend to be larger at small ring radii and inclination angles, since the GR spectral distortions are then more important. The values are not statistically meaningful since they depend on the arbitrary uncertainties that we had applied to the theoretical spectra, they are nonetheless interesting to compare the relative ’goodness’ of the PEXRAV approximation to the different GR models. A comparison of the values obtained for the different fits also shows that the PEXRAV model gives a better representation of the simulated spectra at both large and large inclinations.
We also note that it is often impossible to find a reasonably good approximation of the GR spectra with PEXRAV over a broader energy range because the GR reflected spectra are broader than the PEXRAV ones (see Fig. 15).
5.2 Reflection vs primary flux diagrams
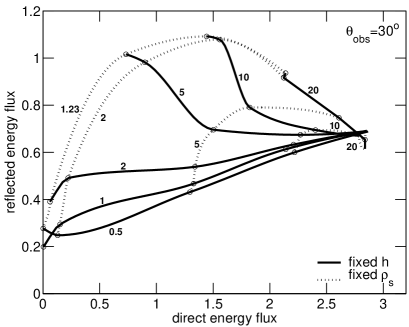
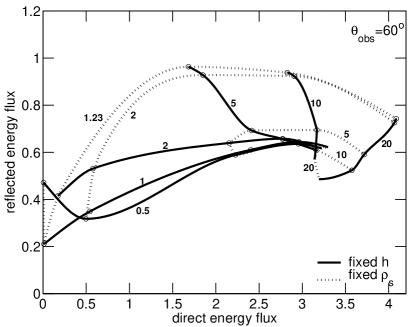
Fig 16 shows the dependence of the reflected flux on the primary emission when both and are varied. When the source height changes at constant radius and as long as , its track in this plane can be described according to three regimes: i) at low fluxes (or low source height) the reflected and primary flux are correlated, ii) at higher fluxes the reflection saturates at an almost constant value while the primary can change by a factor larger than 2, iii) at even higher fluxes the reflection component is weakly anti-correlated with the primary emission. This behaviour is described in great details by Miniutti and Fabian (2004). As shown by these authors many properties of the variability of Seyfert galaxies and black hole binaries can be understood in terms of fluctuations of the source height. In particular, the monitoring of Seyfert galaxies indicates that the reflection flux can be weakly variable when the primary emission changes dramatically (Papadakis et al. 2002; Markowitz et al. 2003). Moreover in at least two AGN, MGC 6-30-15 (Miniutti 2003; Reynolds et al. 2004) and NGC4051 (Ponti et al. 2006) and one X-ray binary (XTE J1650-500, Rossi et al. 2004) the reflection flux is correlated to the primary emission at low fluxes and saturates at higher fluxes, in qualitative agreement with the predictions of this model.
Fig 16 enables us to investigate further the model parameter space. It shows that if the radius is larger than the variability induced by change in the height is much too weak () to account for the variability observed in most accreting black holes. Therefore, if change in the source height, in the context of the light bending model, is to be responsible for the variability properties of MCG 6-30-15, NGC 4051 and XTE J1650-500, the illumination has to be concentrated within a few gravitational radii in these sources.
Let now consider the effects of changes in the source radius at constant height. At small source heights (), the overall trend is that the reflection and primary emission are weakly correlated: the reflected flux changes by at most 50 % when the primary flux increases by more than one order of magnitude which might be in qualitative agreement with some observations but is inconsistent with the strong non-linear correlation observed for instance in the low state of NGC4051.
At higher source heights, the reflected and primary flux become anti-correlated, which is not observed. The slope of the anti-correlation increases with . At we could observe large variations of the reflection component at constant primary flux. At even larger () the two components become correlated again but with a small amplitude of variability because of the vanishing light bending effects.
These results show that if the light bending model is to be the correct interpretation of the observations, the driver of the variability should be while the source radius has to be nearly constant and reasonably small ().
5.3 Flux-flux diagrams: application to NGC4051
A direct and quantitative comparison of our calculations with data is difficult. Besides the nuclear reflection and primary emission that we are attempting to model here, the observed spectra of accreting black holes can be affected by a number of features, such as absorption, emission lines from distant photo-ionised plasma or distant reflection. Fitting observational data using our model is therefore deferred to further work. On the other hand, using the published estimates of the reflected and primary emissions of observed sources for comparisons with our simulated reflection-primary flux diagrams, might be inaccurate because these estimates are model dependent. For instance Ponti et al. (2006) performed a spectro-temporal analysis of two XMM-Newton observations of the Narrow Line Seyfert 1, NGC 4051. They produced a reflected versus primary flux diagram showing a correlation at low fluxes and a saturation of the reflected flux at higher luminosities, in qualitative agreement with what is obtained in the light bending model when varying at constant . However in their spectral analysis they used a ionised reflection model and found that the data require the disc to be mildly ionised. In such conditions, the disc albedo is much larger than in the neutral case (see e.g. Malzac, Dumont & Mouchet 2005) and ionised reflection produces a strong soft excess below 1 keV which is not present if the disc is neutral. Therefore the exact numerical values of the integrated reflected flux obtained from their spectral fitting are not comparable with the results of our neutral model. To compare our results with data in a way that is less sensitive to ionisation and other spectral complications we will use flux-flux diagrams. These flux-flux plots reveal how the fluxes in two different energy bands relate to each other. They are often used to study the variability of AGNs and X-ray binaries independently of any model (see Taylor, Uttley & McHardy 2003; Uttley et al. 2004). In Fig 17 we compare the flux-flux relation predicted by the light bending model (assuming no intrinsic source fluctuations) to the data reported by Ponti et al. (2006). To produce this figure, we simulated light bending model spectra for the spectral index of primary emission observed in NGC4051 () and various source heights and radii. We computed the predicted photon flux in the two energy bands (1-1.4 and 4-10 keV) used by Ponti et al. (2006). In these two bands, the effects of ionisation of the reflection component on the total flux are weak.
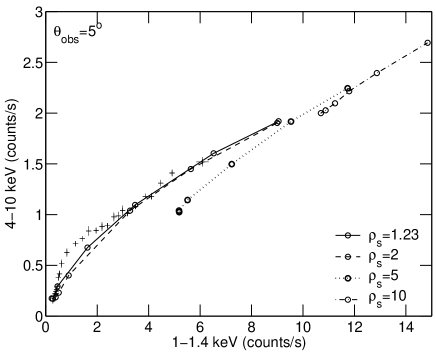
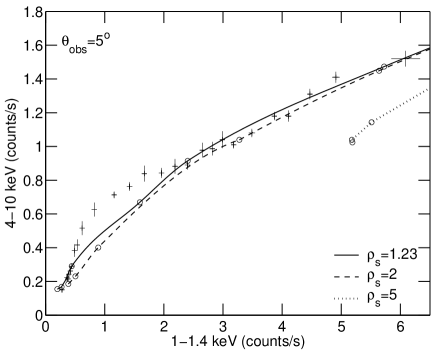
As the data of Ponti et al.(2006) are given in counts, they cannot be compared directly with the photon fluxes. The overall slope of the count-rate correlation also depends on the ratio of the detection efficiencies of XMM-Newton in these two bands. We estimated this ratio by convoluting simple power-law spectra with the EPIC pn response matrix used by Ponti et al. (2006). We found that this efficiency ratio is not sensitive to the shape of the model spectrum. It varies by less than 10% for power-law indices in the range . This range of is broader than the observed variations of the 2-10 keV spectral index in NGC4051. We therefore neglected the fluctuations of the efficiency ratio and used its average value to correct the model photon fluxes. Then, we had to fix the intrinsic ring source luminosity, which controls simultaneously the minimum and maximum achievable fluxes in both energy bands. It turns out that this parameter is very constrained by the observations. If it is too high, the minimum measured flux cannot be reproduced by the model. If, on the other hand, it is too low, the model points fall well below the observed correlation whatever and . The only solution is to set the intrinsic ring source luminosity so that the point obtained for the extreme case and , matches that of the minimum observed fluxes. Then it appears that the overall shape and amplitude of the correlation is qualitatively reproduced by the model for varying approximately between 0.5 and 10 and as shown in Fig 17. Of course, the detailed shape of the observed correlation is not perfectly reproduced by the model. Nonetheless, if one considers the simplicity of the model, as well as the many complications that could affect the shape and normalisation of the flux-flux correlation (fluctuation of primary spectral slope or the intrinsic source luminosity, effects of ionisation of the disc…) the agreement we obtain is remarkable.
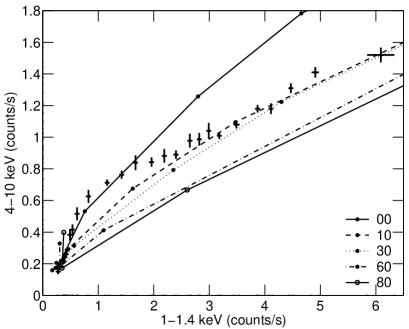
Naturally, the correlation predicted by the model depends on the inclination angle. Regarding NGC4051, we find a better agreement with the observed correlation for smaller inclinations (see Fig 18), in agreement with the Seyfert unification scheme (Antonucci 1993). Indeed, at large inclination the model correlation is more linear and the bending at low fluxes of the observed correlation is not well reproduced. On the other hand, if the source is seen exactly pole-on the minimum attainable flux in the 4-10 keV band is reduced by a factor of about 2, which allows the correlation obtained for to be closer to the data at low fluxes and largely above at higher fluxes, leaving room for a somewhat broader range in (up to ). In this case, and would have to vary simultaneously along the observed flux-flux correlation track. The emitting region is therefore confined within a few gravitational radius.
We note that for the quite extreme parameters that we infer the broad iron line is so smeared that it is difficult to detect (see Fig. 13). Pounds et al. (2004) fit the spectra produced from the same XMM-Newton data that we used and found that the curvature of the spectrum around the line energy can be explained by a partial covering model without any broad iron line (but see Ponti et al. 2006). In contrast, other studies present evidences for a broad Fe Kα line in NGC4051 (Guainazzi et al. 1996; Uttley et al. 2003). Fitting the XMM-Newton spectra with a relativistically blurred reflection model requires the illumination to be extremely concentrated in the innermost parts of the accretion disc (Ponti et al. 2006 derive a disc emissivity index ) in agreement with the numbers inferred here.
6 Conclusion
Considering an accretion disc illuminated by a ring source of hard X-rays, we have studied the dependence of the observed primary emission and reflection component on the radius of the ring source, its height above the disc and the inclination of the observer’s line of sight. We confirm the results of Miniutti et al. (2004) showing that the general relativistic effects can lead to strongly reflection dominated spectra when the primary source is very close to the black hole. Fitting these GR models with the newtonian reflection model PEXRAV leads to underestimate the reflection fraction . Moreover varying the height or radius of the ring source can produce important variations of the observed primary luminosity with little variations of the reflected flux. Therefore fluctuations of the height or radius of the ring source can lead to variability modes in which the primary and reflected components are apparently decoupled, as observed in several sources (Papadakis et al. 2002; Markowitz et al. 2003; Miniutti 2003; Reynolds et al. 2004; Ponti et al. 2006; Rossi et al. 2004). We have shown that the light bending model can produce a non-linear flux-flux relation that is similar to that observed in several sources. In particular we compared our model with the data of NGC4051, and found an acceptable agreement. This rough comparison suggests a low inclination angle (), an illuminating source at a radius 3 and a height varying from almost 0 up to about 10 gravitational radii.
Regarding the angular distribution of the radiation, we have found some important qualitative differences with respect to the Newtonian case. In particular, the reflected flux at larger inclination is relatively stronger than in the Newtonian model. If the ring source radius is zero (on-axis model), the total reflected flux as well as the reflection coefficient is larger at large inclination. In the off-axis model the total reflected flux decreases at larger inclinations but less sharply than in the Newtonian model, as a consequence can be larger at large inclinations.
We also found that the effects of returning radiation on the amplitude and shape of the reflection component can be safely neglected below 10 keV, but at higher energies the reflected flux can be enhanced by several orders of magnitude. This spectral distortion should be taken into account when fitting broadband spectra of accreting black holes which emission comes from regions very close from a black hole.
Acknowledgements.
We thank P.O. Petrucci for help in checking the results of our numerical scheme, Andrea Martocchia and Giovanni Miniutti for useful discussions and important suggestions, Gabriele Ponti for providing us with the NGC4051 data before publication. JM acknowledges support from the National Science Foundation under Grant No. PHY99-07949.References
- (1) Antonucci, R. 1993, ARA&A, 31, 473
- (2) Bardeen, James M., Press, William H., & Teukolsky, Saul A. 1972, ApJ, 178, 347
- (3) Beckwith, K., & Done, C. 2004, MNRAS, 352, 353
- (4) Bisnovatyi-Kogan, G. S., & Blinnikov, S. I. 1976, SvAL, 2, 191
- (5) Carter, B. 1968, Phys. Rev., 174, 1559
- (6) Chandrasekhar, S. 1983, The mathematical theory of black holes, Clarendon Press/Oxford University Press, Oxford/New York
- (7) Crummy, J., Fabian, A. C., Brandt, W. N., & Boller, Th. 2005, MNRAS, 361, 1197
- (8) Cunningham, C. T. 1976, ApJ, 208, 534
- (9) Dovčiak, M., Karas, V., & Yaqoob T. 2004, ApJS, 153, 205
- (10) Fabian, A. C., Rees, M. J., Stella, L., & White, N. E. 1989, MNRAS, 238, 729
- (11) Fabian, A. C. & Vaughan, S. 2003, MNRAS, 340, 28
- (12) Fabian, A. C. 2004, Frontiers of X-ray astronomy, Cambridge University Press, 165
- (13) Fabian, A. C., Miniutti, G., Gallo, L., Boller, Th., Tanaka, Y., Vaughan, S., & Ross, R. R. 2004, MNRAS, 353, 1071
- (14) Fabian, A. C., Miniutti, G., Iwasawa, K., & Ross, R. R. 2005, MNRAS, 361, 795
- (15) George, I. M., & Fabian, A. C. 1991, MNRAS, 249, 352
- (16) Guainazzi, M., Mihara, T., Otani, C., & Matsuoka, M. 1996, PASJ, 48, 781
- (17) Guainazzi, M., Matt, G., Antonelli, L. A., et al., & Piro, L. 1999, MNRAS, 310, 10
- (18) Haardt, F., & Maraschi, L. 1993, ApJ, 413, 507
- (19) Henri, G., & Petrucci, P. O. 1997, A&A, 326, 87
- (20) Laor, A. 1991, ApJ, 376, 90
- (21) Lee, J.C., Iwasawa, K., Houck, J. et al. 2002, ApJ, 570, 47
- (22) Magdziarz, P., & Zdziarski, A. A. 1995, MNRAS, 273, 837
- (23) Malzac, J., Jourdain, E., Petrucci, P. O., & Henri, G. 1998, A&A, 336, 807
- (24) Malzac, J., & Petrucci, P. O. 2002, MNRAS, 336, 1209
- (25) Malzac, J., Dumont, A.M., & Mouchet, M. 2005, A&A, 430, 761
- (26) Markowitz, A., Edelson, R., & Vaughan, S. 2003, ApJ, 598, 935
- (27) Martocchia, A., Karas, V., & Matt, G. 2000, MNRAS, 312, 817
- (28) Martocchia, A., Matt, G., & Karas, V. 2002, A&A, 383, 23
- (29) Matt, G., Perola, G. C., & Piro, L. 1991, A&A, 247, 25
- (30) Matt, G., Fabian, A. C., & Ross, R. R. 1996, MNRAS, 278, 1111
- (31) Miniutti, G., Fabian, A. C., Goyder, R., & Lasenby, A. N. 2003, MNRAS, 344, L22
- (32) Miniutti, G., & Fabian, A.C. 2004, MNRAS, 349, 1435
- (33) Miniutti, G., Fabian, A. C., & Miller, J. M. 2004, MNRAS, 351, 466
- (34) Morrisson, R., & McCammon, D. 1983, ApJ, 270, 119
- (35) Narayan, R., & Yi I. 1994, ApJ, 428, 13
- (36) Papadakis, I.E., Petrucci, P.O., Maraschi, L., McHardy, I.M., Uttley, P., & Haardt, F. 2002, ApJ, 573, 92
- (37) Pounds, K. A., Reeves, J. N., King, A. R., & Page, K. L. 2004, MNRAS, 350, 10
- (38) Ponti, G., Miniutti, G., Cappi, M., Maraschi, L., Fabian, A.C., & Iwasawa, K. 2006, MNRAS(submitted)
- (39) Porquet, D. 2006, A&A, 445, 5
- (40) Reynolds, C. S., & Begelman, M. C. 1997, ApJ, 488, 109
- (41) Reynolds, C. S., Wilms, J., Begelman, M. C., Staubert, R., & Kendziorra E., 2004, MNRAS, 349, 1153
- (42) Rossi, S., Miller, J.M., Homan, J., & Belloni, T. 2004, MSAIS, 5, 184
- (43) Rossi, S., Homan, J., Miller, J. M., & Belloni, T. 2005, MNRAS, 360, 763
- (44) Ross, R. R., Fabian, A. C., & Ballantyne, D. R. 2002, MNRAS, 336, 315
- (45) Ross, R. R., & Fabian, A. C. 2005, MNRAS, 358, 211
- (46) Shapiro, S. L., Lightman, A. P., & Eardley, D. M. 1976, ApJ, 204, 187
- (47) Tanaka, Y., Nandra, K., Fabian, A. C., Inoue, H., et al. 1995, Natur, 375, 659
- (48) Taylor, R.D., Uttley, P., & McHardy, I.M. 2003, MNRAS, 342, 31
- (49) Thorne, Kip S. 1974, ApJ, 191, 507
- (50) Uttley, P., Fruscione, A., McHardy, I., & Lamer, G. 2003, ApJ, 595, 656
- (51) Uttley, P., Taylor, R.D., McHardy, I.M., Page, M.J., Mason, K.O., Lamer, G., & Fruscione, A. 2004, MNRAS, 347, 1345
- (52) Wilms, J., Begelman, M.C., Reeves, J, et al., 2001, MNRAS, 328,27
Appendix A Constants of motion
The Kerr black hole metric is described in the Boyer-Lindquist spherical coordinates (BLC) as,
| (A1) |
where, (),
we can write the metric appropriate to a stationary axisymmetric space-time in the form (Chandrasekhar 1983)
| (A2) |
where
In this form, we can define a tetrad frame comoving with emitter, , and , by the contravariant basis vector, :
| (A3) |
We use the tetrad frame’s basis vector to express the relation between local photon’s direction and the constants of motion as
| (A4) |
where is the magnitude of photon momentum at local rest frame when is polar angle direction and is azimuthal angle direction in the spherical local emitter’s rest frame using radial direction as axis. For the radial direction toward the centre of black hole, For directions paralleling accretion disc, , and countering or following black hole rotation, or , respectively. and are the potential momentums in BLC in and direction, respectively. We obtain the constants of motion:
| (A5) | ||||
| (A6) | ||||
| (A7) |
where