Searching for a gigamaser in APM 08279+5255, and other short stories
Abstract
Bolometer arrays on large antennas at high, dry sites have unveiled a dusty population of massive, luminous galaxies – submillimetre galaxies, or SMGs – which make a significant contribution to the star-formation rate density at . The most crucial piece of information required to derive the history of obscured star formation is the redshift distribution of this galaxy population, , which breaks degeneracies in the models and allows the mass and dynamics of the galaxies to be explored via high-resolution three-dimensional imaging in CO and by determining their level of clustering. Many SMGs are extremely faint, optically; some have no plausible counterparts, even in the infrared (IR), making the determination of an unbiased very difficult. The arrival of the Herschel Space Observatory and next-generation ground-based submm cameras will likely exacerbate this so-called ‘redshift deadlock’. Here, we report the first test of a new method for determining redshifts, based on the observed dependence of maser and IR luminosities. We have searched the dusty, lensed, hyperluminous quasar, APM 08279+5255, for the 1612-, 1665- and 1667-MHz hydroxyl lines as well as the 22-GHz water line. At = 3.9 these are shifted to 329, 340 and 4,538 MHz. Our relatively shallow test data reveal no convincing maser activity but we set a meaningful constraint on the OH maser luminosity and we approach the expected thermal noise levels, meaning progress is possible. As an aside, we present deep new submm and radio imaging of this field. Using a simple shift-and-add technique we uncover a new submm galaxy, conceivably at the redshift of APM 08279+5255.
keywords:
galaxies: starburst – galaxies: high-redshift – masers – submillimetre – cosmology: observations – cosmology: early Universe1 Introduction
The SMG population, discovered using the SCUBA bolometer array (Holland et al. 1999), has led astronomers a merry dance for almost a decade (Blain et al. 2002). Early indications, based on the SCUBA Lens Survey (Smail et al. 2002), painted SMGs as an extraordinarily diverse population, some red, some blue, some starbursts, some with unequivocal AGN features (Ivison et al. 1998, 2000). However, over the years some common characteristics have become familiar: on the whole, SMGs are luminous (, where ) optically faint, red, morphologically disturbed, massive and distant (Smail et al. 1999; Gear et al. 2000; Chapman et al. 2003; Webb et al. 2003; Neri et al. 2003; Blain et al. 2004; Pope et al. 2005; Greve et al. 2005).
Due in large part to the spectroscopic survey of Chapman et al. (2005) we have seen a good deal of recent progress towards determining one of the most crucial parameters in galaxy-formation models: the redshift distribution of SMGs, . Knowledge of breaks degeneracies in the models (e.g. Blain et al. 1999); it also provides an estimate of their typical mass via the clustering characteristics of the population and, for individual galaxies, via observations of CO, C i, etc. (Frayer et al. 1998, 1999; Neri et al. 2003; Greve et al. 2005; Papadopoulos 2006).
However, the available spectroscopic redshift distribution for SMGs is biased: a radio detection is required to provide positional information (e.g. Ivison et al. 2002), and rest-frame ultraviolet emission lines are usually required to signal redshifts. It is not clear that all SMGs will display these traits, certainly not the dustiest systems at the highest redshifts (e.g. Berger et al. 2006). Furthermore, it is not clear how redshifts will be determined for the many thousands of dusty galaxies expected to be detected in wide-field surveys planned for SCUBA-2 (Audley et al. 2004) and the Herschel Space Observatory (Pilbratt 2004).
Powerful OH masing is relatively common amongst IR-luminous galaxies: the most recent survey (Darling & Giovanelli 2002) found that at least a third of ultraluminous IR galaxies (ULIRGs, ) support megamasers or gigamasers ( or , respectively). If starbursts are responsible for a significant fraction of the luminosity of ultraluminous and hyperluminous IR galaxies, as currently thought (e.g. Farrah et al. 2002), then the associated turbulence may enable low-gain unsaturated masing (Burdyuzha & Komberg 1990). The earliest OH maser-line observations appeared to demonstrate a quadratic relationship between OH and far-IR (FIR) luminosities, and . This is believed to be due to the abundant flux of FIR photons pumping an OH population inversion in the star-forming molecular gas (Baan 1985, 1989). Since FIR and radio luminosities () are well correlated (e.g. Helou, Soifer & Rowan-Robinson 1986), emission stimulated by the background radio continuum would then yield .
Townsend et al. (2001) argued that this quadratic dependence would yield OH masers detectable amongst the SMG population, with peak luminosity densities up to two orders of magnitude greater than those seen in current samples. This would allow us to determine an accurate and relatively unbiased for SMGs, as well as constraining the mass of their black holes, determining their geometric distances, even probing the evolution of fundamental constants (e.g. Barvainis & Antonucci 2005; Lo 2005; Kanekar et al. 2005; Caproni, Abraham & Mosquera Cuesta 2006). Correcting large maser samples for Malmquist bias (Kandalian 1996) favours a weaker dependence of on than originally thought, (Darling & Giovanelli 2002); on the other hand, using a smaller, complete sample continues to suggest a quadratic relationship, (Klöckner 2004). Either way, it is reasonable to expect OH maser emission from a high proportion of SMGs, with in the range 10 for and mJy-level peak flux densities.
Maser searches have clear advantages over other methods of determining for SMGs: i) the bandwidth requirement for blind detection of OH megamasers is low, 1 GHz ( = 165–835 MHz for = 1–10), smaller still with additional redshift constraints, and the technique avoids contamination by H i emission from local galaxies (Briggs 1998) since there is no significant SMG population at (Chapman et al. 2005); ii) the instantaneous survey area is limited only by the primary beam (several square degrees for an OH line search with the Giant Metre-wave Radio Telescope – GMRT); iii) interferometry permits some rejection of radio-frequency interference (RFI); iv) the position of an emission line can be pinpointed accurately, tying an emission line to an SMG unequivocably (to a few arcsec, at worst); finally, v) the dual-line 1665-/1667-MHz OH spectral signature can act as a check on the line identification and the reality of detections.
Here, we report a search for such maser emission. Blind searches for maser emission from SMGs will not be feasible until next-generation correlators are available, with their large instantaneous bandwidths. To begin testing this technique we must therefore choose a well-studied, luminous FIR galaxy, one with its redshift accurately determined (see also Klöckner 2004).
APM 08279+5255 (Irwin et al. 1998) is an obvious candidate: a dusty, broad-absorption-line (BAL) quasar embedded in a gas-rich starburst with a prodigious FIR luminosity (). HCN and several CO rotational transitions have been detected (Downes et al. 1999; Papadopoulos et al. 2001; Wagg et al. 2005) yielding an accurate systemic redshift: (Axel Weiss, private communication). Finally, adding to its appeal, it is amplified gravitationally by a factor (Lewis et al. 2002) to yield an apparent luminosity of 5 10. At = 3.9, its OH and H2O maser lines are both accessible to receivers at the National Radio Astronomy Observatory’s Very Large Array (VLA). Even adopting and an extreme lensing model (, for which we have no evidence) we would expect . For a line width of 150 km s-1 we would then predict a flux density of almost 50 mJy after amplification, within reach of current facilities.
We also report new submm, radio and IR imaging which led to the detection and characterisation of a new SMG in the vicinity of APM 08279+5255.
2 Searching for OH and H2O maser emission

The choice of configuration for our VLA P-band observations (340 MHz) was dictated by the need to reduce confusion and minimise RFI. We therefore opted for A configuration, obtaining 4.7 hr of integration during 2002 April on the redshifted OH lines. Approximately 80 per cent of the data were unaffected by RFI.
Data were taken with correlator mode 4, with one IF pair centred on the 1612.231-MHz hyperfine OH line and another IF pair covering the 1665.4018- and 1667.359-MHz lines. Each IF had 61 48.83-kHz channels, yielding a velocity coverage of 2,500 km s-1. Calibration scans of 0834+555, 0542+498 and 3C 274 (1230+123) were obtained, to calibrate phase, amplitude and absolute flux density, and to determine bandpass corrections.
The APM 08279+5255 field is relatively devoid of bright radio sources, so we were able to approach the thermal noise, with an r.m.s. level of 0.5 mJy beam-1 in a pseudo-continuum image made using all the spectral-line data, and as little as 3.4 mJy beam-1 in individual channel maps. Indeed, APM 08279+5255 is clearly detected in the pseudo-continuum P-band map, with an integrated 334-MHz flux density of mJy. It is not clear why, but one IF pair produced 2 deeper images than the other.
We also obtained approximately 10 hr of data with the VLA in its C configuration during a flexibly scheduled block of time in 2001 August, using the C-band (5-GHz) receivers centred on the redshifted 22,235.08-MHz H2O line. Correlator mode 2AD was used: a single IF pair with 31 390.63-kHz channels giving 760 km s-1 of velocity coverage. 3C 48 (0137+331) was used to set the flux density scale and 0834+555 (5.7 Jy at 4,527 MHz) was once again used as the local amplitude/phase calibrator. Again, APM 08279+5255 is detected in the pseudo-continuum map with an integrated flux density of mJy. Fig. 1 shows the overall radio spectral energy distribution (SED) of APM 08279+5255, adequately characterised by a power law of the form , together with submm and IR data from the literature.
For both the C (H2O) and P (OH) spectral-line data, image cubes were made using AIPS imagr, with clean boxes placed according to the positions of bright sources in the respective pseudo-continuum maps. Cubes were made with 1- and 2-channel averages and were inspected visually for signs of emission. Spectra were extracted as follows: APM 08279+5255 and three bright (30-mJy), compact, nearby sources were fitted (jmfit) in the pseudo-continuum images with single Gaussians, their sizes fixed to that of the synthesised beam (5.5 arcsec fwhm). Further fits were then made in each spectral plane of each image cube, now with both object sizes and pseudo-continuum positions fixed. The best-fit peak flux densities were thereby extracted for each channel. This technique delivers spectra with noise levels close to those measured in individual image planes and remains relatively free of other biases. The resulting spectra of APM 08279+5255 were divided by the respective data for the three bright, nearby sources, which had been co-added and normalised by their total mean flux density. This ‘flat field’ was also used to provide a check on the reality of any features in the spectra of APM 08279+5255. Noise estimates in each channel were obtained from source-free regions around the quasar using imstat. A simpler approach using possm gave similar results.

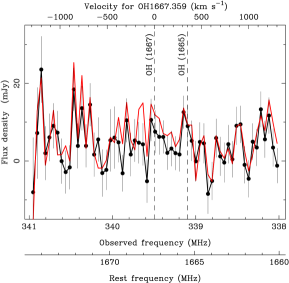


The resulting spectra are shown in Fig. 2 where no convincing emission from either OH or H2O can be seen. The two weak peaks seen at the expected frequencies of OH (1665 and 1667 MHz) are no more significant than the dip seen in the H2O spectrum at 100 km s-1. The r.m.s. noise levels in the regions around the OH lines at 1612 and 1665/1667 MHz are 2.9 and 5.8 mJy, with 0.17 mJy for the region around the H2O line. These figures compare reasonably well with the theoretical expectations: 2.9 mJy in P band and 0.16 mJy in C band, for good weather and 26 available antennas.
There is a very weak positive feature at zero velocity in the amplitude spectrum of the cross-correlation between the 1665-/1667-MHz spectrum shown in Fig. 2 and a matched filter corresponding to two Gaussian profiles with a separation fixed to that of the 1665- and 1667-MHz OH lines. We regard this as at best tentative evidence of emission.
Given the very limited total bandwidth (and the poor resulting velocity coverage) we cannot be sure that a broad line does not cover the entire spectral window: the IRAS 14070+0525 OH gigamaser (, Baan et al. 1992) would certainly do so, though we would have had no problem with a more typical linewidth (150 km s-1, Darling & Giovanelli 2002). However, the peak flux density of such an OH line cannot exceed our measured continuum levels, which are well below the limits we would quote based on the OH spectral noise. For the H2O line, where this is not true, we add the continuum level to the limit. The peak line flux densities from APM 08279+5255 are thus 3 8.7 mJy for the satellite line of OH at 1612 MHz, 17.4 mJy for the main lines at 1665/1667 MHz and 1.6 mJy for H2O. For a rectangular line of width 150 km s-1 we have constrained the lens-amplified OH luminosity to below (3 ). As outlined in §1, the apparent FIR luminosity of APM 08279+5255 exceeds that of IRAS 14070+0525 by three orders of magnitude so a detection of APM 08279+5255 was quite conceivable and the limit we have set for the main lines is significant, lying below our most pessimistic prediction. We note, however, that at least half of local ULIRGs are not detected and that FIR luminosity is clearly not the sole criterion for OH masing.
Following Townsend et al., the observed flux density at a frequency of a maser emitting with a peak rest-frame isotropic luminosity density of is given by , where is the luminosity distance. The factor in this expression accounts for the line width narrowing due to the redshift, and partially offsets the quadratic drop-off in with distance. As an example, the peak flux density of 10 mJy for the IRAS 14070+0525 OH gigamaser at ( m for km s-1 Mpc-1), translates into W MHz-1.
Our limits on maser-line peak flux densities are therefore and W MHz-1 for the OH lines at 1612 and 1665/1667 MHz and the H2O line, respectively. These are shown in Fig. 3 alongside observations of masers in other IR-luminous galaxies.
3 Ancilliary data: submm, radio and IR
The APM 08279+5255 field was imaged with the SCUBA bolometer array (Holland et al. 1999) during 2000 March to 2001 March, primarily to help characterise the point spread function for the deep submm survey of high-redshift radio galaxies (M00AU09) presented by Stevens et al. (2003).
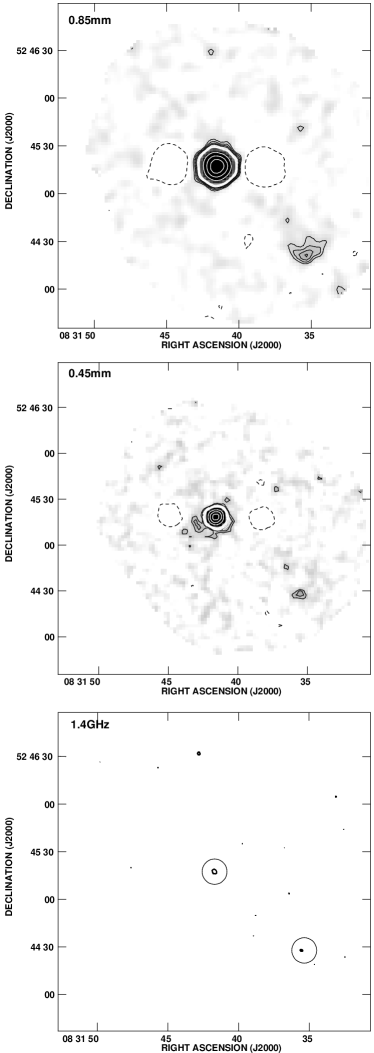
The James Clerk Maxwell Telescope’s (JCMT’s) secondary mirror was chopped and nodded by 30 arcsec in R.A., resulting in the characteristic 0.5/+1.0/0.5 beam profile visible in Fig. 4. After overheads, 25.6 ks were spent integrating on the field, split into approximately hour-long chunks separated by checks on focus, pointing accuracy and atmospheric opacity. The data were reduced using standard software, but were imaged using several new techniques. First, the high flux density of APM 08279+5255 allowed us to accurately align each 2,560-s of data, peaking up at 450 m having adopted the 1,400-MHz radio position for APM 08279+5255 (see later; R.A. , Dec. J2000). Despite the small shifts being applied (1.6 and 0.8 arcsec r.m.s. in R.A. and Dec., consistent with normal pointing drifts), this ‘shift-and-add’ approach made an appreciable difference to the final image. Second, we employed new versions of the surf setbolwt and rebin tasks, developed for the radio galaxy survey. These enabled us to determine accurately weighted and calibrated signal and noise values for square pixels of arbitrary size, independently of neighbouring pixels, at 13-arcsec fwhm resolution for 850 m. The signal and noise for each pixel correspond to the stream of data collected only when bolometers are centred within that pixel in a manner reminiscent of the ‘zero-footprint’ approach used by Scott et al. (2002). For Fig. 4 we smoothed with 6- and 3-arcsec fwhm Gaussians and the resulting 850- and 450-m maps have noise levels of 1.7 and 7 mJy beam-1 (before cleaning).
This led to the detection of an new, relatively bright SMG in the vicinity of APM 08279+5255, with R.A. (35s.48), Dec. (26.8′′) J2000 at 850 m (450 m), with a positional uncertainty of 2.2 arcsec at 850 m (1 , Ivison et al. 2005). We denote this source as SMM J083135.5+524425, adopting the mean submm position and following the IAU convention. Using the quasar to align the 450- and 850-m coordinate frames would result in a marginal (0.9-arcsec) reduction of the 4.4-arcsec offset between the 450- and 850-m positions. The peak 850-m flux density of the new source, bootstrapping the calibration from Uranus (via APM 08279+5255: and mJy at 450 and 850 m; cf. 84 and 285 mJy, Barvainis & Ivison 2002), is mJy, making it a relatively bright SMG (we would expect around one per 100 arcmin2). The flux density rises only marginally, to 11.4 mJy, when measured in an 14-arcsec-radius aperture, so any evidence that the source is extended is marginal at best. The SMG is also detected at 450 m with a flux density of mJy, though only following our shift-and-add treatment. The 450-/850-m flux ratios of the new SMG and APM 08279+5255 are consistent (8) to within the large photometric uncertainties.
APM 08279+5255 was then targeted at 1,400 MHz in an attempt to further constrain the position and redshift of the new SMG. For this we used the VLA in its A configuration, with correlator mode 4 (28 3.125-MHz channels, half each for left and right circular polarisations), during 2001 January. A noise level of 28 Jy beam-1 was achieved. SMM J083135.5+524425 has a single, bright and relatively compact radio counterpart centred at R.A. , Dec. J2000 (0.2-arcsec uncertainity, 1 ), with a total flux density of Jy (after correcting for bandwidth smearing and the primary beam response).
The total 1,400-MHz flux density of APM 08279+5255 was measured to be mJy so, as with the submm flux ratios discussed earlier, the submm/radio flux ratios (28) of the new SMG and APM 08279+5255 are consistent with one another to within the photometric uncertainties. This suggests they may well lie at a common redshift. A full track with the IRAM Plateau de Bure Interferometer, tuned to CO(4–3) at , would confirm or refute this possibility. Although perfectly consistent with a point source, we note that the morphology of the new SMG is suggestive of an arc and so we cannot rule out the possibility that this is a new lens feature caused by an unknown, unseen, massive foreground cluster, though we would then expect to see arcs from the more numerous optical/IR population.
We have inspected a -band image, obtained by us during 2000 November 12 in 1.0-arcsec seeing using the INGRID camera on the 4.2-m William Herschel Telescope (WHT), at the position of the radio emission. The region is blank in the near-IR, with (3, 1.5-arcsec radius aperture, Vega). Fig. 4 also reveals faint (3), coincident 450- and 850-m emission, 15 arcsec north east of SMM J083135.5+524425, this time with no radio or IR counterpart.
4 Concluding remarks
We have conducted a preliminary search for OH and H2O gigamaser emission from the distant, luminous quasar, APM 08279+5255. Our most pessimistic prediction – an OH maser exhibiting behaviour of the form , subject to extreme lens amplification – would have been within range of our search. We have thus set a meaningful constraint on the OH maser luminosity of APM 08279+5255, though we acknowledge that FIR luminosity is not the only criterion for OH masing.
We note that 10 more bandwidth is already available at the GMRT than was used here. Upcoming facilities will offer further improvements and we suggest that the Square Kilometre Array111http://www.skatelescope.org/, for example, should be designed to have sufficient instantaneous bandwidth to employ this technique effectively on blank-field SMGs of the type expected to be found in their thousands in the coming few years.
Our submm imaging has uncovered a new, bright SMG 75 arcsec from the quasar, possibly within a physical distance of 1 Mpc since their submm/radio flux ratios are a good match. Its position has been determined accurately in the radio, but it has no IR counterpart.
The effectiveness of the shift-and-add technique suggests deep archival searches could be made in the vicinity of other bright sources, e.g. JCMT pointing sources such as 3C 345 and BL Lac that have accumulated many hours of integration. Blank-field surveys with the next generation of sensitive submm cameras may also benefit from variants of this technique, particularly at 450 m.
Acknowledgements
Many thanks to Andy Biggs, Chris Carilli, Thomas Greve, Geraint Lewis, Nuria Lorente, Ian Smail, Lister Stavely-Smith, Jason Stevens, Richard Townsend and to an anonymous referee for some astute advice. The National Radio Astronomy Observatory is operated by Associated Universities Inc., under a cooperative agreement with the National Science Foundation. The JCMT is operated by the Joint Astronomy Centre in Hilo, Hawaii, on behalf of the Particle Physics and Astronomy Research Council in the UK, the National Research Council of Canada, and The Netherlands Organisation for Scientific Research. The WHT is operated on the island of La Palma by the Isaac Newton Group in the Spanish Observatorio del Roque de los Muchachos of the Instituto de Astrofisica de Canarias.
References
- (1) Audley M.D. et al., 2004, SPIE, 5498, 63
- (2) Baan W.A., 1985, Nature, 315, 26
- (3) Baan W.A., 1989, ApJ, 338, 804
- (4) Baan W.A. et al., 1992, ApJ, 396, L99
- (5) Barvainis R., Antonucci R., 2005, ApJ, 628, L89
- (6) Barvainis R., Ivison R., 2002, ApJ, 571, 712
- (7) Beelen A., Cox P., Benford D.J., Dowell C.D., Kovacs A., Bertoldi F., Omont A., Carilli C.L., 2006, A&A, in press (astro-ph/0603121)
- (8) Berger E. et al., 2006, ApJ, submitted (astro-ph/0603689)
- (9) Blain A.W. et al., 1999, MNRAS, 302, 632
- (10) Blain A.W., Smail I., Ivison R.J., Kneib J.-P., Frayer D.T., 2002, Physics Reports, 369, 111
- (11) Blain A.W., Chapman S.C., Smail I., Ivison R.J., 2004, ApJ, 611, 725
- (12) Briggs F.H., 1998, A&A, 336, 815
- (13) Burdyuzha V.V., Komberg B.V., 1990, A&A, 234, 40
- (14) Caproni A., Abraham Z., Mosquera Cuesta H.J., 2006, ApJ, 638, 120
- (15) Chapman S.C., Blain A.W., Ivison R.J., Smail I., 2003, Nature, 422, 695
- (16) Chapman S.C., Blain A.W., Smail I., Ivison R.J., 2005, ApJ, 622, 772
- (17) Darling J., Giovanelli R., 2002, A&A, 124, 100
- (18) Downes D., Neri R., Wiklind T., Wilner D.J., Shaver P.A., 1999, ApJ, 513, L1
- (19) Egami E., Neugebauer G., Soifer B.T., Matthews K., Ressler M., Becklin E.E., Murphy T.W., Dale D.A., 2000, ApJ, 535, 561
- (20) Farrah D., Serjeant S., Efstathiou A., Rowan-Robinson M., Verma A., 2002, MNRAS, 335, 1163
- (21) Frayer D.T. et al., 1998, ApJ, 506, L7
- (22) Frayer D.T. et al., 1999, ApJ, 513, L13
- (23) Gear W.K., Lilly S.J., Stevens J.A., Clements D.L., Webb T.M., Eales S.A., Dunne L., 2000, MNRAS, 316, L51
- (24) Greve T.R. et al. 2005, MNRAS, 359, 1165
- (25) Helou G., Soifer B.T., Rowan-Robinson M., 1986, ApJ, 298, L7
- (26) Holland W.S. et al., 1999, MNRAS, 303, 659
- (27) Irwin M.J. et al., 1998, ApJ, 505, 529
- (28) Ivison R.J. et al., 1998, MNRAS, 298, 583
- (29) Ivison R.J. et al., 2000, MNRAS, 315, 209
- (30) Ivison R.J. et al., 2002, MNRAS, 337, 1
- (31) Ivison R.J. et al., 2005, MNRAS, 364, 1025
- (32) Kandalian R.A., 1996, Astrophysics, 39, 237
- (33) Kanekar N. et al., 2005, Phys. Rev. Lett., 95, 261301
- (34) Klöckner H.-R., 2004, Ph. D. thesis, University of Groningen
- (35) Lewis G.F., Chapman S.C., Ibata R.A., Irwin M.J., Totten E.J., 1998, ApJ, 505, L1
- (36) Lewis G.F., Carilli C., Papadopoulos P., Ivison R.J., 2002, MNRAS, 330, L15
- (37) Lo K.Y., 2005, ARA&A, 43, 625
- (38) Neri R. et al., 2003, A&A, 597, L113
- (39) Papadopoulos P.P., 2006, In: ‘Astrochemistry throughout the universe: recent successes and current challenges’, IAU Symposium 231, eds Lis D.C., Blake G.A., Herbst E., Cambridge University Press, Cambridge, p. 173
- (40) Papadopoulos P., Ivison R., Carilli C., Lewis G., 2001, Nature, 409, 58
- (41) Pilbratt G.L., 2004, SPIE, 5487, 401
- (42) Pope A., Borys C., Scott D., Conselice C., Dickinson M., Mobasher B., 2005, MNRAS, 358, 149
- (43) Scott S. et al., 2002, MNRAS, 331, 817
- (44) Smail I., Ivison R.J., Kneib J.-P., Cowie L.L., Blain A.W., Barger A.J., Owen F.N., Morrison G., 1999, MNRAS, 308, 1061
- (45) Smail I., Ivison R.J., Blain A.W., Kneib J.-P., 2002, MNRAS, 331, 495
- (46) Soifer B.T. et al., 2004, ApJS, 154, 151
- (47) Stevens J.A. et al., 2003, Nature, 425, 264
- (48) Townsend R.H.D. et al., 2001, MNRAS, 328, L17
- (49) Wagg J., Wilner D.J., Neri R., Downes D., Wiklind T., 2005, ApJ, 634, L13
- (50) Webb T.M. et al., 2003, ApJ, 587, 41