Velocity dispersion, mass and the luminosity function of the fossil cluster RX J1416.4+2315 ††thanks: Based on observations obtained at the Gemini Observatory, which is operated by the Association of Universities for Research in Astronomy, Inc., under a cooperative agreement with the NSF on behalf of the Gemini partnership: the National Science Foundation (United States), the Particle Physics and Astronomy Research Council (United Kingdom), the National Research Council (Canada), CONICYT (Chile), the Australian Research Council (Australia), CNPq (Brazil) and CONICET (Argentina) – Observing run ID: GN-2005A-Q-38.
Abstract
We study the properties of the fossil cluster RX J1416.4+2315 through g’ and i’-band imaging and spectroscopy of 25 member galaxies. The system is at a mean redshift of 0.137 and has a velocity dispersion of 584 km s-1. Superimposed onto one quadrant of the cluster field there is a group of five galaxies at a mean redshift of 0.131, which, if included as part of the cluster, increases the velocity dispersion to 846 km/s. The central object of RX J1416.4+2315 is a normal elliptical galaxy, with no cD envelope. The luminosity function of the system, estimated by the number counts, and statistical background correction, in the range – 22.6 M –16.6, is well fitted by a Schechter function with M and (H0 = 70 km s-1 Mpc-1, =0.3, =0.7). The luminosity function obtained from the spectroscopically confirmed members in both g′ and i′ bands agrees with the photometric results. The mass of the system, h M⊙, its M/L of 445 h70 M⊙/LB⊙ and LX of 11 1043 h ergs s-1 (bolometric) suggest that this system is the second example of known fossil cluster, after RX J1552.2+2013, confirmed in the literature.
1 Introduction
It is now well recognised that a merged group can relax to form a single elliptical galaxy (e.g. Barnes 1989; Governato et al. 1991; Bode et al. 1993; Athanassoula et al. 1997). Since the timescale for the luminous group members to coalesce is shorter than the Hubble time, mergers of groups into elliptical galaxies are indeed expected to be observed. In 1994, Ponman et al. suggested that the elliptical-dominated system RX J1340.6+4018 was probably the remains of what previously constituted a group, and a similar conclusion was reached by Mulchaey and Zabludoff in 1999 about NGC 1132. It was thought that these galaxies were possibly a merged group with an X-ray halo with an extent of several hundreds of kpc with a rich population of dwarf galaxies associated with them. These systems were named fossil groups. A list of the fossil systems known to date are summarised in Table 4 of Mendes de Oliveira, Cypriano & Sodré (2006).
Vikhlinin et al. (1999) noted that the space density of fossil groups (which they called OLEGs, “X-ray overluminous elliptical galaxies”) is comparable to that of compact groups and that they represent 20% of clusters and groups with LX 1 10 ergs s-1, outnumbering compact groups of similar X-ray luminosities by a factor 3.5. Jones et al. (2003) defined a fossil group as a bound system of galaxies immersed in an extended X-ray halo brighter than erg s-1, for which the magnitude difference in the R band between the two brightest galaxies of thesystem exceeds two magnitudes. Searching for systems which followed these selection criteria in the WARPS survey, these authors revised the number density of fossil groups to be 2.4 10-7 Mpc-3, or 8–20 per cent of all systems with same X-ray luminosities (Jones et al. 2003). Analytical estimates of Milosavljevic et al. (2005) found that 5–40% of groups could be fossil groups while only 3–6% of more massive systems () are expected to be fossil clusters. The latter result has been confirmed by a search for fossil clusters within the C4 catalogue of clusters of Miller et al. (2005), based on the second release of the Sloan Digital Sky Survey (SDSS).
If the merger interpretation is correct, fossil groups may have seen little infall of large galaxies since their collapse (D’Onghia & Lake 2004). Thus they can be important for studying the formation and evolution of galaxies and the intragroup medium in isolated systems. They may also be a link between compact groups and elliptical galaxies (Ponman et al. 1994; Jones et al. 2003). Using N-body/hydrodynamical simulations to investigate the origin of such systems, D’Onghia et al. (2005) found that fossil groups stand out from the population of regular groups by their older ages. Those authors found that fossil groups have assembled half of their mass before redshift of one.
Mendes de Oliveira, Cypriano & Sodré (2006) recently published the first secure luminosity function determination of a fossil system, using spectroscopic data of 36 member galaxies in RX J1552.2 +2013. Two unexpected results were (1) the system was not a fossil group but a fossil cluster, given its richness and its velocity dispersion (623 km/s) and (2) the luminosity function not only had a lack of bright galaxies (by selection), but also had a lack of intermediate-luminosity systems (M = –18 mag). This was a surprise, since the general case for systems of similar velocity dispersion is to not have dips in their luminosity functions at intermediate luminosities (de Propris et al. 2003; Popesso et al. 2005). The exceptions are the central regions of rich clusters. For instance, the luminosity function of the core of the Coma cluster displays a dip at R and B (Trentham 1998), which is close to the dip found for the luminosity function of the fossil cluster RX J1552.2 +2013.
With the main goal of investigating how unique RX J1552.2+2013 is, we have obtained imaging and spectra for the galaxies in a second system classified by Jones et al. (2000) as a fossil group: RX J1416.4+2315. This object has the highest bolometric X-ray-luminosity (11 1043 h erg s-1) from all six fossil groups in the Jones et al. (2003) sample. Its extended X-ray emission is centered on the dominant galaxy and has an elliptical shape whose semi-major axis direction nearly coincides with the main optical axis of the central galaxy. Before this study, this system had only 6 known members. We determine the luminosity function of the group from g′, i′ photometry down to i′=22 and spectroscopy of 25 members. Sections 2 and 3 describe the observations, the reduction procedure and the results. In section 4 we present a discussion. When needed, we adopt the following values for the cosmological parameters: H0 = 70 km s-1 Mpc-1, =0.3, and =0.7.
2 Observations and reductions
The imaging and multi-slit spectroscopic observations of the galaxy group RX J1416.4+2315 were done with the GMOS instrument (Hook et al. 2002), mounted on the Gemini North telescope on Feb 22th and Mar 6–7/2005 respectively.
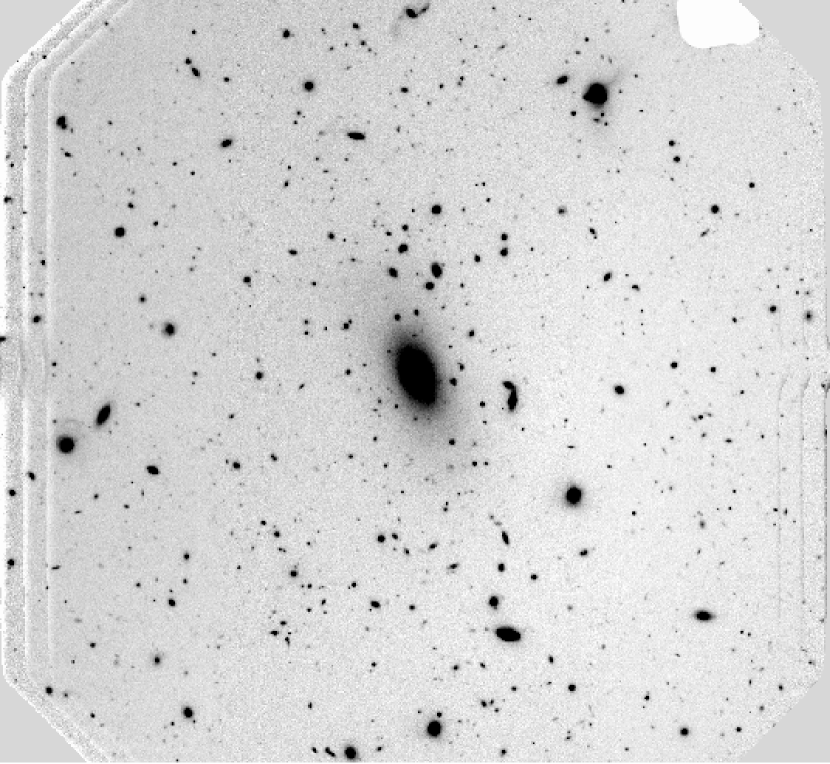
The imaging consisted of three dithered 200s exposures in each of the two filters from the SDSS system (Fukugita et al. 1996) g′ and i′. The typical FWHM for point sources was about 0.75” in all images. The observations were performed in photometric conditions. Fig. 1 displays the i′ image of the system.
The calibration to the standard SDSS photometric system was made using four stars of the Landolt (1992) field PG1323-086, which has been calibrated to the SDSS system. Using the dispersion between the measurements of the four stars we estimated the accuracy of the zero-point magnitude as 0.06 in both filters.
Standard reduction using the Gemini package GMOS was used. After flat fielding and cleaning the images for cosmic rays, the final frames were analysed with the program SExtractor (Bertin & Arnouts 1996). Positions and magnitudes (total and aperture) were obtained for all objects. We estimate that the galaxy catalogue is essentially complete down to 23.5 i′ magnitude, since the number counts turn over at i’=24 mag.
Candidates for spectroscopy were chosen based on the color-magnitude diagram shown in Fig. 2: 67 out of the 99 galaxies with Mi –17.7 (m) and bluer than the line drawn just above the red sequence (see continuous line in Figure) were observed spectroscopically. We successfully determined velocities of 55 of these galaxies. Galaxies above the red-sequence line are expected to be in the background, since their colors are redder than the expected colors of elliptical galaxies at the cluster redshift. Note that the outermost observed galaxy which turned out to be a member of the group/cluster has a distance of 542 h kpc from the X-ray center of RX J1416.4+2315.
Two multi-slit exposures of 70 minutes, each divided into three exposures, were obtained with GMOS through a mask with 1.0″ slits, using the R400 grating, for a final resolution of 6.5 Å (as measured from the FWHM of the arc lines), covering approximately the range 4000 – 8000 Å (depending on the position of each slitlet). Spectra of three of the members of RX J1416.4+2315 14 are shown in Fig. 3, for the galaxy with the largest, median and lowest luminosity in the sample.

Standard procedures were used to reduce the multi-slit spectra using tasks within the Gemini IRAF 111IRAF is distributed by the National Optical Astronomy Observatories, which are operated by the Association of Universities for Research in Astronomy, Inc., under cooperative agreement with the National Science Foundation. package. Wavelength calibration was done using Cu-Ar comparison-lamp exposures before and after the exposure.
Redshifts for galaxies with absorption lines were determined using the cross-correlation technique (Tonry & Davis 1979) as implemented in the package RVSAO (Kurtz & Mink 1998) running under IRAF. The final heliocentric velocities of the galaxies were obtained by cross-correlation with several template spectra. The final errors on the velocities were determined from the dispersion in the velocity estimates using several different galaxy and star templates. In the case of the five emission-line redshifts, the error was estimated from the dispersion in redshifts obtained using different emission lines. The resulting heliocentric velocities typically have estimated rms errors between 19 and 78 km s-1.


Table 1 lists positions, total magnitudes, aperture (g’ - i’) colors, radial velocities and the Tonry & Davis (1979) cross-correlation coefficient R for all galaxies with reliable velocity determination obtained in this study.
| (1) | (2) | (3) | (4) | (5) | (6) | (7) |
|---|---|---|---|---|---|---|
| Name | RA (2000) | DEC (2000) | i′ (AB Mag.) | g′-i′ | Vel. (km s-1) | R |
| G28.8+1752aaThe names of the galaxies are based on their 2000 celestial coordinates (RA seconds and DEC minutes and seconds). Thus galaxy Gab.c+defg is located at 14 16 ab.c +23 de fg. | 14 16 28.8 | +23 17 52 | 20.40 | 1.35 | 3.62 | |
| G28.8+1612 | 14 16 28.8 | +23 16 12 | 21.21 | 1.34 | 3.37 | |
| G22.7+1321 | 14 16 22.7 | +23 13 21 | 20.62 | 0.92 | 3.53 | |
| G18.5+1251 | 14 16 18.5 | +23 12 51 | 19.25 | 1.45 | 3.12 | |
| G17.9+1340 | 14 16 17.9 | +23 13 40 | 17.73 | 1.54 | 3.18 | |
| G24.5+1303 | 14 16 24.5 | +23 13 03 | 21.07 | 1.36 | 3.04 | |
| G24.8+1319 | 14 16 24.8 | +23 13 19 | 20.96 | 0.92 | 4.47 | |
| G35.5+1353 | 14 16 35.5 | +23 13 53 | 21.13 | 1.32 | 2.86 | |
| G28.9+1241 | 14 16 28.9 | +23 12 41 | 17.70 | 1.38 | 3.90 | |
| G21.2+1722 | 14 16 21.2 | +23 17 22 | 16.73 | 1.46 | 2.44 | |
| G21.3+1724 | 14 16 21.3 | +23 17 24 | 17.16 | 1.45 | 7.79 | |
| G37.7+1657 | 14 16 37.7 | +23 16 57 | 20.49 | 0.69 | bbRedshift measured from emission lines. | |
| G27.3+1618 | 14 16 27.3 | +23 16 18 | 19.74 | 1.40 | 3.46 | |
| G36.1+1624 | 14 16 36.1 | +23 16 24 | 18.42 | 1.04 | bbRedshift measured from emission lines. | |
| G34.6+1543 | 14 16 34.6 | +23 15 43 | 18.99 | 0.85 | bbRedshift measured from emission lines. | |
| G27.0+1758 | 14 16 27.0 | +23 17 58 | 18.41 | 1.57 | bbRedshift measured from emission lines. | |
| G20.9+1605 | 14 16 20.9 | +23 16 05 | 18.90 | 1.47 | 7.78 | |
| G37.9+1712 | 14 16 37.9 | +23 17 12 | 18.69 | 1.47 | 6.29 | |
| G21.0+1711 | 14 16 21.0 | +23 17 11 | 19.22 | 1.06 | 2.53 | |
| G27.6+1607 | 14 16 27.6 | +23 16 07 | 18.18 | 1.45 | 4.28 | |
| G29.1+1544 | 14 16 29.1 | +23 15 44 | 19.89 | 1.37 | 3.62 | |
| G27.5+1548 | 14 16 27.5 | +23 15 48 | 18.08 | 1.53 | 5.80 | |
| G25.2+1541 | 14 16 25.2 | +23 15 41 | 19.85 | 1.44 | 3.25 | |
| G30.4+1518 | 14 16 30.4 | +23 15 18 | 21.24 | 0.95 | bbRedshift measured from emission lines. | |
| G35.1+1442 | 14 16 35.1 | +23 14 42 | 18.02 | 1.35 | 9.36 | |
| G24.0+1332 | 14 16 24.0 | +23 13 32 | 16.74 | 1.24 | bbRedshift measured from emission lines. | |
| G24.1+1413 | 14 16 24.1 | +23 14 13 | 18.81 | 1.43 | bbRedshift measured from emission lines. | |
| G22.3+1729 | 14 16 22.3 | +23 17 29 | 18.67 | 1.41 | 5.17 | |
| G33.7+1733 | 14 16 33.7 | +23 17 33 | 18.93 | 1.41 | 5.75 | |
| G20.6+1517 | 14 16 20.6 | +23 15 17 | 18.39 | 1.55 | 7.98 | |
| G16.5+1601 | 14 16 26.5 | +23 16 01 | 18.31 | 1.56 | 6.22 | |
| G26.9+1524 | 14 16 26.9 | +23 15 24 | 14.19 | 1.74 | 7.28 | |
| G21.7+1407 | 14 16 21.7 | +23 14 07 | 21.04 | 1.25 | 2.56 | |
| G22.1+1452 | 14 16 22.1 | +23 14 52 | 21.25 | 0.79 | bbRedshift measured from emission lines. | |
| G33.6+1505 | 14 16 33.6 | +23 15 05 | 21.28 | 0.85 | 2.39 | |
| G28.7+1705 | 14 16 28.7 | +23 17 05 | 18.12 | 1.35 | 5.23 | |
| G24.0+1519 | 14 16 24.0 | +23 15 19 | 18.10 | 1.60 | 6.92 | |
| G17.0+1547 | 14 16 17.0 | +23 15 47 | 20.83 | 0.77 | bbRedshift measured from emission lines. | |
| G23.9+1512 | 14 16 23.9 | +23 15 12 | 17.30 | 1.65 | 6.95 | |
| G31.2+1415 | 14 16 31.2 | +23 14 15 | 20.30 | 1.42 | 4.78 | |
| G34.0+1359 | 14 16 34.0 | +23 13 59 | 18.70 | 1.49 | 5.58 | |
| G21.4+1625 | 14 16 21.4 | +23 16 25 | 20.20 | 1.08 | bbRedshift measured from emission lines. | |
| G37.7+1454 | 14 16 37.7 | +23 14 54 | 17.32 | 1.54 | bbRedshift measured from emission lines. | |
| G36.6+1506 | 14 16 36.6 | +23 15 06 | 17.55 | 1.67 | 5.00 | |
| G38.3+1308 | 14 16 38.3 | +23 13 08 | 19.70 | 0.87 | bbRedshift measured from emission lines. | |
| G34.0+1737 | 14 16 34.0 | +23 17 37 | 20.01 | 1.36 | 3.74 | |
| G28.9+1448 | 14 16 28.9 | +23 14 48 | 21.11 | 1.40 | 3.17 | |
| G26.2+1608 | 14 16 26.2 | +23 16 08 | 18.38 | 1.40 | bbRedshift measured from emission lines. | |
| G30.9+1749 | 14 16 30.9 | +23 17 49 | 19.10 | 1.24 | bbRedshift measured from emission lines. | |
| G38.1+1528 | 14 16 38.1 | +23 15 28 | 21.26 | 0.71 | bbRedshift measured from emission lines. | |
| G17.2+1455 | 14 16 17.2 | +23 14 55 | 21.02 | 0.77 | bbRedshift measured from emission lines. | |
| G36.9+1357 | 14 16 36.9 | +23 13 57 | 20.78 | 1.37 | bbRedshift measured from emission lines. | |
| G17.9+1624 | 14 16 17.9 | +23 16 24 | 20.29 | 1.16 | bbRedshift measured from emission lines. | |
| G26.4+1410 | 14 16 26.4 | +23 14 10 | 21.02 | 1.21 | bbRedshift measured from emission lines. |
3 Results
3.1 Galaxy velocity distribution
Using the heliocentric radial velocities listed in Table 1, we define the putative members of RX J1416.4+2315 as the 25 galaxies with velocities between 40185 and 42407 km s-1.
Initially the sub-sample with velocities between 38851 and 42407 km s-1 were analysed with the statistical software rostat (Beers, Flynn & Gebhartd 1990). It found a large gap in the velocity distribution between a foreground group of five galaxies at a mean redshift of 0.131 and the 25 galaxies which constituted what we identified as the cluster itself, at z = 0.137. Taking out these five galaxies, four of which have strong emission lines, no other data points were found outside a range. Fig. 4 shows the velocity histogram for all 30 galaxies, the five objects to the left of the diagram corresponding to the galaxies which probably belong to the foreground or infalling group mentioned above. These five objects are concentrated to the northeastern part of the cluster.

Using the robust bi-weighted estimator, rostat, the following values for the systemic redshift and velocity dispersion were found: and km s-1, for the 25 member galaxies, excluding the quintet, which has a mean velocity 2000 km s-1 below the mean velocity of the cluster itself.
The inclusion of the five objects increases the velocity dispersion to km s-1, for a mean redshift . We consider the determination of redshift and velocity dispersion for the 25 members the most representative values for RX J1416.4+2315, given the large velocity difference between the foreground group and the cluster. Note that for the determination of the luminosity function only the 25 galaxies were used.
We also calculated the velocity dispersion of RX J1416.4+2315 excluding five galaxies with strong emission lines from the sample of 25 members, since those galaxies often are not in dynamical equilibrium with the whole structure (e.g. Sodré et al. 1989; Biviano et al. 1997). By doing this exercise we found essentially the same results for the redshift () and the velocity dispersion ( km s-1).
Using the (Carlberg et al. 1996), as an estimator of the virial radius, we find a value of 1.2 Mpc for the sample with 25 galaxies. The spectroscopy presented here is then confined to about one half of the virial radius.
3.1.1 Dynamical mass
We determine the dynamical mass of the cluster by using four different mass estimators, as suggested by Heisler et al. (1985): virial, projected, average and median mass estimators (see Table 2). The final, adopted mass for the cluster, M = 1.9 M⊙, was obtained from the average value of the results of the four different estimators. This result agrees with the mass estimated from X-ray observations done recently by Khosroshahi et al. (2006), within a confidence level of 68%.
We should keep in mind the caution notes given by several authors (e.g. Girardi & Mezzeti 2001) on the reliability of mass determinations when the galaxies are distributed over a small (central) part of the cluster and the number of redshifts is limited.
| (1) | (2) | (3) | (4) | (5) |
|---|---|---|---|---|
| 25 galaxies (z=0.137) | All 30 galaxies (including group) | |||
| Estimator | Mass ( M⊙) | M/LB (h70M⊙/LB⊙) | Mass ( M⊙) | M/LB (h70 M⊙/LB⊙) |
| Virial | 1.9 | 450 | 4.8 | 996 |
| Projected | 2.4 | 571 | 6.8 | 1404 |
| Average | 1.8 | 427 | 4.2 | 873 |
| Median | 1.4 | 331 | 3.7 | 768 |
| Mean value | 1.9 | 445 | 4.9 | 1010 |
3.1.2 Mass-to-light ratio
We estimated the luminosity of the central regions of the cluster by adding up the luminosities of the spectroscopically confirmed members, taking into account the completeness correction derived from the spectroscopic sampling (see Fig. 5). The completeness correction was defined in Mendes de Oliveira, Cypriano & Sodré (2006). For this analysis, we have neglected all the galaxies redder than the limit of the red-cluster sequence, drawn in Fig. 2.
In order to compare with previous results, we have transformed our SLOAN g′ magnitude in standard Johnson–Morgan B magnitudes by adopting a color from Fukugita, Shimasaku & Ichikawa (1995). This is the typical color for an S0 galaxy, which we adopt as being representative of the morphological mix found in RX J1416.4+2315 , interpolated to the redshift of the cluster. The total magnitudes have been corrected for Galactic–extinction (Schlegel, Finkbeiner & Davis 1998) as well as for the -correction (Fukugita, Shimasaku & Ichikawa 1995), under the assumption that all galaxies have early morphological types, which is valid for most of the sample.
The total luminosity calculated within 542 kpc h is h L⊙B for 25 galaxies (and h L⊙B if we include the foreground quintet; stars in Fig. 2). This leads to a mass-to-light ratio in units of h70 M⊙/LB⊙ of 445. Results for the several mass estimates including or not the foreground group are presented in Table 2.
The velocity dispersion, dynamical mass, mass-to-light ratio and the richness of the structure determined from our observations, are typical of clusters. Taking also into account the X-ray measurements of Khosroshahi et al. (2006), we can safely characterise RX J1416.4+2315 as a cluster.
3.2 The Luminosity Function
We show in Fig. 5 the luminosity function (LF) of RX J1416.4+2315 (solid circles) obtained with the 25 galaxies with spectroscopically confirmed membership. The absolute magnitudes were calculated after correcting the observed magnitudes for Galactic extinction and applying -corrections. The selection function, also shown in Fig. 5, was calculated considering only galaxies bluer than the upper limit of the adopted red cluster sequence. We have also estimated photometrically the LF of RX J1416.4+2315 down to 22 and 23 mag for the i′ and g′ bands respectively, comfortably within the completeness limit, by adopting the procedure described in Mendes de Oliveira, Cypriano & Sodré (2006), which makes use of empty control fields imaged with the same instrument and filters (Boris et al. 2006, in preparation) but taken with longer exposure times. The photometric luminosity functions are shown in Fig. 5 as open triangles.
| (1) | (2) | (3) | (4) |
|---|---|---|---|
| Band | M | ||
| g′ | 17.0 – 23.0 | ||
| i′ | 16.0 – 22.0 |


It can be seen from Fig. 5 that both ways of estimating the LF lead to the same qualitative results, but clearly the spectroscopically determined LF is noisy at the faint end (mainly in the i′ band) and it does not fit a Schechter function well. On the other hand, the photometric LFs are better determined and they do fit Schechter functions. In Table 3 we show the best fitted parameters of a Schechter function fitted to the photometric LFs.
The results in both bands are similar and they show a large gap between the two brightest galaxies of the system, which characterises a fossil system. At the bright end, there are very few galaxies with magnitudes close to M∗. At the faint end, there is a significant increase of the number of dwarf galaxies, with the best fit being for a Schechter parameter between -1.2 and -1.3, which is typical of clusters (de Propris et al. 2003; Popesso et al. 2005).
Regarding the faint end slope, the results presented here are very consistent with the spectroscopic selected LF of RX J1416.4+2315 shown in Khosroshahi et al. (2006, ), but not with their photometric selected LF ().
3.3 Surface photometry of the brightest cluster galaxy
In the upper panel of Fig. 6, the azimuthally averaged photometric profile of the central galaxy of RX J1416.4+2315 is shown. The surface photometry was performed using the task ELLIPSE in STSDAS/IRAF, which fits ellipses to extended object isophotes. We allowed the ellipticity and position angle of the successive ellipses to change but the center remained fixed. The ellipse fitting was performed only in the higher signal to noise i′ image. For the g′ band, the software measured the isophotal levels using the parameters estimated in the i′ image. There were a few small objects within the outer isophotes of the central galaxy which were masked during the profile fitting procedure.

We have fitted an r1/4-profile to the bright end of the galaxy surface brightness profile, from well outside the seeing disk, at 3.0″, to a semi-major axis of 22.8″, which corresponds to the ellipse that contains half of the total galaxy luminosity and has a surface brightness mag arcsec-2. In the lower panel of Fig. 6, the residuals (data minus r1/4-profile model) for the i′-band data are shown. We find no significant light excess over the de-Vaucoleurs profile, in either band. This result agrees with previous analysis done by Jones et al. (2003). It is in contrast with the significant light excess found for the brightest galaxy of RX J1552.2+2013 .
4 Discussion
It is enlightening to compare the results presented here with the ones found for RX J1552.2+2013 , the only other fossil system which has been studied spectroscopically so far. Both are at similar redshifts and we have studied them using data from the same telescope and setup and using the same analysis methodology. Both systems were originally thought to be fossil groups (before our study) but turned out to be fossil clusters instead, as shown in Section 3 and summarised below.
Despite RX J1416.4+2315 having a bolometric X-ray emission of about three times that of RX J1552.2+2013 , both systems have comparable velocity dispersion ( km s-1), dynamical mass ( h M⊙ within about one half of the virial radius) and mass-to-light ratio (450–500 h70 M⊙/LB⊙). Taking these values into account, plus the richness of the structures, both systems can be classified as fossil clusters, which, following Milosavljevic et al. (2005), put them among very few other objects known in the Universe.
The luminosity functions of the two systems are not similar, however. While
RX J1552.2+2013
presented a decreasing number of faint galaxies (), being well fitted by a Schechter function with = –0.4 to
–0.8,
RX J1416.4+2315 presents an increasing one with = –1.2 to –1.3. Regarding
the inclination of the luminosity function in this magnitude interval, RX J1416.4+2315 is
very consistent with that observed for the average cluster population
(de Propris et al. 2003; Popesso et al. 2005). It is interesting to note that for RX J1552.2+2013 we found
an extended light envelope around the central galaxy of the system, measured as
an excess above a de Vaucoleurs profile, which indicated that the central object
was a cD galaxy. Mendes de Oliveira et al. (2006) argued that the envelope
around the cD may be related to the lack of faint galaxies. In that case and
also in Lopez-Cruz et al. (1997) it was argued that tidal disruption of faint galaxies can
form such a halo (see also Cypriano et al. 2006). For RX J1416.4+2315 we did not find
a lack of faint galaxies neither a light envelope associated with the central
galaxy, which is consistent with the scenario advocated in these previous
studies. Note that one might attribute the differences between the
two fossil clusters to differences in their masses (e.g., Lin & Mohr 2004).
However, the small mass diference between these systems, %,
does not seem to favor such an interpretation.
At the bright end of the luminosity function, RX J1552.2+2013 contains fewer bright galaxies with mag than RX J1416.4+2315 . While RX J1552.2+2013 has 7 spectroscopically confirmed members RX 1416J has only 3, in a magnitude range where the spectroscopic completeness are close to 100% in both cases. We could speculate that if both clusters started their evolution with similar numbers of bright galaxies, in the case of RX J1416.4+2315 more members have merged to form the central object. If this scenario is correct we would say that RX J1416.4+2315 , compared to RX J1552.2+2013 , is in a more advanced state of fossilisation.
References
- Athanassoula et al. (1997) Athanassoula, E., Makino, J., & Bosma, A. 1997, MNRAS, 286, 825
- Barnes (1989) Barnes, J. E. 1989, Nature, 338, 123
- Beers, Flynn & Gebhartd (1990) Beers, T. C., Flynn K. & Gebhardt 1990, AJ, 100, 32
- Bertin & Arnouts (1996) Bertin, E. & Arnouts, S. 1996, A&AS, 117, 393
- Biviano et al. (1997) Biviano, A., Katgert, P., Mazure, A., Moles, M., den Hartog, R., Perea, J., Focardi, P. 1997, A&A, 321, 84
- Bode et al. (1993) Bode, P. W., Cohn, H. N., & Lugger, P. M. 1993, ApJ, 416, 17
- Carlberg et al. (1996) Carlberg, R., Yee, H. K. C., Ellingson, E., Abraham, R., Gravel, P., Morris, S., Prichet, C. J.ApJ, 462, 32
- Cypriano et al. (2006) Cypriano, E. S., Sodré, L. J., Campusano, L. E., Dale, D. A., & Hardy, E. 2006, AJ (in press), astro-ph/0602019
- D’Onghia & Lake (2004) D’Onghia, E., Lake, G. 2004, ApJ, 612, 628
- D’Onghia et al. (2005) D’Onghia, E., J. Sommer-Larsen, A. D. Romeo, A. Burkert, K. Pedersen, L. Portinari, and J. Rasmussen 2005, ApJ630, L109-L112.
- Fukugita, Shimasaku & Ichikawa (1995) Fukugita, M., Shimasaku, K., Ichikawa, T. 1995, PASP, 107, 945
- Fukugita et al. (1996) Fukugita, M., Ichikawa, T., Gunn, J. E., Doi, M., Shimasaku, K. & Schneider, D. P. 1996, AJ, 111, 1748
- Girardi & Mezzeti (2001) Girardi, M. & Mezzeti, M. 2001, ApJ, 548, 79
- Governato et al. (1991) Governato, F., Bhatia, R., & Chincarini, G. 1991, ApJ, 371, L15
- Heisler et al. (1985) Heisler, J.. Tremaine, S.. Bahcall, J. N. 1985, ApJ, 298, 8
- Hook et al. (2002) Hook, Isobel, Allington-Smith, J. R., Beard, S., Crampton, D., Davies, R., Dickson, C. J., Ebbers, A., Fletcher, M., Jorgensen, I., Jean, I., Juneau, S., Murowinski, R., Nolan, R., Laidlaw, K., Leckie, B., Marshall, G.E., Purkins, T., Richardson, I., Roberts, S., Simons, D., Smith, M., Stilburn, J., Szeto, K., Tierney, C. J., Wolff, R. & Wooff, R. 2002, SPIE, 4841, Power Telescopes and Instrumentation into the New Millennium
- Jones et al. (2000) Jones, L. R., Ponman, T. J., Forbes, Duncan A. 2000, MNRAS, 312, 139
- Jones et al. (2003) Jones, L. R., Ponman, T. J., Horton, A., Babul, A., Ebeling, H., Burke, D. J. 2003, MNRAS, 343, 627
- Khosroshahi et al. (2006) Khosroshahi, H. G., Maughan, B. J., , Ponman, T. J., Jones, L. R., 2006, MNRASaccepted, astro-ph/0603606
- Kurtz & Mink (1998) Kurtz, M. J. & Mink, D. J. 1998, PASP, 110
- Landolt (1992) Landolt, A. U., 1992, AJ, 104, 340
- Lin & Mohr (2004) Lin, Y. T., Mohr, J. J., 2004, ApJ, 617, 879
- Lopez-Cruz et al. (1997) Lopez-Cruz, O., Yee, H. K. C., Brown, J. P., Jones, C.,, Forman, W. 1997, ApJ, 475, 97 , 934
- Mahdavi & Geller (2001) Mahdavi, A., Geller, M.J. 2001, ApJ, 554, 129
- Mendes de Oliveira et al. (2005) Mendes de Oliveira, C., Coelho, P., Gonzalez, J.J., Barbuy, B. 2005, AJ, 130, 55
- Mendes de Oliveira, Cypriano & Sodré (2006) Mendes de Oliveira, C., Cypriano, E. S. and Sodré, L. Jr. 2006, AJ, 131, 158
- Miller et al. (2005) Miller, C. J., et al. 2005, AJ, 130, 968
- Milosavljevic et al. (2005) Milosavljevic, M., Miller, C. J., Furlanetto, S. R., & Cooray, A. 2005, ApJL, in press, astro-ph/0509647
- Mulchaey & Zabludoff (1999) Mulchaey, J. S., & Zabludoff, A. I. 1999, ApJ, 514, 133
- Ponman et al. (1994) Ponman, T. J., Allan, D. J., Jones, L. R., Merrifield, M., McHardy, I. M., Lehto, H. J., Luppino, G. A. 1994, Nature, 369, 462
- Popesso et al. (2005) Popesso, P., Böhringer, H., Romaniello, M., Voges, W. 2005, A&A, 433, 415
- de Propris et al. (2003) De Propris, R. et al. 2003, MNRAS, 342, 725
- Schlegel, Finkbeiner & Davis (1998) Schlegel, S., Finkbeiner, D. P. & Davies, M. 1998, ApJ, 500, 525
- Sodré et al. (1989) Sodré, L., Jr., Capelato, H. V., Steiner, J. E., Mazure, A. 1989, AJ, 97, 1279
- Tonry & Davis (1979) Tonry, J. & Davis, M. 1979, AJ, 84, 1511
- Trentham (1998) Trentham, N. 1998, 293, 71
- Vikhlinin et al. (1999) Vikhlinin, A., McNamara, B. R., Hornstrup, A., Quintana, H., Forman, W., Jones, C., Way, M. 1999, ApJ, 520, 1