Evidence for precession of the isolated neutron star RX J0720.4$-$3125 ††thanks: Based on observations with XMM-Newton, an ESA Science Mission with instruments and contributions directly funded by ESA Member states and the USA (NASA)
The XMM-Newton spectra of the isolated neutron star RX J0720.43125 obtained over 4.5 years can be described by sinusoidal variations in the inferred blackbody temperature, the size of the emitting area and the depth of the absorption line with a period of 7.10.5 years, which we suggest to be the precession period of the neutron star. Precession of a neutron star with two hot spots of different temperature and size, probably not located exactly in antipodal positions, may account for the variations in the X-ray spectra, changes in the pulsed fraction, shape of the light curve and the phase-lag between soft and hard energy bands observed from RX J0720.43125. An independent sinusoidal fit to published and new pulse timing residuals from a coherent analysis covering 12 years yields a consistent period of 7.70.6 years supporting the precession model.
Key Words.:
stars: individual: RX J0720.4$-$3125 – stars: neutron – stars: magnetic fields – X-rays: stars1 Introduction
The 8.39 s X-ray pulsar RX J0720.4$-$3125 was discovered in the ROSAT all-sky survey data by Haberl et al. (1997) and identified with a faint blue optical star (Motch & Haberl 1998; Kulkarni & van Kerkwijk 1998; Kaplan et al. 2003) which shows a proper motion of about 100 mas/yr (Motch et al. 2003). The bright, soft X-ray source belongs to a small group of nearby radio-quiet isolated neutron stars with blackbody-like thermal X-ray spectra (for recent reviews see Treves et al. 2000; Motch 2001; Haberl 2004, 2005).
Broad absorption lines in the X-ray spectra of most of these objects were reported and are usually interpreted as due to resonant absorption at the proton cyclotron energy and/or bound-bound transitions in H or H-like He (Haberl et al. 2003; van Kerkwijk et al. 2004; Zane et al. 2005; Haberl et al. 2004, hereafter H04). This is suggestive of neutron star magnetic field strengths of 1013– G, values which are consistent with those derived from pulse timing for the period derivatives of RX J0720.4$-$3125 (Zane et al. 2002; Cropper et al. 2004; Kaplan & van Kerkwijk 2005a, hereafter K05) and RBS1223 (Kaplan & van Kerkwijk 2005b) if one assumes magnetic dipole braking. Moreover, RX J0720.4$-$3125 shows variations of the absorption line depth with pulse phase (H04) with the line being weakest near intensity maximum and deepest at the declining part of the pulse.
Among the seven thermal isolated neutron stars discovered with ROSAT, RX J0720.4$-$3125 is unique by showing a gradual change of the X-ray spectrum on a time scale of years accompanied by an energy-dependent change in the pulse profile (de Vries et al. 2004, hereafter D04). In this letter we report on further XMM-Newton observations of this enigmatic source which show that the long-term trends have reversed. We present pulse-phase averaged and pulse-phase resolved spectra from the EPIC-pn instrument. The results of our spectral and temporal analysis show strong evidence for a cyclic variation of the X-ray properties which strengthens the case of a precessing neutron star.
2 XMM-Newton observations
| Orbit | Observation | Date | Setup1 | Exp. [s] |
|---|---|---|---|---|
| 0078 | 0124100101 | 2000 May 13 | FF thin | 44275 |
| 0175 | 0132520301 | 2000 Nov. 21-22 | FF medium | 22952 |
| 0533 | 0156960201 | 2002 Nov. 6-7 | FF thin | 25696 |
| 0534 | 0156960401 | 2002 Nov. 8-9 | FF thin | 27273 |
| 0622 | 0158360201 | 2003 May 2-3 | SW thick | 51022 |
| 0711 | 0161960201 | 2003 Oct. 27 | SW thin | 12711 |
| 0711 | 0161960201 | 2003 Oct. 27-28 | SW medium | 17429 |
| 0815 | 0164560501 | 2004 May 22-23 | FF thin | 26642 |
| 0986 | 0300520201 | 2005 April 28 | FF thin | 37101 |
| 1060 | 0300520301 | 2005 Sep. 23 | FF thin | 34989 |
| 1086 | 0311590101 | 2005 Nov. 12-13 | FF thin | 33777 |
(1) Read-out mode and filter; FF: Full Frame; SW: Small Window.
The soft X-ray source RX J0720.4$-$3125 was observed with XMM-Newton (Jansen et al. 2001) as calibration target until 2004 when it was recognised to exhibit a variable spectrum. Since then we monitored the spectral evolution of the source. Here we utilise the data collected with the EPIC-pn camera (Strüder et al. 2001). The details of the XMM-Newton observations with the instrumental setup used for EPIC-pn are summarised in Table 1. RX J0720.4$-$3125 is slightly too bright for the full-frame (FF) read-out mode causing photon pile-up effects which systematically harden the spectrum (for details of this effect see H04). For a relative comparison of the spectra we ignore this effect but emphasise that small systematic differences are present between the FF mode spectra and those obtained in the faster small window (SW) mode which are free of pile-up effects. We do not use the observation with thick filter due to the much lower efficiency and different detector response. We screened out strong background flares and list the resulting net exposure times (including dead time which is important for SW mode) in Table 1. We processed the data using the XMM-Newton analysis system SAS6.5 and extracted spectra and light curves from circular regions with radius of 30″.
2.1 Pulse-phase averaged spectra
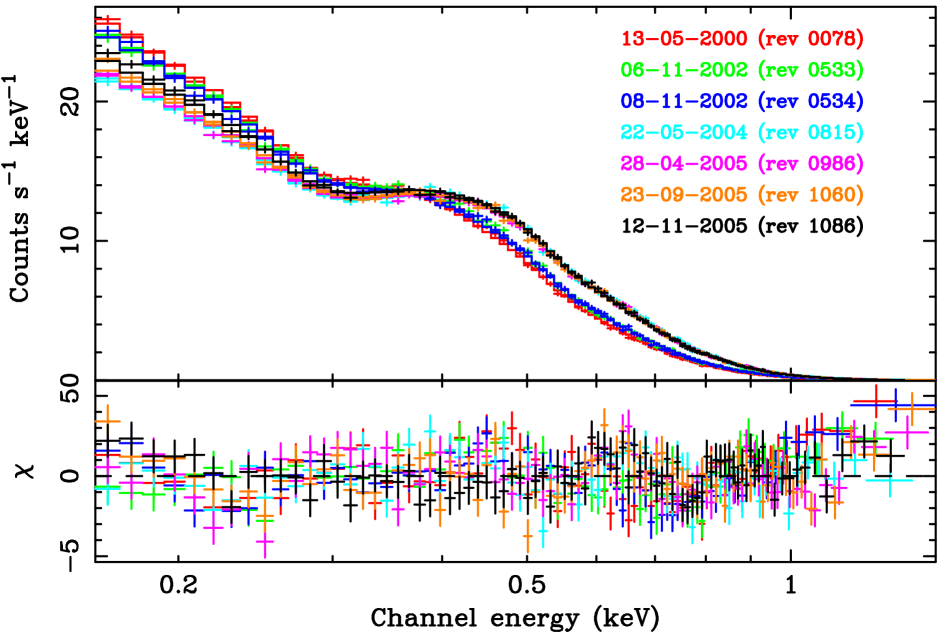
We extracted and analyzed pulse-phase averaged spectra for the 10 observations (at different epochs and different instrumental setup) following H04 who found that an absorbed blackbody model with a broad Gaussian absorption line represents the spectra of RX J0720.4$-$3125. We adopted this model and fitted the spectra simultaneously with the absorption column density (), the line energy and width common to all spectra. We allowed temperature and the normalizations of blackbody and line to vary freely between the spectra (except when observations were performed shortly after each other as those from satellite revolutions 533/534 and the two parts of 711). We present the EPIC-pn spectra obtained in FF mode with thin filter together with their best-fit model in Fig. 1 which shows that the long-term trend of spectral hardening has reversed. We report the fit results in Table 2. The common parameters obtained from the best fit are = 1.010.03 cm-2, a line energy of 2806 eV with a width of 5 eV.


| Orbit | kT [eV] | EW [eV] | Flux(1) [erg cm-2] |
|---|---|---|---|
| 0078 | 86.60.4 | 5.024.5 | 0.98 |
| 0175 | 86.50.5 | 8.687.7 | 1.01 |
| 0533/534 | 88.30.3 | 21.52.6 | 0.98 |
| 0711/711 | 91.30.6 | 73.74.9 | 1.19 |
| 0815 | 93.80.4 | 72.44.7 | 1.02 |
| 0986 | 93.50.4 | 68.35.2 | 1.02 |
| 1060 | 93.20.4 | 67.44.3 | 1.02 |
| 1086 | 92.60.4 | 67.53.5 | 1.04 |
Throughout the paper errors are given for a 90% confidence level.
(1)Observed flux is given in the energy band 0.12.4 keV. The
systematically higher flux from satellite revolution 711 is caused
by the systematic difference of FF and SW mode (FF pile-up losses).
The statistical uncertainties on the flux are less then 2 erg cm-2 s-1, which are
negligible compared to the stability of the instrument of about 1% between
observations.
The best fit values for the blackbody temperature (kT), the line equivalent width (EW) and the inferred emitting area (radius for a circular region with an assumed source distance of 300 pc) as function of time are shown in Fig. 2. All parameters can be described with a sinusoidal variation and we derive a period of 2580180 days for the variation in temperature. In the fit we do not include the values obtained from the SW mode spectra because of the possible systematic difference (pile-up, see above). Among the three parameters the temperature can be probably best constrained from the X-ray spectra. It is also not clear if there are additional variations in the absorption line energy and width which we assume to be constant in our current analysis. Therefore, we also fit a sine to the variations in EW and emission radius, but fix the period at the value found from the temperature variation.
2.2 Pulse-phase variations
We assigned pulse phases to all detected events using the X-ray timing ephemerides inferred by K05 (the “All Data” solution) and folded the light curves in different energy bands to produce pulse profiles. Examples from two XMM-Newton observations are presented in Fig. 3. As was found by D04 the pulse profile became deeper with time. In 2004 the shape of the profile changed in particular in the hard band and the hardness ratio was higher on average and showed more modulation as compared to the observation in May 2000. To investigate the spectral evolution as function of pulse phase we divided the pulse into five phase intervals of equal length with the first interval from phase 0.0 to 0.2.

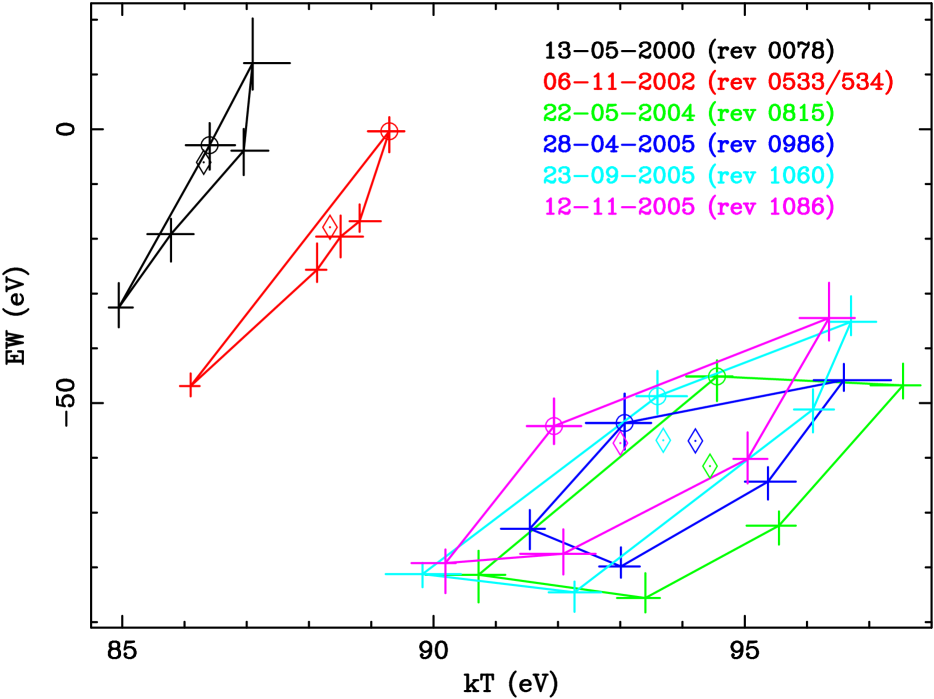
To avoid any systematic shifts due to different instrumental setups, we use only the seven observations in FF mode with thin filter. Similarly to the analysis of phase-averaged spectra, we performed a simultaneous fit with the same model to the 57 spectra. , the line energy and width were treated common to all spectra and were found to be consistent within the errors with the values derived from the phase-averaged spectra. In Fig. 4 the derived line EW is plotted versus temperature kT. For each observation the evolution of the two parameters during the X-ray pulse follows an ellipse-like track (sampled by five points from our finite number of phase intervals) in the kT-EW plane. The evolution proceeds counter-clockwise; the point marked with a circle indicates the phase interval 0.0-0.2. Several remarkable features are seen in Fig. 4: 1) The variation in kT was smaller during the first observations, consistent with the 2.5 eV value reported by H04. During the later observations the amplitude in the kT variation increased to 6 eV, almost as large as the long-term change of 8 eV seen in the phase-averaged spectra (Fig. 2). 2) The amplitude in the line EW variation is 40 eV and did not change significantly between the observations. 3) The long-term trend reversal of the evolution seen from the phase-averaged spectra (Fig. 2) after the May 2004 observation is similarly seen at all pulse phases. We note that during the pulse variation of the first observation the line is formally detected as emission line in phase interval 0.8-1.0, i.e. before reaching the intensity maximum. Also during the second observation there is an indication that the line in the phase-averaged spectrum is in emission rather than absorption. However, we can not exclude that this is caused by uncertainties in the calibration which may result in a systematic shift of the EW by 10 eV (for all spectra).
3 Discussion
The medium resolution X-ray spectra obtained by the EPIC-pn instrument show that the long-term spectral evolution discovered by D04 has reversed. The spectra became softer following the observation of May 2004 when the phase-averaged spectrum was hardest. All spectra can be well modeled by an absorbed blackbody continuum with a broad absorption line of Gaussian shape. The spectral variations both on time scales of years and during the 8.39 s pulse can be explained by variations in the inferred blackbody temperature, the depth of the absorption line and the size of the emitting area. In the simplest approach we did not allow changes in the energy and width of the line. If the line is caused by cyclotron absorption both parameters may be expected to vary. This requires a more detailed investigation of the spectra also involving the higher resolution RGS data which is work in progress.
Blackbody temperature, size of emitting area and absorption line depth (equivalent width) derived from the phase-averaged spectra follow a sinusoidal variation with a period of 7.1 years. Although the XMM-Newton observations do not yet cover a full period, it should be noted that the temperature of 794 eV derived from the ROSAT spectrum (H04), obtained in Sept. 1993, 6.6 years before the first XMM-Newton observation is also consistent with a periodic behavior of RX J0720.4$-$3125. The involved time scale is strongly suggestive of a scenario with a freely precessing neutron star, as first suggested by D04. The observed period of 7.1 yr is then naturally interpreted as the precession period of the neutron star.
In that case the precession period should also be visible in the residual phase shifts seen in the coherent timing analysis of the spin evolution of RX J0720.4$-$3125 (K05). Therefore, we fitted the phase residuals as inferred by K05 with a sinusoidal function, including the three EPIC-pn data points for the new XMM-Newton observations of 2005. The additional data points formally exclude the cubic model used by K05 and favour the sinusoidal model. We obtain a preliminary period of 2830220 days (7.70.6 years) from the phase residual analysis. This period is somewhat longer, but consistent with that inferred from the spectral analysis. The three ROSAT observations extend the time coverage to more than 12 years, i.e. more than 1.5 precession cycles. The results of a detailed timing analysis which directly includes precession in the spin frequency model will be presented in a forthcoming paper.
A picture based on thermal emission from two hot spots on the surface of a freely precessing neutron stars appears indeed promising in explaining many of the peculiar characteristics of RX J0720.4$-$3125 which have been a challenge so far. In this scenario the long-term change in temperature is produced by the different (phase-averaged) fractions of the two spots which enter into view as the star precesses. In order for such a model to work, the two emitting regions need to have different temperatures and sizes, as it has been recently proposed in the case of another member of the same class (RBS1223, Schwope et al. 2005). The nearly, but not exactly sinusoidal pulse profile (Fig. 3, D04) and the - to first order - successful fit of a phase-connected timing solution indicates that the poles can not be exactly antipodal, but must be predominantly in the same (East-West) hemisphere.
This is again similar to what was found for RBS1223. During the first XMM-Newton observation (May 2000), eV and the cooler, larger spot was predominantly visible, while four years later (May 2004), precession brought into view mostly the second, hotter and smaller spot, increasing the temperature to 95 eV. This may explain the observed temperature/emitting area variations and their anti-correlation (see Fig. 2). It should also be noted here that the total flux we see from the source stays quite constant, i.e. the two poles contribute about the same amount. The presence of two different, non-antipodal spots may also account for the observed changes in the pulsed fraction, light curve shape and for the apparent (spin) phase-lag seen between the soft and hard band.
In Fig. 5 we show the results obtained for such a model with a numerical code adapted from that discussed by Zane & Turolla (2006). First the phase-resolved spectrum is computed, having chosen values of the temperature and size of the two spots (, ), and of their relative angular displacement , to match the main observational features of RX J0720.4$-$3125. We then compute the phase-averaged spectrum and repeat the calculation at different precession phases for a chosen value of the precession angle . The two angles and denote the inclination of the line-of-sight with respect to the precession axis and that between the centre of one spot and the rotation axis, respectively. We assume isotropic blackbody emission from the caps and no attempt has been made to model the absorption feature. Relativistic ray-bending is included. Since the present calculation has mainly illustrative purposes, we do not account for the detector response and interstellar absorption nor do we look for parameter fine-tuning.


As can be seen from Fig. 5, the model is capable of reproducing the observed variations of the blackbody temperature and emitting area, and also their phase anti-correlation. The anti-correlation of the hardness ratio with the total intensity is also recovered, and the maximum of the hardness ratio shifts ahead in phase. The light curve modulation evolves and the shape changes, becoming more sharply peaked at certain epochs. Although no proper fitting of the observed light curves and spectra has been attempted at this stage (work in progress), our preliminary analysis strongly supports the idea that RX J0720.4$-$3125 is a precessing, nearly aligned rotator, seen almost equator-on. First indications seem to favour precession angles , larger than those found for radio-pulsars. We point out that the modulation is sensitive to the value of M/R (2GM/Rc2 = 0.42 in our example of Fig. 5). Although present uncertainties prevent us from reaching any firm conclusion, future improvements in the modelling and new observations may allow us to derive constraints on the equation of state.
The variations we see in the absorption line could also be related to the different properties of the two emitting spots. Two misaligned caps are suggestive of a magnetic field structure more complex than a core-centred dipole. A different field configuration could be then the origin of the different temperature and size of the spots. In both RBS1223 and RX J0720.4$-$3125 the inferred size of the hotter spot is smaller than that of the cooler spot, probably because the former is more confined due to a steeper surface gradient of the magnetic field. A further possibility is that the line changes (both with spin and precession phase) arise because of geometrical effects. The rays which reach the observer are at different angles with the magnetic field at different phases. This means that the contribution of ordinary and extraordinary photons to the total spectrum is phase-dependent. Since extraordinary photons contribute most to resonant absorption at the proton cyclotron energy, one expects the line properties to change with phase.
A detailed analysis of the implications of the precession of RX J0720.4$-$3125 for the physics of neutron star interiors is outside the scope of this letter. We note, however, that the star distortion is larger than that reported for radio-pulsars (e.g. Jones & Andersson 2001; Akgün et al. 2006) but smaller than that for Her X-1 (Ketsaris et al. 2000).
Acknowledgements.
The XMM-Newton project is supported by the Bundesministerium für Bildung und Forschung / Deutsches Zentrum für Luft- und Raumfahrt (BMBF/DLR), the Max-Planck-Gesellschaft and the Heidenhain-Stiftung. SZ acknowledges support from a PPARC AF. We thank Joachim Trümper, Mark Cropper and Gianluca Israel for fruitful discussions.References
- Akgün et al. (2006) Akgün, T., Link, B., & Wasserman, I. 2006, MNRAS, 365, 653
- Cropper et al. (2004) Cropper, M., Haberl, F., Zane, S., & Zavlin, V. E. 2004, MNRAS, 351, 1099
- de Vries et al. (2004) de Vries, C. P., Vink, J., Méndez, M., & Verbunt, F. 2004, A&A, 415, L31 (D04)
- Haberl (2004) Haberl, F. 2004, Advances in Space Research, 33, 638
- Haberl (2005) Haberl, F. 2005, in 5 years of Science with XMM-Newton, 39
- Haberl et al. (1997) Haberl, F., Motch, C., Buckley, D. A. H., Zickgraf, F. J., & Pietsch, W. 1997, A&A, 326, 662
- Haberl et al. (2003) Haberl, F., Schwope, A. D., Hambaryan, V., Hasinger, G., & Motch, C. 2003, A&A, 403, L19
- Haberl et al. (2004) Haberl, F., Zavlin, V. E., Trümper, J., & Burwitz, V. 2004, A&A, 419, 1077 (H04)
- Jansen et al. (2001) Jansen, F., Lumb, D., Altieri, B., et al. 2001, A&A, 365, L1
- Jones & Andersson (2001) Jones, D. I. & Andersson, N. 2001, MNRAS, 324, 811
- Kaplan & van Kerkwijk (2005a) Kaplan, D. L. & van Kerkwijk, M. H. 2005a, ApJ, 628, L45 (K05)
- Kaplan & van Kerkwijk (2005b) Kaplan, D. L. & van Kerkwijk, M. H. 2005b, ApJ, 635, L65
- Kaplan et al. (2003) Kaplan, D. L., van Kerkwijk, M. H., Marshall, H. L., et al. 2003, ApJ, 590, 1008
- Ketsaris et al. (2000) Ketsaris, N. A., Kuster, M., Postnov, K. A., et al. 2000, in Proc. Intl. Workshop: Hot Points in Astrophysics, JINR, Dubna, Russia, 192
- Kulkarni & van Kerkwijk (1998) Kulkarni, S. R. & van Kerkwijk, M. H. 1998, ApJ, 507, L49
- Motch (2001) Motch, C. 2001, in X-ray Astronomy, Stellar Endpoints, AGN, and the Diffuse X-ray Background, AIP Conference Proceedings, 244
- Motch & Haberl (1998) Motch, C. & Haberl, F. 1998, A&A, 333, L59
- Motch et al. (2003) Motch, C., Zavlin, V. E., & Haberl, F. 2003, A&A, 408, 323
- Schwope et al. (2005) Schwope, A. D., Hambaryan, V., Haberl, F., & Motch, C. 2005, A&A, 441, 597
- Strüder et al. (2001) Strüder, L., Briel, U., Dennerl, K., et al. 2001, A&A, 365, L18
- Treves et al. (2000) Treves, A., Turolla, R., Zane, S., & Colpi, M. 2000, PASP, 112, 297
- van Kerkwijk et al. (2004) van Kerkwijk, M. H., Kaplan, D. L., Durant, M., Kulkarni, S. R., & Paerels, F. 2004, ApJ, 608, 432
- Zane et al. (2005) Zane, S., Cropper, M., Turolla, R., et al. 2005, ApJ, 627, 397
- Zane et al. (2002) Zane, S., Haberl, F., Cropper, M., et al. 2002, MNRAS, 334, 345
- Zane & Turolla (2006) Zane, S. & Turolla, R. 2006, MNRAS, 366, 727