Cygnus A: A Long Wavelength Resolution of the Hot Spots
Abstract
This paper presents observations of Cygnus A at 74 and 327 MHz at angular resolutions of approximately 10″ and 3″, respectively. These observations are among the highest angular resolutions obtained below 1000 MHz for this object. While the angular resolution at 74 MHz is not sufficient to separate clearly the hot spots from the lobes, guided by 151 and 327 MHz images, we have estimated the 74 MHz emission from the hot spots. We confirm that the emission from both the western and eastern hot spots flattens at low frequencies and that there is a spectral asymmetry between the two. For the eastern hot spot, a low-energy cutoff in the electron energy spectrum appears to explain the flattening, which implies a cutoff Lorentz factor , though we cannot exclude the possibility that there might be a moderate level of free-free absorption. For the western hot spot, the current observations are not sufficient to distinguish between a free-free absorped power-law spectrum and a synchrotron self-absorbed spectrum.
1 Introduction
Cygnus A is the exemplar of a Faranoff-Riley Type II radio galaxy, marked by two large, limb-brightened lobes located nearly symmetrically around a central core source. Its evolution (Blandford & Rees, 1974; Scheuer, 1974) is powered a “central engine” that ejects two, oppositely directed relativistic jets, which are shocked and terminated in “hot spots”; driven by the momentum of the jets, the hot spots move into the ambient medium, while the shocked material flows out and “behind” the hot spots forming “lobes.” As one of the nearest powerful radio galaxies, Cyg A (, Spinrad & Stauffer 1982) presents a valuable observational laboratory with which to probe, at high resolution, the acceleration and emission mechanisms within radio galaxies (Carilli & Barthel, 1996; Carilli & Harris, 1996).
Using observations at frequencies from 151 MHz to 22 GHz, Carilli et al. (1991) performed a comprehensive analysis of the emission of Cyg A. They confirmed that the lobes are powered by synchrotron emission from particles accelerated in the hot spots and then backflowing into the lobes. Consistent with the notion that the hot spots are burrowing their way into the ambient medium, the spectral analysis by Carilli et al. (1991) showed that the the emitting particles nearer the core have a greater synchrotron age than those near the hot spots. They also showed that, above 1 GHz, the spectra of the hot spots are consistent with relativistic particles being injected continuously through a strong, nonrelativistic shock by diffusive shock acceleration.
Below 1 GHz, Carilli et al. (1991) found that the spectra of the hot spots flatten. They considered two explanations for this low-frequency flattening, a low-energy cutoff (LEC) in the electron energy power spectrum or synchtrotron self-absorption (SSA). They favored the former, both on observational grounds—model fits produced a superior for LEC vs. SSA—and on theoretical grounds—the SSA model implied magnetic field strengths within the hot spots of at least 3 G, orders of magnitude above the minimum-energy field strengths. Carilli et al. (1991) found that an LEC implies a minimum electron Lorentz factor of in the hot spots, assuming minimum-energy magnetic field strengths. Carilli et al. (1991) also considered and rejected thermal absorption by foreground gas as an explanation for the spectral flattening as the implied electron densities are far too high for internal absorption and there is no optical H emission from the cluster gas within which Cyg A is embedded.
The conclusion of an electron LEC within the hot spots relies essentially on just two data, measured intensities at 151 and 327 MHz. Kassim et al. (1996) conducted fairly low resolution observations (25″) at 74 MHz and found a marked asymmetry, with the western lobe being significantly weaker than the eastern lobe. They re-analyzed optical observations by Carilli et al. (1989), finding that the amount of extinction in this direction may have been underestimated. Thus, Kassim et al. (1996) attributed the asymmetry in the lobe emission to thermal (free-free) absorption by foreground Galactic material, postulated to be associated with a known H filament. However, their observations did not have sufficient angular resolution to separate the emission from the lobes and hot spots, so they were unable to address the extent to which thermal absorption affects the low-frequency spectra of the hot spots.
This paper presents new, higher-resolution 74 and 327 MHz observations of Cyg A made using the VLA in combination with the innermost antenna of the Very Long Baseline Array (VLBA) connected to the VLA via optical fiber link. The so-called “VLA Pie Town link” connected interferometer provides an approximate factor of two improvement in angular resolution over the original observations in Carilli et al. (1991) and Kassim et al. (1996). We use these higher resolution observation to revisit the low-frequency spectra of the hot spots.
2 Observations
Our observations were conducted on 2003 August 12 with the VLA in its most extended configuration (A configuration) and with the VLBA Pie Town antenna connected via a real-time optical fiber link (the “PT link,” Beresford, 2000). The longest baseline in the resulting array is 73 km. Our observations were conducted simultaneously at 74 and 327 MHz. Table 1 summarizes the observing and image parameters.
| Observation: | 74 MHz | 327 MHz |
|---|---|---|
| Central Frequency (MHz) | 73.8 | 327.5 |
| Bandwidth (MHz) | 1.5 | 3 |
| Channels (#) | 63 | 31 |
| Time on Source (hrs.) | 13.6 | 13.6 |
| Resolution (″) | ||
| RMS noise (mJy beam-1) | 970 | 24 |
| Peak Flux Density (Jy beam-1) | 1040 | 113 |
| Image Dynamic Range | 1070 | 4700 |
Spectral-line mode was used for both frequencies with 63 channels across a 1.5 MHz bandwidth at 74 MHz and 31 channels across a 3 MHz bandwidth at 327 MHz. Spectral-line mode is the standard mode at both frequencies because it is generally necessary to reduce bandwidth smearing across the wide fields of view and to allow the removal of radio frequency interference (RFI).
For both frequencies, existing models of Cyg A, formed from previous A-configuration observations, were used to calibrate the bandpass response and complex antenna gains. The flux densities of these models are fixed to that found by interpolating the spectrum of Baars et al. (1977). However, the distances from the Pie Town antenna to the VLA antennas are from about 45 to 73 km, while the existing models accurately represent the structure of Cyg A only on angular scales corresponding to baselines of 35 km or less, the size of the VLA A configuration. Consequently, we calibrated initially only with a single short ( min.) time interval near the end of the observation when the elevation of Cyg A was low enough that all projected baselines to Pie Town were shorter than 35 km; the models were then able to accurately constrain that antenna’s gain and bandpass. Models at higher resolution from higher frequencies did not result in acceptable calibration, indicating that there are significant changes in structure from higher frequencies.
Once calibrated, initial images were made. Usually, 74 and 327 MHz VLA observations require wide-field imaging to account for the non-coplanar nature of the array. Extending the baseline lengths to the 70 km PT link would exacerbate the non-coplanar problem. However, Cyg A is so much stronger than all other sources in the field of view that it is not necessary to utilize wide-field imaging as essentially no other sources can be detected. Many rounds of phase-only self-calibration followed by imaging were conducted at both frequencies until the final images were obtained; amplitude self-calibration was not used because experience shows that the gain amplitude stability is quite good.
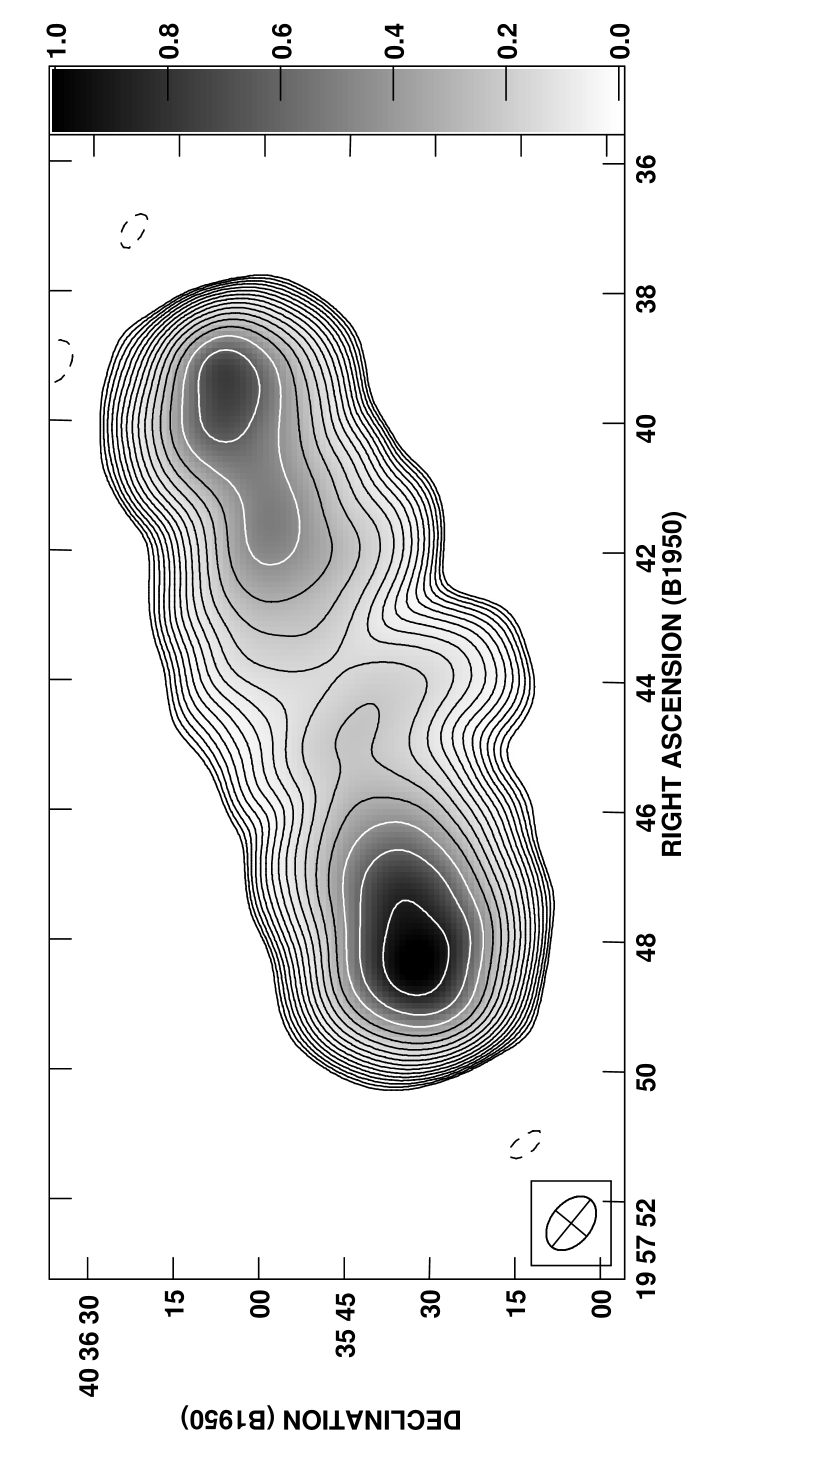
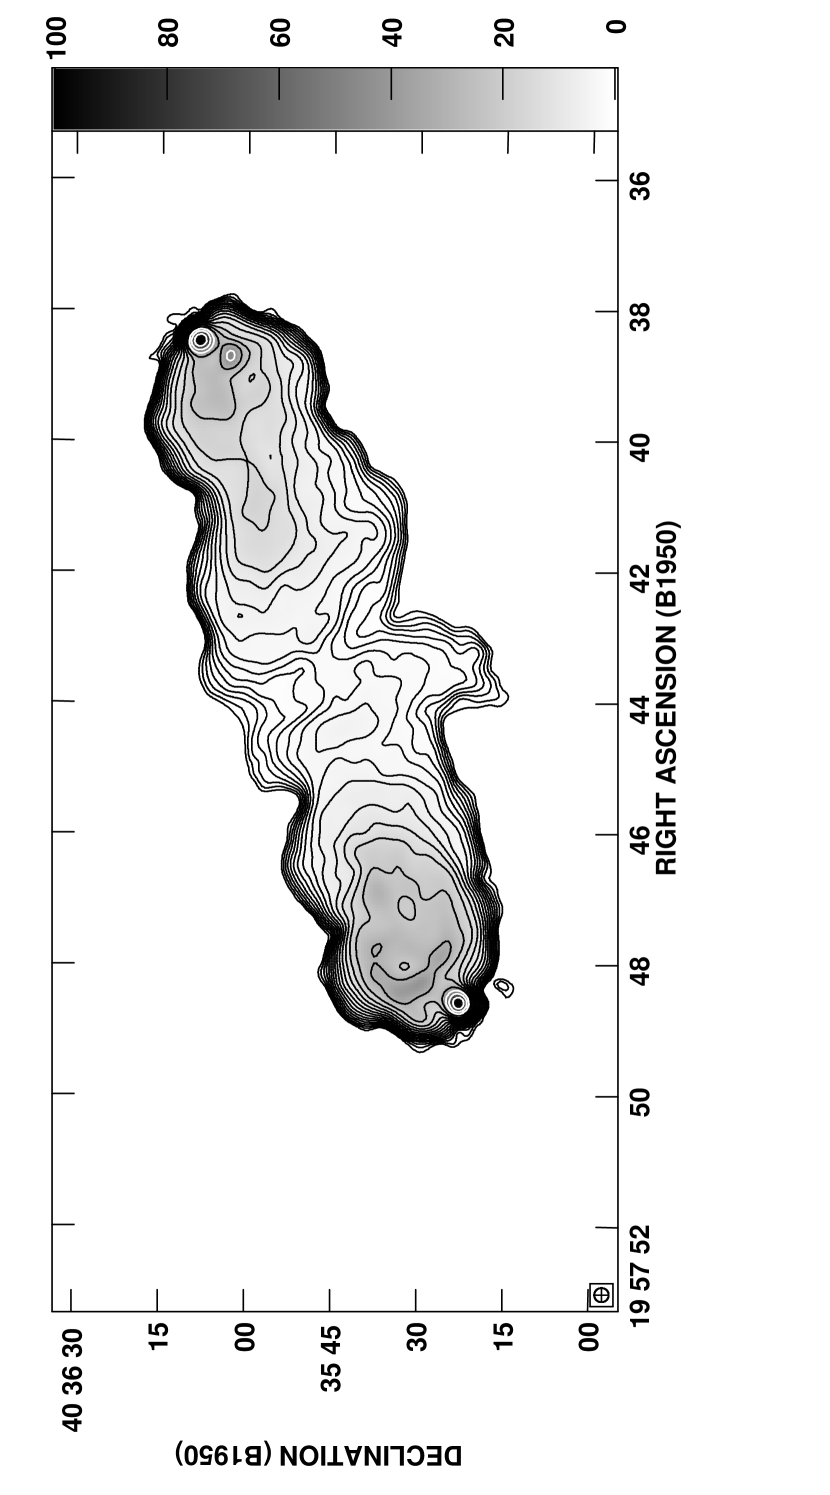
Figures 1 and 2 present our “PT link” images at 74 and 327 MHz. Because Cyg A is so strong, these images are dynamic range limited rather than thermal noise limited.
3 Analysis
We shall focus on the 74 MHz image for our analysis, as the flattening of the hot spot spectra should be more pronounced in it. Even with the higher angular resolution provided by the PT link, the resolution of the 74 MHz image is only 107 71 and is insufficient to separate the hot spot and lobe emission clearly. In order to estimate the relative contributions of the hot spots and lobes, we used a higher frequency image to estimate a lobe contribution and remove this from the 74 MHz image. This method is similar to that used by Carilli et al. (1991) to isolate the hot spot emission at frequencies above 22 GHz in their analysis.
We formed a “lobe-only” image of Cyg A at 151 MHz by modeling the hot spots as gaussian components and subtracting them from a MERLIN image with an angular resolution of 3″ (Leahy et al., 1989). The western hot spot could be represented adequately by two gaussian components and the eastern hot spot by a single gaussian component. We then convolved this lobe-only image to the same angular resolution as our 74 MHz image and, assuming a spectral index, scaled it to 74 MHz. Finally, we formed a residual image by subtracting the frequency-scaled, lobe-only 151 MHz image from our 74 MHz image. Carilli et al. (1991) found a spectral index of for the lobe spectra (). This spectral index appears to be too steep, at least for the lobe emission near the hot spots, as it produces systematically negative brightnesses for the lobe emission in the residual image. Requiring that the lobe emission in the residual image be approximately 0 Jy beam-1, we find a spectral index of is more appropriate, which we adopted. Overlaying the original 151 MHz image on this residual 74 MHz image, we then selected only those pixels at the locations of the hot spots from which to estimate the hot spot emission at 74 MHz.
Carilli et al. (1991) report the hot spot emission at higher frequencies as a brightness (units of Jy beam-1) for a circular 45 beam, as this resolution is sufficient to separate clearly the hot spot and lobe emissions. Because our 74 MHz beam is larger than 45, we have converted all brightnesses to units of Jy arcsec-2. In doing so, we must also account for the possibility of beam dilution of the hot spot emission. Both by convolving the 151 and 327 MHz images to the resolution of the 74 MHz image as well as by constructing a synthetic image containing a 45-diameter hot spot, we estimate that the peak brightnesses in our 74 MHz image are diluted by a factor of approximately 4.
Table 2 summarizes our estimates for the 74 MHz hot spot emission, both the nominal values estimated from the image as well as the dilution-corrected values. In making these estimates, we analyzed the two hot spots separately. We base the uncertainties on our analysis of the western hot spot. We have modeled it with two gaussian components, but a third component might also be used. We repeated the above analysis for the western hot spot using three gaussian components, and the difference between the analysis with two or three components represents our estimated uncertainty. For the eastern hot spot, we have adopted the same uncertainty.
| Hot Spot | corrected | |
|---|---|---|
| (Jy arcsec-2) | (Jy arcsec-2) | |
| East | 2.77 0.58 | 11.08 0.58 |
| West | 1.85 0.58 | 7.40 0.58 |
Note. — is the nominal value estimated from our 74 MHz image; the corrected value includes a factor of 4 increase to account for beam dilution effects.
Figure 3 shows the hot spot spectra below 2000 MHz. Also shown are a spectrum with an LEC, an SSA spectrum, and a free-free absorbed power-law spectrum. Because the resolution at 74 MHz does not yet approach that obtained at higher frequencies, we have not included the 74 MHz data in producing the theoretical curves. In producing the LEC and SSA spectra, we have repeated the analysis of Carilli et al. (1991), using formulae from Pacholczyk (1970), but restricted our attention to the data below 2000 MHz. The free-free absorbed power-law spectrum has been fit following the methodology of Kassim (1989). Table 3 summarizes the results of fitting the higher frequency data for these different processes.


| Process | Parameter | West hot spot | East hot spot |
|---|---|---|---|
| LEC | |||
| 110 20 MHz | 120 20 MHz | ||
| SSA | |||
| 116 MHz | 106 MHz | ||
| free-free | |||
| 1.1 0.02 | 0.95 0.02 |
4 Discussion and Conclusions
Immediately apparent is that the low-frequency spectra of both hot spots flatten or turn over and that there is an asymmetry between the two hot spots, with the eastern hot spot being approximately a factor of 2 brighter than the western hot spot (§1).
For the eastern hot spot, both the SSA and the free-free absorbed spectra considerably underpredict the 74 MHz (dilution-corrected) brightness, while an LEC spectrum agrees reasonably well. For an LEC spectrum, we find a cutoff frequency of 120 MHz (Table 2), corresponding to a minimum Lorentz factor of . This value is comparable to that found by Carilli et al. (1991), though slightly lower because we have restricted our attention to lower frequencies. The free-free absorbed spectrum can be made to agree with the 74 MHz datum by reducing the 74 MHz optical depth to . Clearly, however, an LEC spectrum can explain the 74 MHz datum without requiring any free-free absorption.
For the western hot spot, the SSA and free-free absorbed spectra agree reasonably well with the (dilution-corrected) 74 MHz datum, while the LEC spectrum overpredicts it by a considerable amount. On the basis of the current data, we do not believe that it is possible to distinguish between a free-free absorbed and SSA spectrum. As Carilli et al. (1991) noted, the SSA spectrum appears to require an implausibly large magnetic field. However, this assumes a homogeneous emitting region in the source. If the emitting region is inhomogeneous, lower magnetic field values might be tolerated at the expense of making the SSA turnover less sharp, and so agree somewhat less well with the 74 MHz brightness. Conversely, the inferred optical depth of unity (Table 3) requires an emission measure of pc cm-3, well in excess of the EM values observed (Carilli et al., 1989). Kassim et al. (1996) found, based on lower resolution observations, that an emission measure pc cm-3 may be required to explain the low-frequency spectrum of the western lobe, and there could be clumps with larger values of EM across the face of the lobe, though these would probably also mean that the reddening in this direction has been underestimated substantially. Finally, it may also be possible that a free-free absorbed LEC spectrum, as opposed to a free-free absorbed power-law as we have been considering previously, could explain the low-frequency data.
Distinguishing between the various possibilities for the western hot spot and confirming the apparent LEC in the spectrum of the eastern hot spot will require additional observations. More sensitive, high resolution H observations would constrain the amount of foreground H II while additional low radio frequency observations at higher angular resolution would discriminate clearly between the hot spot and lobe emissions. At a minimum, the objective should be to obtain angular resolutions comparable to the MERLIN image (), which will require baselines of roughly 200 km. Multi-frequency observations, with a denser sampling of frequencies, would be useful to constrain the effects of low energy cutoffs versus free-free absorption, as well as probe the possibility of more complex SSA models. Future telescopes, notably the Long Wavelength Array (LWA) and the Low Frequency Array (LOFAR), should provide much higher resolution and a more densely sampled range of frequencies with which to probe Cyg A and similar objects.
References
- Baars et al. (1977) Baars, J. W. M., Genzel, R., Pauliny-Toth, I. I. K., & Witzel, A. 1977, A&A, 61, 99
- Beresford (2000) Beresford, R. 2000, “VLA-Pie Town Link,” VLA Technical Memorandum 77, National Radio Astronomy Observatory
- Blandford & Rees (1974) Blandford, R. D. & Rees, M. J. 1974, MNRAS, 165, 395
- Carilli & Barthel (1996) Carilli, C. L., & Barthel, P. D. 1996, Astron. & Astrophys. Rev., 7, 1
- Carilli et al. (1991) Carilli, C. L., Perley, R. A., Dreher, J. W., & Leahy, J. P. 1991, ApJ, 383, 554
- Carilli et al. (1989) Carilli, C. L., Dreher, J. W., Conner, S., & Perley, R. A. 1989, AJ, 98, 513
- Carilli & Harris (1996) Carilli, C. L., & Harris, D. E. 1996, Cygnus A—Study of a Radio Galaxy (Cambridge, UK: Cambridge University Press)
- Kassim et al. (1996) Kassim, N., Perley, R. A., Carilli, C. L., Harris, D. E., Erickson, W. C. 1996, in Cygnus A – Study of a Radio Galaxy, eds. C. L. Carilli & D. E. Harris. (Cambridge University: Cambridge) p. 182
- Kassim (1989) Kassim, N. E. 1989, ApJS, 71, 799
- Leahy et al. (1989) Leahy, J. P., Muxlow, T. W., & Stephens, P. W. 1989, MNRAS, 239, 401
- Pacholczyk (1970) Pacholczyk, A. G. 1970, Radio Astrophysics (Freeman: San Francisco)
- Scheuer (1974) Scheuer, P. A. 1974, MNRAS, 166, 513
- Spinrad & Stauffer (1982) Spinrad, H. & Stauffer, J. R. 1982, MNRAS, 200, 153