4U 134460: a bright intermediate Seyfert galaxy
at = 0.012 with a relativistic Fe K
emission line††thanks: Based on observations obtained
with XMM-Newton, an ESA Science Mission with instruments and
contributions directly funded by ESA Member states and the USA
(NASA). Optical observations were carried out at the
European Southern Observatory, La Silla (Chile) under program No
70.D-0227
We present analysis of the optical and X-ray spectra of the low Galactic latitude bright ( = 3.6 10-11 erg cm-2 s-1) source 4U 134460. On the basis of the optical data we propose to classify 4U 134460 as an intermediate type Seyfert galaxy and we measure a value of = 0.0120.001 for its redshift. From the XMM–Newton observation we find that the overall X–ray spectral shape of 4U 134460 is complex and can be described by a power-law continuum ( 1.55) obscured by two neutral absorption components (N 1022 cm-2 and N 4 1022 cm-2), the latter covering only the 50% of the primary X-ray source. The X-ray data therefore lend support to our classification of 4U 134460. It exhibits a broad and skewed Fe K line at 6.4 keV, which suggests the existence of an accretion disk that is able to reprocess the primary continuum down to a few gravitational radii. Such a line represents one of the clearest examples of a relativistic line observed by XMM–Newton so far. Our analysis has also revealed the marginal presence of two narrow line-like emission features at 4.9 and 5.2 keV.
Key Words.:
galaxies: active – galaxies: individual: 4U 134460 – X-ray: galaxies1 Introduction
4U 134460 was discovered by the Uhuru (SAS A) X–ray Observatory when scanning of the Galactic plane (Forman et al. 1978). Wood et al. (1984) reported a flux of 2 10-11 erg cm-2 s-1 in the 2–10 keV band for this X–ray source in the Large Area Sky Survey performed with HEAO-1. The first position of 4U 134460 with good astrometric accuracy has been provided by Warwick et al. (1988) using EXOSAT data (R.A.(B1950) =13h 43m 59s.5, Dec.(B1950)=60∘ 23′ 39′′). Because 4U 134460 lies deeply in the Galactic plane (), it is not easily accessible at all wavelengths (in particular the optical to soft X–ray bands). For this reason, 4U 134460 has been optically identified only very recently by Masetti et al. (2006; see also Michel et al. 2004) as a Type 1 Seyfert galaxy at = 0.0130.001. Despite its X-ray brightness, no X–ray satellite directly pointed 4U 134460 with an adequate exposure time, so its X–ray spectral properties were almost unknown up to XMM–Newton.
This source is included in the first INTEGRAL AGN Catalog (flux of 10-11 erg cm-2 s-1 in the 20–100 keV band), which has been recently published by Beckmann et al. (2005). They performed a first-order spectral analysis fitting XMM–Newton, INTEGRAL ISGRI, and SPI data, which turned out a best–fit model consisting of an absorbed (NH = 2.640.07 1022 cm-2) power law with a photon index = 1.65 plus a Gaussian line at 6.13 keV.
In this paper we report the identification and the spectrum of the optical counterpart of this bright high–energy source (Sect. 2) and present the results of a detailed analysis of its XMM–Newton spectrum (Sects. 3 and 4). In Sect. 5 we discuss our findings providing clues to the nature and the origin of the different features observed in the X–ray spectrum and their connection with the optical classification of 4U 134460. Finally, in Sect. 6, we summarize the results of the X–ray and optical analysis and give our conclusions.
2 The optical properties of 4U 134460
The optical imaging and spectroscopic observations of 4U 134460 (P.I. C. Motch) were carried out on 01 Mar 2003 with the EFOSC 2 imaging spectrograph at the Cassegrain focus of the ESO 3.6m telescope at La Silla (Chile), in the framework of the Galactic plane part of the identification program of the XMM–Newton Survey Science Center (Motch et al. 2003; Watson et al. 2001). A thinned Loral/Lesser CCD detector, providing a 2060 2060 pixel image was used. Pixel size is 15 m, resulting into a plate scale of 0′′.158/pixel. A 2 2 binning was applied in both imaging and spectroscopical observations. These data are the same as those analyzed by Masetti et al. (2006).
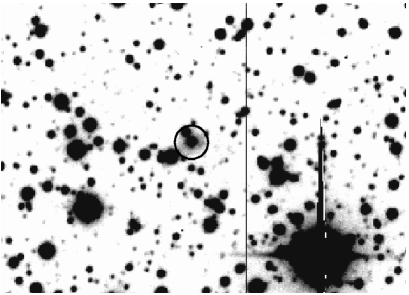
A 300 s image (Fig. 1) was obtained through the ESO Gunn i #705 filter. Images were corrected for bias and flat-field using sky exposures obtained at dawn and with standard MIDAS procedures. The seeing value derived from this image is FWHM 1′′. Absolute astrometry was performed using the USNO B1 catalogue. According to our field astrometry, the coordinates of the object proposed by Masetti et al. (2006) as the optical counterpart of the X–ray source are R.A.(J2000) = 13h 47m 36s.01 and Dec.(J2000) = 60∘ 37′ 03′′.75 (see Fig. 1 and comments therein), in excellent agreement with our estimate of the position of the XMM–Newton source (R.A.(J2000) = 13h 47m 36s.1 and Dec.(J2000) = 60∘ 37′ 03′′.3). These coordinates also match (to a few tenths of arcsec) those of the source #45 (IRSF J134736.0-604704) in the deep NIR survey carried out by Nagayama et al. (2004). The object was identified as a spiral galaxy. Furthermore, Schröder et al. (2006; see also Schröder et al. 2005) cross-identified their galaxy DZOA4653-11 with 4U 1344-60 and found it to be a member of a group or small cluster around the giant radio galaxy Centaurus B. They measured a -band magnitude of , which is after correction for Galactic extinction according to the maps by Schlegel et al. (1998).
A 1000 s spectrum was obtained using the ESO grism #06, providing a resolution of 12.9 Å (FWHM) and a dispersion of 4.12 Å per binned pixel. A 1′′.5-wide slit was used. All CCD spectroscopic frames were corrected for bias and flat-fielded using standard MIDAS procedures. The wavelength calibration was derived from the observation of He Argon arc lamps. One-dimensional spectra were extracted with a procedure optimizing the accumulation region in order to reach the best signal-to-noise and using sky background cleaned from cosmic-ray impacts. All spectra were corrected for atmospheric extinction and calibrated in flux using spectrophotometric standards.
The one-dimensional, wavelength, and flux-calibrated spectrum of the optical counterpart of the X-ray source is shown in Fig. 2. The Hα line complex is very intense. The spectrum is affected by a large Galactic extinction and the continuum disappears short-wards 5750 Å. Nevertheless, a trace of the strong [Oiii] 5007 Å feature was still detected. The spectrum was dereddened using the extinction curve from Cardelli et al. (1989), setting mag according to Schlegel et al. (1998). While the [Oiii] 5007 Å line became more evident, the resulting spectrum was extremely noisy below 5750 Å. Therefore we concentrated our analysis on the red portion of the spectrum.


The main spectral feature observed is the Hα+[Nii] 6548,6583 Å line complex. It is roughly symmetric, peaking at the H component. To compute the galaxy redshift, the line complex core was fitted by means of a single Gaussian profile. From the computed central wavelength, a value of z = 0.012 0.001 was derived. An attempt to deblend the four components of the complex (H, H, [Nii] 6548 Å, & [Nii] 6583 Å) was performed. To this end, the observer’s frame expected central wavelengths of the different lines have been computed based on our redshift estimate. Then, a simultaneous fit of four Gaussian profiles was performed. Even though it was not possible to perform a completely stable fit of the four components, the procedure allowed us to roughly estimate the flux of the two main components: I(H) = 9.3 1.5 10-13 erg cm-2 s-1 and I(H)= 3.3 0.8 10-12 erg cm-2 s-1. The flux in the [Sii] 6716,6731 Å doublet was also estimated as 3.0 10-13 erg cm-2 s-1. Therefore we obtained a ratio H/[Sii] 3, consistent with an AGN spectrum (Veilleux & Osterbrock 1987). The width of the broad component of Hα was 4400 km s-1 FWHM, a typical value for a Seyfert 1.x galaxy.
Moreover, even though the Hβ line was not detected in our spectrum, we could derive an estimate of the Seyfert type that was more accurate than the one provided by Masetti et al. (2006) using the approximate relation from Netzer (1990): Seyfert Type . Using this relation and the flux values given above, we propose to classify 4U 134460 as a Seyfert 1.5 galaxy. However, it should be taken into account that the large flux uncertainties could shift this tentative classification close to the Seyfert 1.8 class.
3 XMM-Newton observation and data reduction
On August 25, 2001 4U 134460 was serendipitously observed by XMM–Newton (Jansen et al. 2001 and references therein) for 37 ks (Obs. Id. 0092140101). This source lies at 14 arcmins from the radio-galaxy Centaurus B, which was the target of the observation.
XMM–Newton data were processed with SAS v6.5. The EPCHAIN and EMCHAIN tasks were used for processing the raw PN and MOS data files, respectively, and for generating the relative linearized event files. X–ray events corresponding to patterns 0–12(0–4) for the MOS(PN) cameras were selected. We employed the most updated calibration files at the time the reduction was performed (September 2005). 4U 134460 was found to be well within the PN field-of-view (FOV) while it was outside the MOS2 FOV and just on the edge of the MOS1 FOV. Given the current calibration uncertainties at such an extreme off-axis location, MOS1 data were ignored in our analysis. The PN event list was furthermore filtered to ignore periods of high background flaring according to the method presented in Piconcelli et al. (2004) based on the cumulative distribution function of background lightcurve count-rates. After this data cleaning, we obtained a net exposure time of 25.5 ks. The spectrum was binned to a minimum of 35 counts per bin to apply the minimization technique in the spectral fitting, which was performed in the 0.3–10 keV band using the XSPEC package (v.11.3).
The quoted errors on the model parameters correspond to a 90% confidence level for one interesting parameter ( = 2.71; Avni 1976). All luminosities are calculated assuming a CDM cosmology with (,) = (0.3,0.7) and a Hubble constant of 70 km s-1 Mpc-1 (Bennett et al. 2003).


4 XMM–Newton results
4.1 Temporal analysis
X–ray light curves were extracted from the PN dataset in the soft (0.2–2 keV) and hard (2–15 keV) bands. The time bin size was set to be 500 s for all light curves. Background light curves were extracted from source-free regions in the same energy bands and with the same bin sizes. In Fig. 3 the background–subtracted, sourcebackground and background light curves in the soft and hard band are plotted. Note that the datapoints belonging to the final interval of the observation (i.e. data taken at times 28 ks after the start of the observation) were excluded as they are completely dominated by a large flaring particle background.
A positive 30–35 per cent variation in count rate (CR) in both the soft and the hard bands occurred at 20 ks. The hardness ratio (CRCRHard) thereby remained steady, within the errors, during the whole portion of the observation selected for the spectral analysis.
4.2 Spectral analysis
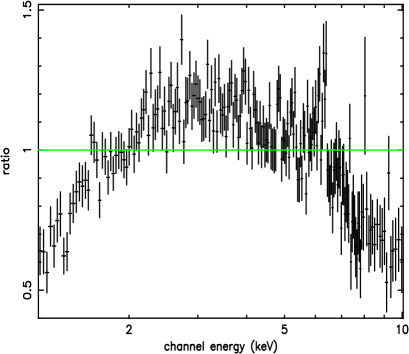
All the models presented in this section include a large absorption component due to the line–of–sight Galactic column of NH = 1.08 1022 cm-2 (Dickey & Lockman 1990). If not specified, values of the physical parameters are reported in the source frame. As shown in Fig. 4a, the X-ray spectrum of 4U 134460 is complex, and a simple fit with a power law ( 0.7) yielded a very poor fit with = 4.7. The most prominent features in the residuals are the low energy cut off and the positive excess at 6 keV. The latter is readily explained in terms of fluorescent emission from the iron K-shell as commonly observed in most Seyfert galaxies, while the negative residuals below 2 keV and the extremely flat slope are indicative of heavy absorption along our line of sight. Due to the spectral complexity of 4U 134460, we initially excluded the data from 5 to 7 keV to better determine the underlying continuum.
An absorbed power law yielded a marginally acceptable fit to the data with an associated dof =177147 (i.e. 1.2) and a still unusually flat 1.3, which suggests the presence of more complex absorption. We then applied a partial-covering model to the data, which usually provides a good fit in the case of absorbed intermediate-type Seyfert galaxies (e.g. Immler et al. 2003; Schurch & Warwick 2003; Pounds et al. 2004). This parameterization, consisting of two power laws with only the second one passing through the absorber and with the two photon indices assumed to be identical, produced a decrease of = 29 compared with the absorbed power-law model, i.e. a statistical improvement at 99.9% confidence level according to an –test. This fit resulted in a photon index of = 1.460.06 and a column density of the partial covering absorber of N = 2.00.3 1022 cm-2.
Furthermore, we found that the addition of a fully-covering intrinsic absorption component gave a further, highly significant (at 99.9% c. l.) improvement to the fit statistics, with dof = 138/145.
| Model | N (Fully-cov.) | N (Part.-cov.) | Rin/ | EW | dof | |||
|---|---|---|---|---|---|---|---|---|
| 1022 cm-2 | 1022 cm-2 | keV | /keV | eV | deg | |||
| Aa | 1.59 | 0.88 | 4.61 | 138/145 | ||||
| B | 1.57 | 0.69 | 3.94 | 6.18 | 0.27 | 393 | 175/179 | |
| C | 1.54 | 0.69 | 3.90 | 6.47 | 14 | 378 | 15 | 167/178 |
| D | 1.54 | 0.68 | 3.83 | 6.28 | 13 | 383 | 26 | 170/178 |
| E | 1.69 | 1.02 | 7.59 | 6.17 | 0.0f.b | 96 | 180/178 | |
| 6.42 | 0.0f.b | 155 |
Model A: absorbed partial-covering; Models B, C, and D include the same underlying continuum as Model A plus: a broad Gaussian line (B); a Schwarzschild diskline (C); a Kerr laor line (D) and two narrow Gaussian lines to account for the Fe K emission. See text for further details of each model. a Data from 5 to 7 keV were excluded. b Value of the line width fixed to 0 keV.
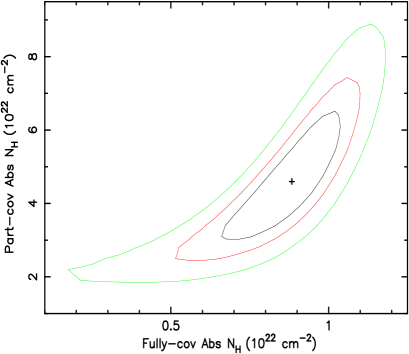
This model (e.g. model A in Table 1) yielded a photon index of = 1.59 and a column density of N = 0.88 1022 cm-2 and N = 4.61 1022 cm-2 for the absorber fully–covering and partially–covering (covering–fraction Cf = 4310%) the source, respectively. The two–dimensional contour plot in the parameter space N–N is shown in Fig. 4b. The null hypothesis probability associated to this fit, = 0.66, and the visual inspection of the data-to-model ratios suggested that it provides an appropriate description of the broad-band X-ray spectral shape of 4U 134460.
Moreover, we also fitted the X–ray continuum of 4U 134460 using an alternative model consisting of an absorbed power law including a reflection component (pexrav model in XSPEC), which is expected due to the presence of a strong Fe K line. However, we yielded a significantly (99.9%) worse fit than model A with a final = 1.21 for 146 d.o.f. The photon index was flat ( 1.3) and we measured only an upper limit for the strength of the reflection ( 0.5).
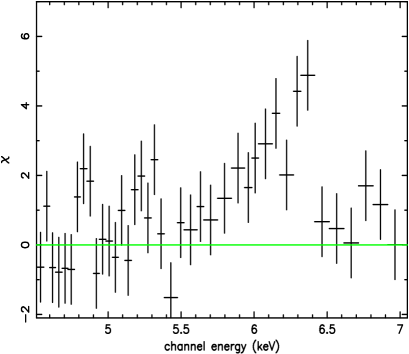
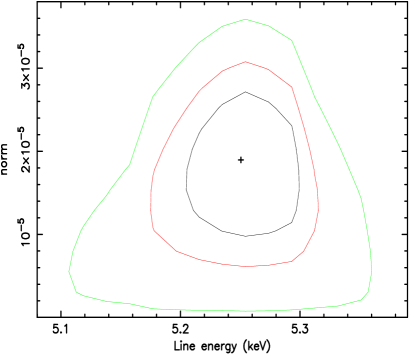
Figure 5 shows the residuals obtained by extrapolating the model A fit above the energy band between 5 and 7 keV, which was previously ignored. A large excess is evident from 5.5 to 6.5 keV, indicating that the line profile is broad and asymmetrical with the peak of the emission located around 6.4 keV. Furthermore, this figure suggests the presence of two emission line-like features at 4.8 and 5.2 keV.
We started to fit the complex Fe K emission with a Gaussian line. This fit (labelled as model B in Table 1) had an associated dof =175(179) and yielded an improvement at 99.99% confidence level according to an F-test once compared with a fit similar to model A but with the whole 0.3–12 keV band taken into account. The line was at 6.180.07 keV and turned out to be both strong (equivalent width EW = 393 eV) and spectrally resolved with a = 0.270.09 keV. If due to Doppler shift, the corresponding velocity width would be 3000010000 km s-1, a value that is typical of the innermost regions of the accretion disk around a supermassive black hole (BH) and only three times lower than the extreme ( 105 km s-1) relativistic Fe K line observed in MGC-6–30-15 (Tanaka et al. 1995). Interestingly, a similar value of the velocity FWHM, i.e. 30000 km s-1, has also been found for most of the broad iron lines detected by XMM–Newton so far (e.g. Porquet & Reeves 2003; Balestra et al. 2004; Porquet 2006).
We therefore fitted the skewed Fe K emission line in 4U 134460 with the broad profile expected from a relativistic accretion disk around: () a non-rotating (Schwarzschild) BH (model diskline in XSPEC; Fabian et al. 1989), () a spinning (Kerr) BH (model laor in XSPEC; Laor 1991). An emissivity law with fixed to the customary value of 2.5 was assumed (Nandra et al. 1997). These spectral fits are indicated in Table 1 as models C and D. We also applied an alternative model consisting of two narrow Gaussian lines (model E).
Both fits with a relativistic line profile provided an excellent description of the Fe line observed in 4U 134460 with an associated = 0.94 (model C) and = 0.95 (model D) for 178 degrees of freedom. The best-fit values of the spectral parameters of the line are reported in Table 1. In both cases we found a disk inclination 45 degrees and a disk inner radius larger than the marginally stable orbit in a Schwarzschild/Kerr metric.
It is worth noting that assuming a different underlying continuum model (i.e. pexrav as in Sect. 4) did not modify the diskline parameters. In fact, we found similar values ( = 6.380.06 keV, 14 Rg) to those found with model C, with the obvious exception of the EW, which decreased to 150 eV.
Finally, we did not find any statistical requirement for a narrow Fe K line at 6.4 keV when a relativistic line model was applied. A narrow Fe line is expected to emerge from the absorbing material. When NH is a few 1022 cm-2, as observed in 4U 134460, the predicted EW of this emission line is about 40 eV (Makishima 1986), which is consistent with the upper limit of EW 39 eV we inferred from the spectrum.
The application of model E (e.g. Table 1 for details) to the data also produced a statistically good fit. The energies(EWs) of the two narrow lines were 6.17(EW = 96) and 6.42(EW = 15540 eV) keV. However, the final = 13 with respect to model C and the presence of an excess in the data–to–model residuals redward of the 6.1 keV line led us to reject this model on statistical grounds.
Models from B to E yielded a value of the covering factor
of the partially–covering absorber Cf = 5015%.
Once Model C was assumed, we measured a flux = 3.6
10-11 erg cm-2 s-1 in the hard (2–10 keV) energy band that corresponds,
after the correction for both Galactic and intrinsic absorption
components, to a luminosity = 1.48
1043 erg s-1.
Some positive excesses were present in the data–to–model ratio residuals: apart the two features around 5 keV shown in Fig. 5a, a third one was found at 1.6 keV. All previous models therefore also included three Gaussian lines to reproduce these spectral features. Each line represents an improvement in the resulting fit statistics significant at 95.5% confidence level. Table 2 lists the line’s best-fit parameters, while Fig. 5b shows the two-dimensional iso- contour plot in the parameter space –Photon flux for the line detected (98.5% c.l.) at 5.310.05 keV.
The line at 1.6 keV is puzzling since no obvious strong emission line is expected to emerge at these energies. We therefore checked the possibility that such a feature could be an artifact owing to calibration uncertainties in the PN instrumental response function at the extreme off-axis position of 4U 134460. The energy range between 1 and 2 keV is rich in emission lines and edges due to the detector materials. In particular, the effective area of the XMM–Newton mirror shows a pronounced edge near 2 keV (the Au M edge), and the PN quantum efficiency shows a prominent feature at 1.8 keV caused by the Si K edge (Strüder et al. 2001). In the background spectrum, two strong emission lines are present at 1.5 keV (Al K line in the detector background) and 1.75 keV (Si K). It is thus likely that the feature observed at 1.6 keV may be due to uncertainties in the response matrix and background subtraction at the source’s off-axis location and, therefore, will be ignored in the following discussion. On the other hand, the lines detected around 5 keV are not affected by this problem since in this energy band the response of the detector is flat, and no strong spectral features are reported in the background spectrum.
| Energy | EW | (F–test) |
|---|---|---|
| keV | eV | % |
| 1.630.02 | 19 | 98.5 |
| 4.900.04 | 45 | 95.5 |
| 5.310.05 | 57 | 98.5 |
5 Discussion
5.1 Optical classification and X-ray absorption
According to our analysis in Sect. 2, 4U 134460 is a Seyfert 1.5 at = 0.0120.001. However, given the large uncertainties in the estimates of the H and H fluxes, a Seyfert 1.8 classification could also be possible. We therefore only partially confirmed the results of Masetti et al. (2006), as they report a Seyfert 1 optical classification. From the XMM–Newton observation we found that the overall X–ray spectral shape of 4U 134460 is complex and can be described by a power-law continuum modified by two neutral absorption components, one of which covers only 50% of the primary X-ray source. The X-ray data seem to support our conclusion about the optical classification of 4U 134460, as many other intermediate type Seyfert galaxies have been found to show complex absorption in the X-ray band, e.g. Mkn 6 (Feldmeier et al. 1999), NGC 4151 (Schurch & Warwick 2003), Mkn 1152 (Quadrelli et al. 2003) and NGC 3227 (Gondoin et al. 2003). In contrast, pure Type 1 objects have X-ray spectra that are almost unobscured by cold absorption material (e.g. Nandra & Pounds 1994; Schartel et al. 1997; Reynolds 1997, Piconcelli et al. 2005).
According to the current Unified models for AGNs, Seyfert 1.5 are seen at an intermediate inclination angle, and so it is possible that, in the case of 4U 134460, our line-of-sight can intercept the outer (Compton-thin) layers of the torus and/or clouds in the so-called “torus atmosphere” (Feldmeier et al. 1999, Lamer et al. 2003). This provides a likely explanation for the presence of the complex obscuration observed in this source. A deeper observation could be useful to put useful constraints on ionization state and temporal behavior of the absorbers.
Given the high column densities (N = 0.69 1022 cm-2 and N = 3.90 1022 cm-2), the absorption dominates the spectrum up to 3–4 keV. Above these energies the primary X-ray power-law continuum starts to emerge with a = 1.54. Beckmann et al. (2005) have recently reported its significant detection up to 100 keV using INTEGRAL ISGRI spectroscopic data, measuring a slope of 1.65, which is consistent with our result. Such a value of the photon index is slightly lower than the average value 1.9 reported for large samples of AGNs. However, our measurement is not surprising since a flat ( 1.5-1.6) continuum has been also observed occasionally in other Seyfert 1.5 galaxies (e.g. Turner et al. 1999; Gondoin et al. 2003; Schurch & Warwick 2003).
5.2 Properties of the Fe K emission
The present XMM–Newton observation has revealed that the Fe K fluorescence emission in 4U 134460 is broad. A model with a relativistic (i.e. Kerr or Scharwzschild) profile (models C and D, respectively) successfully reproduce the data.
The discovery of such a spectral feature is very interesting since it may be interpreted as the result of the emission from dense matter in the innermost region of the accretion disk where effects such as Doppler and gravitational broadening operate and give rise to the typical asymmetric double-horned/skewed profile (Fabian et al. 2000; Martocchia, Karas & Matt 2000). This should make possible to trace the matter distribution down to the last stable orbit.
Previous works based on ASCA data (e.g. Nandra et al. 1997, but see also Lubinski & Zdziarski 2001) report the common occurrence of Fe K lines with a broad profile in the X–ray spectrum of most bright Seyfert galaxies, while in the AGNs targeted by XMM–Newton and Chandra the iron line has been observed as a ubiquitous narrow feature at 6.4 keV (Reeves 2003; Yaqoob & Padmanabhan 2004; Bianchi et al. 2004; Jiménez-Bailon et al. 2005). Only a small number of objects show an emission line with a broadened, asymmetric profile (Fabian & Miniutti 2005 for a review) often superimposed on the narrow component (Reeves et al. 2001; Balestra et al. 2004). The line detected in 4U 134460 is one of the clearest examples of relativistic lines found so far. It is worth noting that the feature shows a broad profile independently from model fits applied to the underlying continuum.
The values of the line parameters derived from the spectral analysis of the XMM–Newton observation suggest that in the case of 4U 134460 the fluorescence takes place at few gravitational radii from the BH with the inner radius of the iron emitting region located at 10 Rg. Such a value of does not allow us to estimate the spin value of the BH. The radius of the marginally stable orbit of a non-rotating (i.e. = 0) BH is 6 Rg, while in the case of a Kerr spinning ( 0) BH it decrease down to 1.23 Rg: the line in 4U 134460 is therefore not as extremely broad and redshifted as those found in MCG–6-30-15 (Wilms et al. 2001) and NGC 3516 (Turner et al. 2002), which imply a Fe line-emitting disk extending down to the last stable orbit of the BH.
There are three straightforward explanations for the non-occurrence of Fe K fluorescence in the very immediate vicinity of the BH: () the disk does not extend below 10 Rg, () the accretion flow very close to the event horizon is highly ionized and, therefore, the Fe is completely stripped; and/or () there are no X-ray emitting active regions at 10 Rg to properly illuminate the disk surface.
However, it is worth noting that the spectral complexity, along with the limited energy band, prevented us from a fully and reliably understanding the underlying continuum. While the existence of a relativistically broadened profile is robust enough, the precise determination of the emitting disk parameters must wait for future, broader band observations.
5.3 The emission features around 5 keV
XMM–Newton spectra of a handful of bright Seyfert galaxies have revealed the presence of narrow emission lines in the energy band 5–7 keV (e.g. Turner et al. 2002; Guainazzi 2003; Porquet et al. 2004; Turner et al. 2004; Della Ceca et al 2005). We found two examples of these features in the XMM–Newton spectrum of 4U 134460 at 4.900.04 (at 95.5% c.l.) and 5.310.05 keV (at 98.5% c.l.).
Some scenarios have been proposed recently to explain such lines in terms of iron emission invoking a complex geometry of the Fe K–emitting region. If the X-ray corona is concentrated in a number of small active regions (the so-called flares) that illuminate the underlying disk (Haardt et al. 1994; Merloni & Fabian 2001, Czerny et al. 2004), Fe fluorescent emission lines can emerge from the localized “hotspots” occurring on the accretion disk surface. Dovčiak et al. (2004) present the detailed Fe K line profiles as a function of the orbital phase of the hotspot and its radial distance from the BH. The centroid of emission line is then redshifted due to the joint action of the Doppler and gravitational energy shift. The few highly-redshifted emission features observed around 5–6 keV so far were found to be narrow. This leads to the belief that the emitting region is small (i.e. a spot of a few s) and that the irradiation lasts only for a portion of the complete orbit.
The detection of these lines (even if the significance of the line at 4.9 keV is quite marginal) would imply Fe K emission close to the marginally stable orbit consistent with an 10 Rg derived for the broad line. This suggests the presence of different active regions, i.e. an extended, long-lived corona uniformly illuminating the disk at 10 Rg, to give rise to the broad Fe feature, plus some flares that generate hotspots in the innermost part of the accretion disk, giving rise to the narrow-line features around 5 keV.
Turner et al. (2002; 2004) propose an alternative scenario for the origin of these lines based on a (mildly-) relativistic outflow. In particular, they invoke the presence of a blob of Fe–emitting material ejected from the nucleus to account for the significant shift in the energy of the line observed over a few of tens kiloseconds and the “transient” behavior of the spectral line. Assuming an origin in neutral iron, the line detected at 5.2(4.8) keV in 4U 134460 implies a velocity of 60,000 ( 90,000) km/s of the emitting material.
6 Summary
We have studied the optical and X–ray spectra of 4U 134460, and our main results can be summarized as follows:
-
•
4U 134460 is a very bright X–ray source with a = 3.6 10-11 erg cm-2 s-1. On the basis of the optical data we measured a redshift of = 0.0120.001, which implies a 1.5 1043 erg s-1, and we proposed to classify 4U 134460 as an intermediate type Seyfert galaxy. In particular, since the Hβ line was not detected, we suggested a Seyfert 1.5 classification using the ratio (H)/(H). However, future, better-quality optical observations would allow us to obtain a more accurate constraint on the Seyfert type.
-
•
Once corrected for the large Galactic extinction (N 1022 cm-2), 4U 134460 still showed a heavily absorbed spectrum. The XMM–Newton data were best fitted by a power-law continuum with a slope of 1.55 modified by two neutral absorption components (N 1022 cm-2 and N 4 1022 cm-2), the latter covering only the 50% of the primary X–ray source. X-ray data support the classification of 4U 134460 as an intermediate type Seyfert galaxy.
-
•
4U 134460 exhibits a broad and skewed Fe K line. This finding allows the small sample of broad Fe K lines observed with XMM–Newton so far to be increased. This spectral feature is a signature for the presence of an accretion disk that is able to reprocess the primary continuum at a few gravitational radii ( 10) from the marginally stable orbit around the black hole. The line does not show any extreme relativistically-broadened profile, so it can be fitted by a Schwarzschild black hole model. No conclusion can be drawn about the spin properties of the BH, if any. The energy of the line is consistent with nearly neutral iron. We found that an additional, narrow contribution to the Fe K emission (e.g. from a distant reflector) is not required by the data. Given the brightness of 4U 134460, future high signal-to-noise observations carried out by XMM–Newton or Suzaku could be helpful for determining the line parameters on firmer statistical grounds.
-
•
Our analysis has revealed the presence of two narrow line-like features at 4.9 and 5.3 keV, significant at the 95.5% and 98.5% confidence levels, respectively. Recently, similar features were also observed in the X-ray spectra of a handful of bright Seyfert galaxies. Their nature remains, however, puzzling. A possible explanation has been proposed by Dovčiak et al. (2004) in terms of highly-redshifted iron line produced in a localized hot spot on the surface of the accretion disk very close to the marginally stable orbit of the BH. The simultaneous presence of a broad line in the spectrum of 4U 134460 reinforces this hypothesis thanks to the direct evidence of an Fe-emitting, relativistic accretion disk in this source. Long uninterrupted XMM–Newton observations could lead to useful insights into the nature of these emission features: in particular, the detection of variability in the shape and energy centroid of a line is crucial to accurately determining where it originates and how it evolves (e.g. Iwasawa, Miniutti & Fabian 2004).
Acknowledgements.
The authors wish to thank the referee for a prompt report that led to an improved paper. We are grateful to the staff members of the XMM–Newton Science Operations Center for their help. We also thank Martin Stuhlinger (ESAC) for helpful discussions related with the EPIC calibrations status. EP acknowledges the financial support of INSA (Spain).References
- (1) Avni, Y., 1976, ApJ, 210, 642
- (2) Balestra, I., Bianchi, S., & Matt, G., 2004, A&A, 415, 437
- (3) Beckmann, V., Gehrels, N., Shrader, C. R., & Soldi, S., 2005, ApJ, in press, (astro-ph/0510530)
- (4) Bennett, C.L., Halpern, M., Hinshaw, G., et al., 2003, ApJS, 148, 1
- (5) Bianchi, S, Matt, G., Balestra, I., et al., 2004, A&A, 422, 65
- (6) Cardelli, J. A., Clayton, G. C., Mathis, J., et al., 1989, ApJ, 345, 245
- (7) Czerny, B., Rózańska, A., Dovčiak, M., et al. , 2004, A&A, 420, 1
- (8) Della Ceca, R., Ballo, L., Braito, V., & Maccacaro, T., 2005, ApJ, 627, 706
- (9) Dickey, J. M., & Lockman, F. J., 1990, ARA&A, 28, 215
- (10) Dovčiak, M., Bianchi, S., Guainazzi, M., et al., 2004, MNRAS, 350, 745
- (11) Fabian A. C., Rees M. J., Stella L., & White N. E., 1989, MNRAS, 238, 729
- (12) Fabian A. C., Iwasawa K., Reynolds C. S., & Young A. J., 2000, PASP, 112, 1145
- (13) Fabian A. C., & Miniutti, G., 2005, “The X-ray spectra of accreting Kerr black holes” in “Kerr Spacetime: Rotating Black Holes in General Relativity” eds. D.L. Wiltshire, M. Visser and S.M. Scott, (Cambridge Univ. Press), (astro-ph/0507409)
- (14) Feldmeier, J. J., Brandt, W. N., Elvis, M., 1999, ApJ, 510, 167
- (15) Forman, W., Jones, C., Cominsky, L., et al. 1978, ApJS, 38, 357
- (16) Gondoin, P., Orr, A., Lumb, D., & Siddiqui, H., 2003, A&A, 397, 883
- (17) Jansen, F., Lumb, D., Altieri, B., et al., 2001, A&A, 365, L1
- (18) Guainazzi, M., 2003, A&A, 401, 903
- (19) Haardt, F., Maraschi, L., & Ghisellini, G., 1994, ApJL, 432, 95
- (20) Immler, S., Brandt, W. N., Vignali, C., et al., 2003, AJ, 126, 153
- (21) Iwasawa, K., Miniutti, G., & Fabian, A. C., 2004, MNRAS, 355, 1073
- (22) Jansen, F., Lumb, D., Altieri, B., et al., 2001, A&A, 365, L1
- (23) Jiménez-Bailon, E., Piconcelli, E., Guainazzi, M., et al., 2005, A&A, 435, 449
- (24) Lamer, G., Uttley, P., & McHardy, I. M., 2003, MNRAS 342, L41
- (25) Laor, A, 1991, ApJ, 376, 90
- (26) Leahy, D. A., & Creighton, J., 1993, MNRAS, 263, 314
- (27) Lubinski, P., & Zdziarski, A., 2001, MNRAS, 323, L37
- (28) Makishima, K., 1986, Lecture Notes in Physics, 266, 249
- (29) Martocchia, A., Karas, V., & Matt G., 2000, MNRAS, 312, 817
- (30) Masetti, N., Pretorius, M. L., Palazzi, E., et al., 2006, A&A in press, (astro-ph/0512399)
- (31) Merloni, A., & Fabian, A. C., 2001, MNRAS, 328, 958
- (32) Michel, L., Herent,O., Motch, C., et al., 2004, “Astronomical Data Analysis Software and Systems (ADASS) XIII”, ASP Conf. Ser. 314, 570
- (33) Motch, C., Herent, O., & Guillout, P., 2003, Astronomische Nachrichten, 324, 61
- (34) Nagayama, T., Woudt, P. A., Nagashima, C., et al., 2004, MNRAS, 345, 980
- (35) Nandra, K., & Pounds, K. A., 1994, MNRAS, 268, 405
- (36) Nandra, K., George, I. M., Mushotzky, R. F., et al., 1997, ApJ, 477, 602
- (37) Netzer, H., 1990, in Active Galactic Nuclei, Saas-Fee Advanced Course 20 (Springer), 57
- (38) Piconcelli, E., Jimenez-Bailon, E., Guainazzi, M., et al., 2004, MNRAS, 351, 161
- (39) Piconcelli, E., Jimenez-Bailon, E., Guainazzi, M., et al., 2005, A&A, 432, 15
- (40) Porquet, D., 2006, A&A in press, (astro-ph/0511387)
- (41) Porquet, D., Reeves, J. N., Uttley, P., Turner, T. J., 2004, A&A, 427, 101
- (42) Porquet, D.,& Reeves, J. N., 2003, A&A, 408, 119
- (43) Pounds, K. A., Reeves, J. N., King, A. R., & Page, K. L., 2004, MNRAS, 350, 10
- (44) Quadrelli, A., Malizia, A., Bassani, L., & Malaguti, G., 2003, A&A, 411, 77
- (45) Reeves, J.N., 2003, ASP Conference Series, 290, 35, (astro-ph/0211381)
- (46) Reeves, J.N., Turner, M.J.L., Pounds, K.A., et al., 2001, A&A, 365, L134
- (47) Reynolds, C. S., 1997, MNRAS, 286, 349
- (48) Schartel, N., Schmidt, M., Fink, H. H., et al., 1997, A&A, 320, 696
- (49) Schlegel, D.J., Finkbeiner D.P., & Davis M. 1998, ApJ 500, 525
- (50) Schröder, A. C., Mamon, G., Kraan-Korteweg, R.C., Woudt, P.A., 2005, “Nearby Large-Scale Structures & the Zone of Avoidance”’, eds. A.P. Fairall, P.A. Woudt, ASP Conf. Ser. 329, 167
- (51) Schröder, A. C., Mamon, G., Kraan-Korteweg, R.C., & Woudt, P.A., 2006, to be submitted to A&A
- (52) Schurch, N. J., & Warwick, R. S., 2002, MNRAS, 334, 811
- (53) Strüder, L., Briel, U., Dennerl, K., et al., 2001, A&A, 365, L18
- (54) Tanaka, Y., Nandra, K., Fabian, A. C., et al., 1995, Nature 375, 659
- (55) Turner, T. J., George, I. M., Grupe, D., et al., 1999, ApJ, 510, 178
- (56) Turner, T. J., Mushotzky, R. F., Yaqoob, T., et al., 2002, ApJL, 574, 123
- (57) Turner, T. J., Miller, L., George, I. M., Reeves, J. N., 2006, A&A, 445, 59
- (58) Veilleux, S. & Osterbrock, D. E., 1987, ApJS, 63, 295
- (59) Warwick, R. S., Norton, A. J., Turner, M. J. L., et al., 1988, MNRAS, 232, 551
- (60) Watson, M. G.; Auguéres, J.-L., Ballet, J., et al., 2001, A&A, 365, L51
- (61) Wilms, J. B., Reynolds, C. S., Begelman, M. C., et al., 2001, MNRAS, 328, 27
- (62) Wood, K. S., Meekins, J. F., Yentis, D. J., et al., 1984, ApJS, 56, 507
- (63) Yaqoob, T., & Padmanabhan, U., 2004, ApJ, 604, 63