Radio-loud Narrow-Line Type 1 Quasars
Abstract
We present the first systematic study of (non-radio-selected) radio-loud narrow-line Seyfert 1 (NLS1) galaxies. Cross-correlation of the ‘Catalogue of Quasars and Active Nuclei’ with several radio and optical catalogues led to the identification of 11 radio-loud NLS1 candidates including 4 previously known ones. This study almost triples the number of known radio-loud NLS1 galaxies if all candidates are confirmed. Most of the radio-loud NLS1s are compact, steep spectrum sources accreting close to, or above, the Eddington limit. The radio-loud NLS1s of our sample are remarkable in that they occupy a previously rarely populated regime in NLS1 multi-wavelength parameter space. While their [OIII]/H and FeII/H intensity ratios almost cover the whole range observed in NLS1 galaxies, their radio properties extend the range of radio-loud objects to those with small widths of the broad Balmer lines. Their black hole masses are generally at the upper observed end among NLS1 galaxies, but are still unusually small in view of the radio loudness of the sources. Among the radio-detected NLS1 galaxies, the radio index distributes quite smoothly up to the critical value of and covers about 4 orders of magnitude in total. Statistics show that 7% of the NLS1 galaxies are formally radio-loud while only 2.5% exceed a radio index . Implications for NLS1 models are discussed. Several mechanisms are considered as explanations for the radio loudness of the NLS1 galaxies and for the lower frequency of radio-louds among NLS1s than quasars. While properties of most sources (with 2-3 exceptions) generally do not favor relativistic beaming, the combination of accretion mode and spin may explain the observations.
1 Introduction
The radio-loud radio-quiet bimodality of quasars is one of the long-standing unsolved problems in the research of Active Galactic Nuclei (AGN). While the presence of two classes of quasars, radio-louds and radio-quiets with a deficiency of sources at intermediate radio powers, was historically apparently well established (e.g., Kellerman et al. 1989, Miller et al. 1990, Visnovsky et al. 1992), other studies have questioned the mere existence of a radio dichotomy (e.g., White et al. 2000, Cirasuolo et al. 2003), or have pointed out that larger samples are needed to put the bimodality on a firmer statistical basis (Hooper et al. 1995). On the other hand it was argued that carefully selected small, well-studied samples still reveal the bimodality (e.g., Sulentic et al. 2003), and that it is still present in a large sample of SDSS-FIRST galaxies (Iveciz et al. 2002). Approximately 15% of the quasar population is radio loud (Urry & Padovani 1995) for reasons that are still unknown.
A second question that is presently under close scrutiny is whether or not there are relations between black hole (BH) mass and radio loudness, and especially, whether or not there is a limiting BH mass above which objects are preferentially radio loud, and whether or not radio-louds and radio-quiets show the same spread in their black hole masses (e.g., Laor 2000, Lacy et al. 2001, Oshlack et al. 2002, Woo and Urry 2002, Shields et al. 2003, McLure & Jarvis 2004, Metcalf & Magliocchetti 2006, Liu et al. 2006).
While most attention so far concentrated on the radio-loud radio-quiet distinction of quasars, extending the studies to other subtypes of AGN may shed new light on both, the existence of a radio-loud radio-quiet bimodality and on the cause of radio loudness. We have started an investigation of the radio properties of Narrow-line Seyfert 1 galaxies. Apart from the topic just mentioned, the analysis of their radio properties is also of interest for addressing open questions in the study of NLS1s, as detailed below.
NLS1 galaxies were identified by Osterbrock & Pogge (1985) as objects with small widths of the broad Balmer lines. These go hand in hand with weak [OIII]5007/H emission and strong emission from FeII complexes (e.g., Boroson & Green 1992). Physical drivers of the NLS1 phenomenon and correlations among emission-line and continuum properties are not yet well understood. There is growing evidence, though, that most NLS1s are objects with high accretion rates, close to or even super-Eddington, and low black hole masses (e.g., Boroson & Green 1992, Pounds et al. 1995, Wang et al. 1996, Boller et al. 1996, Laor et al. 1997, Czerny et al. 1997, Marziani et al. 2001, Boroson 2002, Simkin & Roychowdhury 2003, Xu et al. 2003, Kawaguchi 2003, Wang & Netzer 2003, Grupe 2004, Grupe & Mathur 2004, Botte et al. 2004, Collin & Kawaguchi 2004). Apart from that, several other parameters were suggested to influence the main properties of NLS1 galaxies, including orientation (e.g., Osterbrock & Pogge 1985, Bian & Zhao 2004), winds and density effects (e.g., Lawrence et al. 1997, Wills et al. 2000, Bachev et al. 2004, Xu et al. 2003, 2006), metallicity (e.g. Mathur 2000, Komossa & Mathur 2001, Shemmer & Netzer 2002, Nagao et al. 2002, Warner et al. 2004, Fields et al. 2005), and absorption (e.g., Komossa & Meerschweinchen 2000, Gierlinski & Done 2004). There is evidence that NLS1s follow a different black hole mass – velocity dispersion () relation than broad line Seyfert 1 galaxies (e.g., Mathur 2001, Grupe & Mathur 2004, Mathur & Grupe 2005) with important implications for galaxy evolution and black hole growth.
While the X-ray and optical properties of NLS1s were explored intensively in the last decade, relatively little is known about their radio properties. Ulvestad et al. (1995) observed 7 NLS1 galaxies with the VLA and concluded that they are only of modest radio power and that radio emission is more compact than a few hundred parsec. Moran (2000) studied 24 NLS1s with the VLA and found that most of the sources are unresolved and show relatively steep spectra. Stepanian et al. (2003) found 9 radio(FIRST)-detected NLS1s among 26 NLS1s of the Second Byurakan Survey, all of them radio-quiet. Greene et al. (2006) performed radio observations of 19 galaxies with low BH masses, several of them with optical spectra similar to NLS1s. They only detected one source.
So far, only a few radio-loud NLS1s have been identified111there are preliminary reports that optical identifications of FIRST radio sources produce a higher rate of radio-loud NLS1s than optical selection (Whalen et al. 2001; see our Section 5.8 for a comparison with Whalen et al. 2006). PKS0558-504 (Remillard et al. 1986, Siebert et al. 1999), RXJ0134-4258 (Grupe et al. 2000), SDSSJ094857.3+002225 (Zhou et al. 2003) and SDSSJ172206.03+565451.6 (Komossa et al. 2006) all exceed radio indices =10 and show optical NLS1 spectra. RGB J0044+193 (Siebert et al. 1999) is radio-quiet most of the time (Maccarone et al. 2005), but may have been radio-loud at the epoch of the 87GB survey (Siebert et al. 1999, Maccarone et al. 2005) due to variability in the radio band. PKS 2004-447 (Oshlack et al. 2001) is a (non-typical) NLS1 or possibly a narrow-line radio galaxy (Zhou et al. 2003) and is very radio-loud.
It is still a puzzle why radio-loud NLS1 galaxies are scarce. In particular, it is still unclear whether they are truly preferentially radio quiet, or rather the scarcity of radio-louds is due to some selection effect. This question can be addressed by a systematic search for, and study of, radio-loud NLS1s.
The study of radio properties of NLS1s, in particular their radio loudness and radio variability, also allows us to re-address the question whether NLS1 galaxies are preferentially viewed face on. Furthermore, radio observations of NLS1 galaxies provide constraints on the coupling between jets and accretion disks (e.g., Zdziarski et al. 2003). There are indications that objects with accretion rates close to the Eddington rate tend to be radio-weaker; a behavior observed in Galactic X-ray binaries in soft/high-state and AGN (Maccarone et al. 2003, Greene et al. 2006, and references therein).
Here, we report results from a search for radio-loud and ‘almost radio-loud’ NLS1 galaxies, based on cross-correlating a catalogue of optically identified NLS1s with radio catalogues. This is the first systematic study of (non-radio-selected) radio-loud NLS1 galaxies, and of their radio, optical and X-ray properties. We use the term “Narrow-line Seyfert 1 (NLS1) galaxy” collectively for high-luminosity and low-luminosity objects, i.e. for narrow-line type 1 quasars and for narrow-line Seyfert type 1 galaxies. A cosmology with =70 km/s/Mpc, =0.3 and =0.7 is adopted throughout this paper.
This paper is organized as follows: In Section 2 we describe our methods for cross-matching a large number of catalogues and present candidate radio-loud NLS1 galaxies. In Sections 3 and 4 we provide results from our analysis of the optical and X-ray spectra of these NLS1s. Consequences of our results for NLS1 models, and mechanisms to explain the lower frequency of radio-louds among NLS1s than quasars are discussed in Section 5.
2 GAVO search for radio-loud NLS1 galaxies
2.1 Search methods
In order to search for radio-loud NLS1 galaxies and study their properties, we extracted all NLS1 galaxies included in the 11th edition of the “Catalogue of Quasars and Active Nuclei” compiled by Veron-Cetty & Veron (2003; henceforth referred to as VQC), separately for the catalogue of “faint” objects (i.e., Seyferts fainter than absolute magnitude ) and the “bright” ones (i.e, quasars brighter than ). We present results for the narrow-line type 1 quasars here, while results for the Seyfert galaxies will be reported elsewhere. The defining criterion for inclusion as NLS1 galaxy in the VQC is a width of the H emission line FWHM km/s. The list of the 128 selected narrow-line quasars was then cross-correlated with the FIRST (“Faint Images of the Radio Sky at Twenty centimeters”, at 1.4 GHz; White et al. 1997, Becker et al. 1995), NVSS (“NRAO VLA Sky Survey”, at 1.4 GHz; Condon et al. 1998), SUMSS (“Sydney University Molonglo Sky Survey”, at 843 MHz; Mauch et al. 2003), WENSS (“Westerbork Northern Sky Survey”, at 0.33 GHz; de Bruyn et al. 1998), PMN (“Parkes-MIT-NRAO” radio survey including all, the Southern Survey, Zenith Survey, Tropical Survey, and Equatorial Survey, at 4.85 GHz; Griffith et al. 1994), 87GB (“Green Bank Radio Survey”, at 4.85 GHz; Gregory & Condon 1991) and the PKS (“Parkes Radio Survey”, at 2.7 GHz; Wright & Otrupcek 1990) radio catalogues, in order to select all radio-detected NLS1s, and among these the radio-loud ones. The input list was simultaneously cross-correlated with the USNO-B1 (Monet et al. 2003), USNO-A2 and GSC2.2 optical photometry catalogues in order to obtain blue magnitudes.
For cross-matching of radio catalogues with optical catalogues we used the cross-matcher application developed within the German Astrophysical Virtual Observatory (GAVO)222See http://www.g-vo.org/ project. The GAVO cross-matcher is a multi-archive, multi-server, multi-catalogue, statistical spatial matcher operating solely on astrometric coordinates and their uncertainties (Adorf et al. 2003, 2005).
In our case, it takes as input an extract of the ‘Veron quasar catalogue’ which includes all NLS1 galaxies in that catalogue and their coordinates. A query module then accesses the VizieR archive333See http://vizier.u-strasbg.fr/viz-bin/VizieR and extracts coordinates and flux and magnitude data from selected catalogues in the archive.
While the VizieR match-list services are capable of deterministically matching the input list against a single catalogue, we then proceed in matching the different output lists against each other in order to find the most likely single multiwavelength “counterpart”. In a first step, match-candidates are generated in the following way: combinations of potential counterparts are formed, which are viewed as hypothetical “clusters” on the sky. For each such cluster its central position is computed, followed by a computation of the projected distances on the sky between each counterpart candidate and the central cluster position.
Next, based on the astrometric positions and associated uncertainties, for each counterpart in a given match candidate cluster its isotropic Mahalanobis distance (Mahalanobis 1936, Devroye et al. 1996) to the central cluster position is computed. It measures the statistical distance to the cluster center. For each cluster a goodness-of-fit criterion is computed, namely the standard -metric, which is simply the sum of the squared Mahalanobis distances. It can be viewed as a measure of compactness of the cluster, where instead of the physical distances, the statistical distances are being used.
Since the number of counterparts contributing to a match candidate generally differs from candidate to candidate, we cannot use the metric directly for comparing the goodness of the match. Instead the reduced metric is computed. For the required degrees of freedom we use , where denotes the number of counterparts contributing to a match candidate. We subtract in order to allow for the estimation (“fitting”) of the two sky-coordinates, i.e. right ascension and declination, when computing the cluster center. A reduced- threshold parameter is used for discriminating against unreasonable match combinations. Finally, for each remaining match candidate, the cross-matcher extracts the astrometry and optical and radio photometry data.
Position uncertainties, inherent to the different (radio) surveys, are either taken into account on an object-by-object basis if individual position errors are available (this is generally the case for the FIRST and 87GB catalogues in VizieR; typically 1′′ (FIRST) and 30′′ (87GB)) or else typical average position uncertainties for the different catalogues are used (explicitly, =1′′ (USNO-A2,USNO-B1,GSC2.2), 7′′ (NVSS), 30′′ (PKS and PMN), 10′′ (SUMSS and WENSS)). The catalogue-specific search radii were typically larger by a factor of 3.
2.2 Safety checks and data screening
While this automated way of simultaneously cross-correlating various catalogues and of selecting counterparts is generally very successful, there are still a number of “peculiarities” inherent to the way the catalogues were produced in general, or to individual galaxies in particular, which affect the cross-matching output and which make it necessary to check a number of results “by hand”. While the long term goal is to include most of these effects into the cross-correlation software, in this pilot project we paid special attention to actually identifying potential problems and effects that need closer attention in the future when applying similar cross-correlation methods to much larger samples.
Nearby bright galaxies are missed in blue magnitude catalogues because they are too extended and too bright for standard automated magnitude measurements to still work. This is not a problem for the present sample since the quasars are sufficiently distant but will be more severe for samples of nearby Seyfert galaxies.
A few catalogued NLS1s still have optical coordinate off-sets which are larger than expected in the optical band. One reason is that their IRAS coordinates rather than optical coordinates were still listed, which come with a larger uncertainty. Therefore, counterparts in blue magnitudes and FIRST radio sources might be missed. For the present sample, IRAS11598-0112 and RXJ01354-0426 were not assigned optical counterparts by the original cross-correlation procedure. IRAS11598-0112 had its IRAS coordinates catalogued, while the true optical coordinate then turns out to be consistent with the FIRST radio position. The optical counterpart of RXJ01354-0426 is off-set by 3-4′′ from the coordinate in the VQC. However, since there is no other good multi-wavelength counterpart in the field, we assume that optical, radio and X-ray source are one and the same.
Bright radio sources are often detected in several surveys with widely different positional uncertainties. In that case it is generally a good idea to then use the smallest positional error among the radio catalogues for further cross-correlation with non-radio catalogues to reduce the number of potential multi-wavelength match candidates. In the present study, in two cases, a bright source was detected in several radio surveys, suggesting we deal with one and the same source, but the source coordinates in those radio surveys with small coordinate uncertainties were no longer consistent with the optical position. In the specific case of RXJ07101+5002, only a 87GB counterpart was found by cross-correlation which is 45′′ off the optical position. The 87GB source has counterparts in several other radio catalogues including NVSS and FIRST, which show the same off-set from the optical coordinates and similar radio fluxes. This means the radio source is one and the same in all radio catalogues. However, given the small coordinate uncertainty in the FIRST catalogue, it can no longer be related to the optical NLS1 galaxy. The FIRST image reveals a complex radio structure with several bright knots and lobes. We have checked that none of these sub-structures coincides with the optical NLS1. Rather, the core of the radio galaxy does have a ‘normal’ galaxy as optical counterpart, reported by Bauer et al. (2000). The question remains whether the X-ray source RXJ07101+5002 then actually is the counterpart to the radio source (as often assumed; e.g., Bauer et al. 2000), or whether it is the counterpart to the optical NLS1 galaxy, as concluded by Xu et al. (2003) who provided the optical spectroscopy of that source. The radio galaxy is radio loud with =64. We exclude it from the sample, though, since the NLS1 galaxy is not its counterpart. In the case of SBS1330+519, only a WENSS counterpart was found, off-set by 20′′. The WENSS source has a FIRST and NVSS counterpart which, however, are too far off from the optical position of SBS1330+519 to be still considered as counterparts. SBS1330+519 was thus excluded from our sample. We note in passing that the relatively strong radio source itself does have a very faint optical counterpart in the Sloan Digital Sky Survey (SDSS; York et al. 2000) photometric catalogue (Abazajian et al. 2005), SDSSJ133219.38+514439.9. With SDSS and magnitudes of 21.5 and 22.3 mag, respectively, this background object is very radio loud (=8940). No optical spectrum is available.
Radio images of all radio-detected NLS1s were inspected by eye to convince ourselves of the reliability of counterpart identification.
2.3 Assessment of radio loudness
For all confirmed radio-detected objects their radio loudness was then estimated, following Kellermann et al. (1989), who define the radio index as ratio of 6cm radio flux to optical flux at 4400Å. is commonly used to mark the “border” between radio-quiet and radio-loud objects, originally calculated based upon the assumption of similar spectral shapes in the optical and radio band with (Kellermann et al. 1989). Radio-surveys employed in the present study generally measure at 1.4 GHz. Still keeping the same assumptions, in particular, , we compute the radio index at 1.4 GHz as =1.9, and we use =19 as a reasonable distinction between radio-loud and radio-quiet objects. Optical blue magnitudes mB2 were extracted from the USNO-B1 catalogue and used to calculate . For comparison, blue magnitudes from the first epoch of the USNO-B1 (mB1), the GSC2.2 (mBj) and the USNO-A2 (mB) catalogues were also collected to get an impression on the uncertainty in blue magnitude, which would be either due to source-intrinsic variability and/or measurement uncertainties.
As a last step, only a careful object-by-object check then allows to scrutinize which objects are actually radio-loud NLS1 galaxies, or good candidates. In particular, peculiar intrinsic spectral shapes, high redshift, or heavy absorption, which will affect radio and optical band in a different way, would invalidate the simple way of calculating the radio index as ratio of observed radio to optical flux density. Also, merging galaxies with close double nuclei make counterpart identification ambiguous. Finally, optical spectroscopic classification of each radio-loud candidate needs to be checked carefully in order to confirm its NLS1 nature. An uncertainty which generally cannot be overcome with existing data given their non-simultaneity, is source variability either in the optical and/or radio band.
2.4 Search results
2.4.1 General results
Among the 128 NLS1s in the VQC we find that 35 have radio counterparts in one or more catalogues. In Fig. 1 we present the distribution of their radio indices . Formally, among this sample, 11 objects exceed or are close to the “critical” value of =19 commonly used to distinguish between radio-quiet and radio-loud objects. The radio-loud NLS1s are TEX11111+329, SDSSJ094857.3+002225, SDSSJ172206.03+565451.6, IRAS20181-2244, RXJ0134-4258, PKS0558-504, IRAS09426+1929, SBS1517+520, RXJ16290+4007, 2E1346+2637, and RXJ23149+2243 (Tab. 1; sources are listed by their name as given in the VQC). Among these, we recover the previously known radio-loud NLS1 galaxies PKS0558-504, RXJ0134-4258, SDSSJ172206.03+565451.6 and SDSS J094857.3+002225.444Wang et al. (2004) claimed the detection of another radio-loud NLS1, SDSSJ022119.8+005628.4. However, the position off-set between SDSS galaxy and the faint NVSS radio source is 24′′, much larger than the expected off-set of 7′′ for faint sources. Furthermore, we do not find any radio counterpart in the FIRST survey, indicating that the very faint NVSS counterpart, if real, is either very extended or variable. Deeper radio observations are needed to confirm the existence of this radio source, and to see whether it indeed is the counterpart to the NLS1 galaxy. PK2004-447, not included in our sample since it is a Seyfert rather than a quasar, is unusual in almost lacking FeII emission in its optical spectrum (Oshlack et al. 2001), which led to the suggestion it could be a narrow-line radio galaxy or a type-2 AGN. Given the large scatter in FeII of the radio-loud objects of our sample, it is well possible that PK2004-447 is similar, just at the low FeII end and we include it in Tab. 1.
Based on average blue magnitudes of the non-detected sources and given the NVSS flux limit (2.5mJy), no more very radio-loud sources are expected among the non-detections. Several more borderline objects close to could exist, but only if their radio-flux was just exactly below the NVSS flux limit.
Radio source positions agree well with the optical coordinates of the sources. FIRST counterpart position off-sets are typically 1′′, while NVSS off-sets are typically 5′′. The radio emission of the radio-loud NLS1 galaxies is generally compact. Their FIRST extent is always 2′′ which is consistent with point sources (White et al. 1997).
The 35 radio-detected sources cover about four orders of magnitude in radio index . Below (Fig. 1) the data hint at a rather smooth distribution of radio indices, while only few objects are well above . A number of our objects (Fig. 2) fall into that part of the radio-loud regime sometimes referred to as ‘radio-intermediate’ ( 1-2, as opposed to ‘truly radio-loud’ above ; e.g., Falcke et al. 1996), a regime where objects are relatively rare, and which classically defined the radio-loud radio-quiet bimodality of AGN.
2.4.2 Variability
Several sources were observed during both the NVSS and FIRST survey, and these data can be used to assess the radio variability of the galaxies. Generally, we find that NVSS and FIRST radio fluxes agree well with each other. For three sources, fluxes differ by approximately a factor of 1.6–1.8. Among these, variability of SDSSJ094857.3+002225 (integrated flux density mJy and mJy) is likely real (Zhou et al. 2003). The other two sources are Mrk 478 ( mJy and mJy) and PHL1811 ( mJy and mJy). Higher NVSS than FIRST fluxes are actually expected in case of very extended sources because part of the extended emission will be missed by FIRST (e.g., Fig. 7 of White et al. 1997). Indeed, we find indications that the radio emission of PHL1811 is extended (major axis of 2.9′′ reported in the FIRST catalogue, and a value of in the NVSS catalogue). Inspecting the NVSS and FIRST images we find that Mrk 478 has a nearby bright companion source which might have slightly contributed to the NVSS radio flux estimate of Mrk 478. Barvainis et al. (1996) report a dedicated radio observation of Mrk 478 at 1.49 GHz with mJy, within the errors almost consistent with the NVSS and FIRST measurements.
Among those sources detected in the radio band there are 10 in the FIRST data base which do not have a NVSS counterpart, while 7 in the NVSS data base do not have a FIRST counterpart. The latter is just due to the non-availability of FIRST observations at the respective coordinates. The radio images of sources with FIRST-only detections were carefully inspected by eye and it turns out that all FIRST detections are consistent within better than a factor of two with the NVSS upper limits.
2.4.3 Radio spectral indices
Several sources were observed in the radio regime at more than one frequency. These data can be used to estimate radio spectral shapes. Radio spectral indices are reported in Tab. 1. shows a large scatter. Steep and flat spectrum sources are observed. While the two galaxies SDSSJ094857.3+002225 and RXJ16290+4007 show very flat spectra (=0.6 and 0.4, respectively) the majority of NLS1 galaxies are of steep spectrum type ().
2.4.4 Notes on individual objects
We comment here on the 11 apparently radio-loudest objects of this study, i.e. those falling above or close to the critical radio index, (Fig. 1). Emphasis is put on the question how safely these galaxies can be called “radio-loud” (Sect. 2.3) and how reliable their optical spectral classification is.
TEX11111+329 is an ultraluminous infrared galaxy (ULIRG). Optical spectroscopy was provided by Zheng et al. (2002) who classify TEX11111+329 as NLS1 galaxy (FWHM km/s, [OIII]/H=0.75, FeII/H=1.1). Lipari et al. (2003) report the detection of a high-velocity outflow component in [OIII]5007 with km/s. The galaxy is heavily absorbed, with at least =1.08, estimated from the observed Balmer-line ratio (Zheng et al. 2002). Assuming that this obscuration is not intrinsic to the line-emitting clouds (the BLRs in NLS1s might be sufficiently distant from the nucleus that dust can survive) and correcting the observed optical continuum spectrum by AB=4.5 leads to a much lower value of R. On the other hand, TEX11111+329 would also be classified as radio loud just based on its radio power, which is W/Hz. The radio spectrum declines toward higher frequencies, and TEX11111+329 is not detected in an imaging survey at 15 GHz (Nagar et al. 2003). We keep the source as candidate radio-loud NLS1.
SDSSJ094857.3+002225 is a very radio-loud NLS1 galaxy (Zhou et al. 2003), variable in the radio and likely the optical band. Inspecting the NVSS and FIRST radio image, we noticed a second radio source very close to SDSSJ094857.3+002225, FIRSTJ094901.5+002258, at a separation of 71′′ (corresponding to a projected distance of 395 kpc) and extended by 5′′. Suspecting it to be either a knot in a radio jet of SDSSJ094857.3+002225, or a background source, we had a closer look at optical images and cannot identify any optical counterpart. Closest is a faint SDSS galaxy, SDSSJ094901.9+002306.4, at an off-set of 10′′, an unlikely counterpart of the FIRST radio source. It is possible that the radio source has a faint, so far undetected, optical counterpart.
SDSSJ172206.03+565451.6 is a very radio-loud NLS1 galaxy. Depending on choice of blue magnitude, it may be comparably radio-loud as SDSSJ094857.3+002225. Its radio loudness and optical spectral properties are discussed in detail by Komossa et al. (2006). In particular, its black hole mass in unusually small given its radio loudness (Komossa et al. 2006). SDSSJ172206.03+565451.6 is the optically most variable among our sample.
RXJ0134-4258 is a radio-loud NLS1 galaxy (Grupe et al. 2000) with peculiar X-ray spectral variability (Komossa & Meerschweinchen 2000, Grupe et al. 2000). It was detected in the PMN survey and its radio-loudness was confirmed by a dedicated follow-up observation by Grupe et al.
IRAS 20181-2244 was identified as a quasar with narrow emission lines by Elizalde & Steiner (1994). Halpern & Moran (1998) rejected a “type-2 quasar” classification of IRAS20181-2244 and called it a NLS1-type object, with FWHMHβ=460 km/s and the presence of broad wings in the Balmer lines. Kay et al. (1999) found low-level continuum polarization (2%) but no broad Balmer lines. The X-ray emission of IRAS20181-2244 (e.g., Vaughan et al. 1999) is rapidly variable (Halpern & Moran 1998, Leighly 1999). The Balmer decrement of the narrow lines implies significant reddening (Tab. 1 of Halpern & Moran 1998) but the rapid X-ray variability argues against a full obscuration of the continuum source itself. The ASCA X-ray spectral fits indicate some excess absorption along the line of sight and Halpern & Moran give mag as a reasonable estimate of extinction intrinsic to IRAS 20181-2244. In the radio band, IRAS 20181-2244 is also detected during the WISH (Westerbork in the Southern Hemisphere) survey at 352 MHz (de Breuck et al. 2002).
RXJ16290+4007 is a bright source in the X-ray (e.g., Giommi et al. 1991, Elvis et al. 1992, Brinkmann & Siebert 1994) and radio band (e.g., Giommi et al. 1991, Laurent-Muehleisen et al. 1997, White et al. 2000) likely variable by 0.5 mag optically (Helfand et al. 1991). RXJ16290+4007 is known as flat spectrum radio quasar (FSRQ). Its FSRQ nature, with respect to its X-ray and radio properties, is discussed in detail by Padovani et al. (2002). Steady TeV gamma ray emission from RXJ16290+4007 was searched for, but not detected, with the Whipple telescope (Falcone et al. 2004). Optical spectra provided by Bade et al. (1995) hinted at the NLS1 nature of RXJ16290+4007, which was confirmed by Schwope et al. (2000) and Grupe et al. (2004).
While Padovani et al. (2002) concentrated on the radio and X-ray properties of RXJ16290+4007, interpreted its relatively steep X-ray spectrum as due to synchrotron radiation, and suggested RXJ16290+4007 is the first member of a newly established class of HBL(high energy peaked BL Lac)-like FSRQs, we rather follow the alternative idea that the optical and X-ray properties of this source are driven by its “narrow-line Seyfert 1 character”.
IRAS09426+1929 is ultraluminous in the infrared with a single nucleus. Zheng et al. (1999) identify as counterpart of the IR source a NLS1 galaxy at =0.284, based on an optical spectrum which shows weak [OIII], strong FeII and narrow Balmer lines (no line parameters were measured). On the one hand, the host galaxy is detected as well and may contribute to the blue magnitude which would make the computed value of the radio index a lower limit. On the other hand, extinction measurements are not yet available for IRAS09426+1929. Since the cores of ultraluminous infrared galaxies are often heavily obscured, any calculation of based on the observed optical spectrum would then make the value of an upper limit. This second effect is likely to exceed the first.
PKS0558-504 is a known radio-loud source (Remillard et al. 1986, Siebert et al. 1999), with an optical NLS1 spectrum (Remillard et al. 1986). It is highly variable in the X-ray band (e.g., Remillard et al. 1991, Gliozzi et al. 2001, Wang et al. 2001). The rapid X-ray variability and the lack of excess X-ray absorption (O’Brien et al. 2001, Brinkmann et al. 2004) indicate an unobscured view on the central engine.
RXJ23149+2243 was identified as quasar with strong FeII emission by Wei et al. (1998). Xu et al. (2003) report emission-line measurements which indicate a relatively large width of the Balmer lines. Our newly taken spectrum (Sect. 3) puts the galaxy at the border between NLS1 and Seyfert 1, depending on the way the width of H is measured. The [OIII]5007 line of this galaxy shows an exceptionally strong blue wing which is blueshifted from the narrow core by 1260 km/s (Sect. 3). RXJ23149+2243 is detected by IRAS and turns out to be a luminous infrared galaxy (LIRG).
2E1346+2637 is an ultrasoft AGN (photon index ) at high redshift, =0.92 (Puchnarewicz et al. 1994), optically classified as NLS1 galaxy (FWHM 1900 km/s, weak [OIII] and presence of FeII; Puchnarewicz et al. 1992). The X-ray spectrum of the galaxy displays one of the strongest soft excesses known. Puchnarewicz et al. (1994) report a radio upper limit of 6 mJy at 4.85 GHz and mention that this leaves a small margin that 2E1346+2637 is radio-loud. 2E1346+2637 is detected by FIRST but not NVSS. The NVSS upper limit is consistent with the FIRST measurement.
SBS1517+520 is listed as NLS1 in the VQC but little else is known about this galaxy (Bicay et al. 2000 reported its optical position). Our analysis of the SDSS spectrum (Sect. 3) does not confirm its classification as a NLS1 galaxy in the sense that FWHM = 3220 km/s (based on single-component Gauss fit (Tab. 2); only the ‘direct’ determination of the width of , FWHM = 2030 km/s, puts it close to the border). Because other emission-line parameters share similarity with those of NLS1 galaxies, we continue to include SBS1517+520 in our tables.
3 Optical spectroscopy of the radio-loud NLS1s
In order to measure the optical emission-line and continuum properties of the radio-loud NLS1s in a homogeneous way, we (re-)analyzed their optical spectra when available. The spectrum of RXJ0134-4258 was taken by one of us (D.G.) at ESO’s 1.5m telescope (Grupe 2004), as was the spectrum of RXJ23149+2243 (D.X.), at the Xinglong 2.16m telescope (Xu et al. 2003), while those of SDSSJ094857.3+002225, SDSSJ172206.03+565451.6, RXJ16290+4007, SBS1517+520 were extracted from the SDSS data base555See http://cas.sdss.org/dr4/en/tools/explore/obj.asp. In addition, a new spectrum of RXJ23149+2243 was secured on November 25, 2005 at the 2.16m Xinglong telescope, motivated by the remarkable structure of the [OIII]5007 profile of this galaxy. SDSS spectra of the other galaxies are not (yet) available. For them, emission-line data were collected from the literature when published (Tab. 2).
The SDSS DR4 products were used. These spectra are flux- and wavelength-calibrated by the spectroscopic pipeline in the course of the DR4 processing. The spectrum newly taken with the 600 g mm-1 grating at the 2.16m Xinglong telescope was reduced following standard procedures (see Xu et al. 2003). The IRAF package SPECFIT (Kriss 1994) was used for spectral analysis.
We first corrected the spectra for Galactic extinction, using the Galactic EB-V in the direction of the individual galaxies (Schlegel, Finkbeiner & Davis 1998) and a R=3.1 extinction law. We then fit a power law to the underlying continuum using the “continuum windows” at 3010-3040, 3240-3270, 3790-3810, 4200-4230, 5080-5100, 5600-5630, 5970-6000, and 6005-6035 (Forster et al. 2001, Vanden Berk et al. 2001) known to be relatively free from strong emission lines. The continua are generally well fit by single powerlaws with indices between and ().
Since the optical-UV spectra of all sources show emission from FeII complexes, an FeII spectrum was then fitted and subtracted (excluding the UV FeII multiplets around MgII2798 which are not included in the template) using the optical FeII template and the technique described by Boroson & Green (1992).
The FeII- and continuum-subtracted spectra were then used to measure emission-line properties. The emission lines were modeled by single Gaussian profiles or combinations of Gaussians and Lorentzians. The approach was to fit single-component Gaussians to the weak forbidden lines, apply two-component Gaussians to [OIII] when necessary, and compare double Gauss and Gauss-plus-Lorentz profiles in their success in representing the H and H line profile. In addition, a direct measurement of the H line width was performed (without any assumption on line profile shape). H line results are marked with an index ‘g’ or ‘d’ if referring to a Gaussian fit or the ‘direct’ method, respectively, and with ‘b’, ‘n’ or ‘totl’ when referring to the broad, narrow or whole emission component, respectively, of a two-Gaussian decomposition of the line profile.
Results for the diagnostically most important emission lines are listed in Tab. 2. For the sake of simplicity and homogeneity, the listed emission-line ratios are based on single Gaussian fits to the lines, even though for some sources this is not a perfect match of the line profile. The instrumental resolution was corrected for in the FWHMs measured by us. We confirm the NLS1 classification for almost all galaxies, with the possible exceptions of SBS1517+520 and RXJ23149+2243 (see below). Line widths of confirmed NLS1s range between FWHM = 930-1580 km/s, while the flux ratio [OIII]/H varies between 0.04 – 1.1 (results from Gauss fits are reported here). FeII is detected in all spectra and ranges between FeII4570/H = 0.5–3.2 (FeII4570/H = 0.5–2.4). The NLS1 galaxies of our sample cover almost the whole range of FeII4570/H observed in the NLS1 population (e.g., Tab. 3 of Veron-Cetty et al. 2001), except that the lowest FeII/H ratios are missing in our sample.
SBS1517+520 and RXJ23149+2243 have rather broad Balmer lines, and it depends on the way the profile of H is fit whether or not they formally fullfil the criterion of FWHM km/s. Both of them have FWHM km/s while FWHM km/s. While the strict cut in FWHM is a useful working criterion for extraction of NLS1 galaxy candidates from larger samples, it has been repeatedly noted that the cut value is not well defined or even completely arbitrary. Veron-Cetty et al. (2001) suggested that a better classification criterion than FWHMHβ may actually be the FeII ratio, FeII4570/H. According to this criterion, both SBS1517+520 and RXJ23149+2243 still classify as NLS1s. After these cautious comments, we continue to keep the two galaxies in the sample, even though they fail a strict FWHM km/s criterion.
RXJ23149+2243 is exceptional in showing a very strong and broad blue wing in the [OIII]5007 and [OIII]4959 lines. The presence of the blue wing was hinted in the earlier low-resolution spectrum of Xu et al. (2003) and was confirmed in the new spectrum we took in November 2005 (full results on this galaxy will be presented elsewhere). [OIII]5007 is well modeled by two Gaussian lines. The core, with FWHM=620 km/s, is at the same redshift as the peak of H while the wing, with FWHM=1560 km/s, is highly blueshifted by 1260 km/s. SBS1517+520 also shows a blue wing in [OIII]. The line is well fit by two Gaussians with FWHM=610 km/s and FWHM=2070km/s, blueshifted by =90 km/s. In the SDSS spectra of the other objects of our sample the blue wing is present, but not exceptionally strong. For SDSSJ172206.03+565451.6 the line blueshift is =140 km/s, for RXJ16290+4007 we measure =230 km/s.
4 X-ray spectroscopy and variability
While some of the sources of our sample have no previous X-ray studies, others (in particular, PKS0558-504) have been observed by most major X-ray satellites. In order to obtain representative X-ray fluxes of all our sources in a homogeneous way, including upper limits for non-detected sources, we make use of the data obtained with the PSPC (Positional Sensitive Proportional Counter) during the ROSAT all-sky survey (RASS; Voges et al. 1999) and the later phase of pointed observations.
9 out of the 11 soures have X-ray detections, 8 of these in the RASS and 3 in pointed observations. Countrates and hardness ratios were obtained for all sources. Fixing the absorption at the Galactic values in the directions of the individual sources, hardness ratios were then converted to powerlaw indices, and the absorption-corrected flux in the (0.1–2.4) keV band was determined. Powerlaw indices are in the range (Tab. 2) with the exception of the faint source SBS1517+520 (, likely caused by excess absorption). In case pointed observations existed (RXJ16290+4007, 2E1346+2637, RXJ0134-4258) these were given preference over the RASS data.
For the two non-detected sources, TEX11111+329 and IRAS09426+1929, upper limits were obtained. However, we caution while soft X-ray non-detections convert into safe upper limits for non-obscured sources, the same is not true for obscured sources. This is likely the case for both TEX11111+329 and IRAS09426+1929. For completeness, we report the 2 upper limits on the soft (0.1–2.4 keV) X-ray count rates in Tab. 2, but do not convert them into luminosities, and do not use them for accretion rate estimates.
We also inspected the RASS X-ray lightcurves of the X-ray brighter sources and find that most are consistent with constant source flux except PKS0558-504 which shows repeated flaring activity. Variability of the X-ray fainter sources cannot be judged due to the poor statistics.
5 Discussion
Judged on radio index, 11 objects classify as radio-loud NLS1 galaxies or candidates. Our study almost triples the number of recognized radio-loud NLS1s if the candidates close to the deviding line are confirmed. Implications of the new results are discussed below.
5.1 Comparison of the properties of the known radio-loud NLS1 galaxies
Even though the number of known radio-loud NLS1s and the candidates is still small, we have enough objects now to compare their X-ray, optical and radio-properties, to have a first assessment of their similarities or differences. In particular, we checked whether the 11 radio-loud NLS1s are extreme in one or more of their multi-wavelength spectral properties, i.e., whether they differ significantly from the radio-quiets in their properties, and whether there is a trend within the sample such that one or more properties correlate with radio loudness.
Among optical emission lines, the “first Eigenvector” (Boroson & Green 1992) is evident among the objects of our sample in that weak [OIII]/H emission tends to go hand in hand with strong FeII emission and vice versa. Both, [OIII]/H and FeII/ vary strongly across the sample, almost spanning the whole range observed in NLS1 galaxies. In Fig. 3 we plot the location of the radio-loud NLS1s in the FeII–[OIII] diagram, in comparison with one of the largest homogeneously analyzed optical NLS1 samples available to date (Xu et al. 2006). We do not find a strong correlation of any of the parameters with radio loudness, but larger samples are needed to confirm this.
Even though radio loudness did not occur in the sample of Marziani et al. (2001) for line widths FWHM km/s, the radio-louds of our sample do populate similar regions as other AGN in the FWHM-FeII diagram (Fig. 4 of Marziani et al. 2001), and extend the range where radio loudness is observed to significantly smaller FWHMs than previously known (see also Sect. 5.5).
Given suggestions that the blue wings in the [OIII]5007 line of quasars are sometimes linked to interactions of the radio plasma with the NLR clouds (Leipski & Bennert 2006, and references therein) we paid special attention to the existence and strengths of blue wings in dependence of radio loudness but do not find any correlation, even though 2-3 out of the 11 sources do show very intense blue wings, two with strong blueshifts, among the highest values ever observed.
Most NLS1s of our sample have steep radio spectra (Tab. 1) in the frequency band 0.33–1.4–4.85 GHz666The non-simultaneity of the data, taken with different instrumental configurations, has to be kept in mind, but unlikely all scatter in among the sample can be traced back to variability, else variability in individual cases would be huge. and their radio emission is compact. As such, they share some similarity with ‘compact steep spectrum sources’ (CSS, Peacock & Wall 1982) which are believed to be young radio sources which did not yet evolve strongly (Marecki et al. 2005, and references therein). SDSSJ094857.3+002225 and RXJ16290+4007 have inverted radio spectra. Only one source, SDSSJ094857.3+002225 (Zhou et al. 2003), shows significant variability in the radio-band by a factor 1.6.
Soft X-ray spectra are generally steep, but come with large errors. The mean ROSAT powerlaw index of the radio-loud NLS1s of our sample777note that a number of them were first identified by X-ray observations (excluding SBS1517+520 which has unusually flat index), , is similar to that of soft X-ray selected NLS1 galaxies (, Grupe et al. 2004). PKS0558-504 (e.g., Remillard et al. 1991), IRAS20181-2244 (Halpern & Moran 1998) and RXJ16290+4007 (Padovani et al. 2002) are highly variable in the X-ray band while RXJ0134–4258 strongly changed its spectral shape (Grupe et al. 2000, Komossa & Meerschweinchen 2000).
5.2 Starburst contribution ?
It was suggested that NLS1s are AGN in an early phase of evolution. This includes the possibility of enhanced starburst activity in these objects (e.g., Mathur 2000, Shemmer et al. 2004). Could starbursts contribute to or dominate the radio power of the radio-loud NLS1s of our sample? Generally, normal and starburst galaxies are much less luminous than quasars in the radio regime. In particular, all of our NLS1s also exceed the radio powers of a sample of the most radio-luminous starbursts, all of them in luminous and ultraluminous infrared galaxies (Smith et al. 1998), W/Hz. Radio powers place all of our NLS1s with in the radio-loud regime (, Joly 1991), some of them close to the lower border, though.
At first glance, a significant starburst contribution might be suspected for the two ultraluminous infrared galaxies among our sample, TEX11111+329 and IRAS09426+1929. We used the tight correlation between IR luminosity and radio luminosity of starburst galaxies (Yun et al. 2001, and references therein) to predict the expected starburst radio power, given the 60 IR luminosities of these two galaxies measured by IRAS. According to equ. (4) of Yun et al. (2001), with W/Hz TEX11111+329 exceeds by a factor of 10 the contribution expected from a starburst, while for IRAS09426+1929 the measured radio power, W/Hz, is a factor 5 above the predicted starburst contribution. TEX11111+329 has radio observations at several frequencies. The spectral index is relatively steep, but comparable to other sources of our sample. The spectral index between 0.33-1.4 GHz is similar to SDSSJ172206.03+565451.6 and PKS0558-504 while towards higher frequencies it is comparable to RXJ0134-4258.
The same comparison between observed radio power and expected starburst contribution was done for the three other galaxies with IRAS 60 flux measurements. We find that the observed radio powers of PKS0558-504, IRAS20181-2244, and RXJ23149+2243 exceed by factors of 115, 6, and 6, respectively, the predicted starburst contribution.
We conclude that radio-luminous starbursts are unlikely to dominate the radio emission of most of our sources.
5.3 Black hole masses
Reverberation mapping of Seyfert galaxies established a relation between the radius of the broad line region and the optical luminosity (Kaspi et al. 2005, Peterson et al. 2004, and references therein). Assuming that the broad line region (BLR) clouds are virialized (e.g., Wandel et al. 1999), the black hole mass can then be estimated as . The BLR radius, , in dependence of the optical luminosity at 5100Å is given by ld (equ. (2) of Kaspi et al. 2005). The velocity of the BLR clouds is usually estimated from the FWHM as where for an isotropic cloud distribution. While the relation is now well established for nearby Seyfert galaxies, few NLS1s have been reverberation mapped so far (Peterson et al. 2000). Following standard practice, we assume equ. (2) of Kaspi et al. (2005) is indeed applicable to NLS1 galaxies as well and proceed in estimating the BH masses of our sample.
was derived from the SDSS spectra (corrected for Galactic extinction) when available, or else estimated from blue magnitudes of the USNO-B1 catalogue (note that some of the galaxies of our sample vary in the optical band which introduces an uncertainty in the black hole mass estimates. Most objects, however, vary by less than a factor 2). The FWHM of the broad component from the two-component fit of H was used for the black hole mass estimates reported in Tab. 3 when optical spectra were available. Else, results on FWHM from single-component line fits collected from the literature (Tab. 2) were used for an order-of-magnitude estimate.
We obtain black hole masses in the range M⊙ (objects with two-component decomposition of H available) and M⊙ (objects with single component fits to H; this underestimates FWHM and therefore underestimates the black hole mass) for our sample. These masses are surprisingly small, given the radio loudness of the galaxies (Fig. 4). In fact, all galaxies fall right into an unpopulated regime of the “Laor diagram” (Fig. 2 of Laor 2000) which plots radio loudness in dependence of black hole mass. While larger samples filled up some originally empty areas in the Laor diagram, and while some discussion has emerged whether there is any clear dependence of black hole mass on radio loudness at all (e.g., Lacy et al. 2001, Oshlack et al. 2002, Woo and Urry 2002, McLure & Jarvis 2004, Best et al. 2005), our radio-loud NLS1 galaxies are still located in an area very sparsely populated by galaxies. Firstly, because the black hole masses are unusually small given the radio loudness of the galaxies of our sample (e.g., Fig. 2 of Laor et al. 2000, Fig. 3 of Lacy et al. 2001, Fig. 2 of McLure & Jarvis 2004, Fig. 10 of Metcalf & Magliocchetti 2006). Secondly, because most radio indices of our objects are in a range which is classically known to be less populated by quasars and which defined the radio-loud radio-quiet bimodality of AGN (with radio-quiet quasars below and many radio-loud quasar above (e.g, Fig. 10 of Woo & Urry 2002)). An even more extreme outlier is PKS2004-447 which shows lower BH mass and higher radio index than objects of our sample (Oshlack et al. 2001).
While of unusually low mass when compared to radio-loud quasars, among the NLS1 population itself our radio-loud NLS1s are actually at the high-mass end (for comparison, in the sample of Grupe & Mathur (2004) NLS1 masses range between 6 105–4 107 M⊙ with only one object around 108 M⊙). To some extent, the lack of higher mass BHs among NLS1s in general may just be a ‘selection’ effect which arises from the standard definition of NLS1s as objects with FWHM km/s. Since there is a clear correlation between H luminosity and H width (e.g., Fig. 15 of Veron-Cetty et al. 2001), higher luminosity AGN should have broader Balmer lines finally exceeding FWHM 2000 km/s and thus would no longer be called NLS1s. Ideally, any NLS1 defining criteria should incorporate that effect (Wills et al. 2000).
In any case, while we cannot exclude that NLS1s with higher BH masses do exist, the fact that the radio-loud objects of our sample cluster in a previously almost unpopulated parameter space of and is still remarkable. We caution there are indications that 2-3 galaxies of the sample are actually beamed sources (Sect. 5.7.1). Any contribution of beamed emission to the optical band makes our estimate of black hole mass an upper limit, while, on the other hand, we underestimate the black hole mass if the BLR clouds are arranged in a disk rather than a sphere (Vestergaard et al. 2000). Among the sources of our sample, SDSSJ172206.03+565451.6 is the radio loudest with ‘reliable’ radio index measurement, since no indications for beaming and likely no absorption in the optical band (Komossa et al. 2006).
5.4 Accretion rate
With knowledge of BH mass and X-ray luminosity it is possible to perform an estimate of the accretion luminosity relative to the Eddington value. We intentionally use the X-ray luminosity here, and we do not apply any bolometric correction, since it is unlikely constant for all NLS1 galaxies, and since, in particular, the EUV part of their SED is unknown888There have been suggestions that the X-rays connect in one ‘big blue bump’ to the optical band on the one hand, but findings that NLS1s are underluminous in the UV on the other hand, and inspections of individual objects lead to expectations of flat EUV-SEDs in some cases, soft-excesses in other cases. Ideally, bolometric corrections would therefore be done for each object individually, based on a measurement of the multi-wavelength SED on the one hand, and detailed emission-line modeling on the other hand in order to constrain the EUV-part of the SED from emission-line ratios and H line flux. .
We find that the ratio of (0.1-2.4 keV) luminosity to Eddington luminosity (Tab. 2) ranges between / = 0.02 (RXJ23149+2243) and 0.7 (RXJ16290+4007) without any bolometric correction which might typically be an additional factor 5–10 (Tab. 14 and 15 of Elvis et al. 1994). An exception is SBS1517+520 with / = 0.007. We suspect that this very faint X-ray source is absorbed in X-rays by a (dust-free) absorber which would also explain its very flat powerlaw with index which is formally obtained when fixing the absorption at the Galactic value. We excluded TEX11111+329 and IRAS09426+1929 from this estimate since no meaningful X-ray upper limit could be obtained.
For comparison with / values reported in the literature we also estimated bolometric luminosities based on the optical luminosity at 5100Å, and a constant bolometric correction factor of 9 (e.g., Sect. 2 of Warner et al. 2004, Greene et al. 2006); i.e. (5100Å). This gives an average /=1.2 (again excluding TEX11111+329 and IRAS09426+1929, plus IRAS20181-2244) which is higher than the NLS1 average of Warner et al. (2004; 0.67, but note that they used CIV1549 rather than H for BH mass estimates) but not as high as observed in the most luminous quasars (e.g., Warner et al. 2004, Shemmer et al. 2004).
5.5 Radio-FeII connection, comparison with Population A/B sources, and the radio-loud radio-quiet bimodality in ‘Eigenvector 1’
Among broad-line quasars the nature of the FeII emission has been much discussed in the literature with respect to radio properties (e.g., Joly 1991, Miller et al. 1993). Two models were considered to explain the connection between radio and FeII emission in radio-loud sources: an orientation-dependent model of FeII emission (e.g. Jackson & Browne 1991), and a jet model in which FeII is produced when the jet interacts with the ambient medium (Joly 1991). Boroson & Green (1992) and Boroson (2002) find that radio loudness is statistically linked to the physical parameters that drive “Eigenvector 1” in the sense that quasars with strong [OIII] and weak FeII are preferentially radio-loud while strong FeII emitters are generally radio-quiet objects (for an example of an exception, see Zhou et al. 2002).
The radio-loud NLS1s of our sample do not fit in this scheme in the sense that their FeII emission does not show a clear dependence on radio loudness, but almost covers the whole observed range in NLS1 galaxies (Fig. 3; cf. Fig. 4 of Marziani et al. 2001). In particular, RXJ0134-4258, the 4th radio-loudest of our sample, is one of the strongest FeII emitters known.
Sulentic et al. (2003) demonstrate that the radio-loud radio-quiet distinction of AGN is obvious in their ‘Eigenvector 1’ which links the width of the broad component of H with the equivalent-width ratio of FeII to H (their Fig. 3), in the sense that radio-loud and radio-quiet objects occupy different domain spaces. NLS1 galaxies are not among their sample. Sulentic et al. define two populations of AGN according to their emission-line properties. ‘Population A’ are sources with FWHM km/s, while FWHM km/s in ‘population B’ sources. In their sample, radio loudness is almost exclusively confined to population B. The radio-loud NLS1 galaxies of our sample fall into the rarely populated regime of Fig. 3 of Sulentic et al., most of them in the ‘gap’ between radio-louds and radio-quiets, but not to an extent that the bimodality is obliterated.
5.6 Inclination
Orientation plays an important role in AGN unification scenarios of both Seyfert galaxies (Antonucci 1993, Elvis 2000) and radio galaxies (Urry & Padovani 1995). Inclination also enters black hole mass and accretion rate estimates and consequently affects black hole mass – bulge mass relations of NLS1s and their cosmological implications (see e.g. the discussion in Collin & Kawaguchi 2004).
The orientation of NLS1s w.r.t our line of sight has repeatedly been addressed, and arguments and evidence in favor of and against a pole-on view have been presented. Originally, for instance, a pole-on view was suggested to explain the small width of the Balmer lines (e.g., Osterbrock and Pogge 1985, Puchnarewicz et al. 1992, Bian & Zhao 2004). The disk emission of FeII is also anisotropic and FeII emission is strongest when the disk is viewed face-on (e.g., Miller et al. 1993, Marziani et al. 01). A pole-on orientation was also suggested for individual NLS1s with extreme variability (e.g., PKS0558-504: Remillard et al. 1991). Correcting for these orientation effects, systematic or random in nature, is also important in the context of black hole mass estimates and black hole mass – bulge mass relations of NLS1s, which make use of Balmer line widths. On the other hand, Smith et al. (2004) argued that, based on their polarization properties, there are no indications that NLS1s are preferentially viewed face-on.
Radio observations of NLS1 galaxies allow us to re-address orientation issues. Among our sample, there are 2-3 NLS1s which are likely beamed (SDSSJ094857.3+002225, RXJ16290+4007, and possibly PKS0558-504; Sect. 5.8.1), implying a pole-on view onto the ‘central engine’. If the width of the Balmer lines was dominated by orientation, we would then expect these objects to show very narrow Balmer lines. This is not the case (FWHM and 1800 km/s, respectively for SDSSJ094857.3+002225 and RXJ16290+4007), though. Larger samples of beamed NLS1 galaxies are needed to put this on a firmer statistical basis.
5.7 Frequency of radio-loud NLS1 galaxies
Of the 128 NLS1 galaxies in the Veron quasar catalogue, 90% are located within the NVSS survey area. Among these, 7% are formally radio-loud (), while only 2.5% exceed . One or a few of these sources are most likely significantly absorbed and one or two are at the border between Seyfert 1 and NLS1 galaxy. Given a fraction of 13-20% of radio-louds among optically selected quasars (e.g., Visnovsky et al. 1992, LaFranca et al. 1994, Falcke et al. 1996), radio-loud NLS1s are more rare than radio-loud quasars.
In order to compare directly the fraction of radio-louds among narrow-line and broad line type I quasars listed in the VQC, we have also extracted the broad line quasars from the VQC, cross-correlated them with the NVSS catalogue, and determined the fraction of radio-louds the same way we did for the NLS1 galaxies. We find that 90% of the objects are located within the NVSS survey area. Among these, 20% are radio-loud (), and 14% exceed . Again, this indicates a lack of radio-louds among NLS1s, particularly at high values of radio index .
When comparing the frequency of radio-loud NLS1s with radio-loud type I quasars, two things have to be kept in mind. Firstly, the mere definition of NLS1s as objects with FWHM km/s likely biases the observed black hole mass distribution towards excluding the most massive black holes. Since there are indications that radio-loud AGN have, on average, higher BH masses (e.g., Metcalf & Magliochetti et al. 2006), we may automatically miss some of the most massive radio-loud NLS1s because they escape the definition as NLS1s and are rather called Seyfert 1s.
Secondly, specific to the present sample, great attention was paid to each single object in that cautious comments were issued in case of evidence for excess extinction, and in that line profiles were fit with a number of different models. The same detailed object-by-object analysis should be applied to comparison samples of quasars, when citing the fraction of radio-loud quasars in comparison with that of radio-loud NLS1 galaxies.
Keeping this in mind, it still appears that radio-loud NLS1s are less abundant than radio-loud quasars, and we proceed in attempting to explain this distinction.
The cause of radio loudness in quasars is still unknown, even though a number of different models have been suggested and investigated including the influence of spin (e.g., Wilson & Colbert 1995, Blandford 2000, Ye & Wang 2005), black hole mass (e.g., Laor 2000, Metcalf & Magliocchetti 2006), the rate of cooling gas in the host galaxy (Best et al. 2005) and beaming in radio-intermediate FSRQs which were suggested to be relativistically boosted radio-quiets (Miller et al. 1993, Falcke et al. 1996).
Two key questions regarding the radio properties of the NLS1 galaxies are: Why is the phenomenon of radio loudness rarer in NLS1 galaxies than in quasars? And, related to that: Is the mechanism which drives the radio loudness the same in both types of objects, or is a fundamentally different mechanism at work in the few radio-loud NLS1s? We discuss several models in turn.
5.7.1 Beaming
We first explore the possibility that NLS1s might be radio-quiet but intrinsically beamed sources. In this scenario, one then expects that other optical and X-ray properties of the radio-loud NLS1s are affected as well. For instance, FeII emission might be extreme if it originates in a disk which is viewed face on (e.g., Miller et al. 1993). Also, X-ray soft excess emission is expected to be stronger if the sources are viewed face on for the case of a geometrically thick accretion disk (Madau 1998). At the same time there might be a flatter non-thermal contribution to X-rays from the jet emission.
While a few sources of our sample are indeed good candidates for beaming, others are not. RXJ16290+4007 and SDSSJ094857.3+002225 are likely beamed, but only RXJ16290+4007 is radio-‘intermediate’. RXJ16290+4007 likely is a blazar of FSRQ type (e.g., Padovani et al. 2002) and SDSSJ094857.3+002225 exhibits strong variability in the radio band (Zhou et al. 2003). These are the only two sources among our sample with very flat radio spectra (Tab. 1). Apart from that, PKS0558-504 exhibits unusual X-ray flaring activity and there have been repeated speculations that this may be related to beaming effects in a jet (Remillard et al. 1991, Gliozzi et al. 2001, Wang et al. 2001). An origin in the accretion disk is an alternative, though, and this latter model is preferred by Wang et al. (2001) and by Brinkmann et al. (2004) to explain the XMM data.
Other sources of our sample are steep spectrum radio sources where strong beaming is generally not expected. X-ray spectra are steep (even those of the two FSRQs), arguing against the dominance of a non-thermal Doppler-enhanced contribution to the soft X-ray spectrum. Beamed sources more typically show .
5.7.2 Accretion mode
While estimated Eddington accretion rates are in line with other findings that NLS1 galaxies are accreting close to or above their Eddington limit, the radio loudness of such sources is unexpected at first glance, given observations that radio emission is suppressed in accretion high-states in some types of Galactic and extragalactic sources. According to Maccarone et al. (2003, and references therein), Galactic X-ray binaries in soft/high-state and AGN show quenched radio emission for relatively high accretion rates. Even though the analogy between Galactic black holes and NLS1 galaxies has been drawn repeatedly (e.g., Pounds et al. 1995), it is still unclear how far it reaches. Greene et al. (2006, and references therein) more generally suggested that radio loudness is anti-correlated with (their Fig. 3) in a sample of Seyferts and PG quasars, albeit with quite some scatter. Whether this trend still holds for high-redshift, highly accreting quasars has yet to be explored. So far, these observations suggest, whatever the mechanism to suppress radio emission for high could also be responsible for the lower fraction of radio-louds among NLS1s.
While it is generally agreed upon that jet formation (and thus radio emission) is intimately linked to the presence and structure of an accretion disk, the actual mechanism of launching a jet from the inner disk regions is not yet really understood (see, e.g., Celotti & Blandford 2001 and Meier 2003 for recent reviews). One may speculate that the observed differences originate from differences in the accretion mode between stellar mass and super-massive black hole accretors and between different classes: It is generally agreeed upon that at relatively low accretion rates (in terms of the Eddington rate), radiatively inefficient accretion flows prevail (e.g., Beckert & Duschl 2002). Independent of yet not fully understood details of these flows, they seem to be potentially efficient in producing radio emission themselves (e.g., Yi & Boughn 1998, Narayan et al. 1998). At rates closer to, but still well below the Eddington limit disks turn optically thick and geometrically thin (see Wang et al. 2002 for a suggestion how radio-emission might be enhanced in this case). Barring details at these low accretion rates the properties of the flows seem to be rather similar between stellar mass and super-massive black hole accretors.
When the accretion rate reaches or even surpasses the Eddington rate, however, the physical state of the accretion process becomes less clear. One has to keep in mind that the Eddington rate has been derived for a perfectly spherically symmetric situation. The situation in accretion disks, however is rather different from such an ideal case. While at rates close to the (spherical) Eddington limit, accretion disks in all likelihood are no longer geometrically thin (slim disks, see, e.g., Collin & Kawaguchi 2004), their deviation from sphericity is even more important. This can lead to simple geometrical effects allowing for super-Eddington accretion rates (Heinzeller and Duschl, in prep.), but also to instabilities in the structure of the disks, for instance the photon bubble instability as discussed by Begelman (2002), and in all likelihood to combinations of such geometrical and physical effects (e.g., Okuda et al. 2005).
An additional potentially relevant difference between stellar mass and super-massive black hole accretors may be the mass of the disk. While in the stellar case the masses of the accretion disk are certainly well below that of the accreting body, this is considerably less clear for the AGN case, and may be even different for different AGN types. In the innermost disk regions, selfgravity certainly plays no role. Already at moderately large radii, however, this may change. With such changes, long-term modifications of the mass supply rate for the inner regions comes along. Different levels of selfgravity in the disks may very well lead to differences in the accretion process.
Therefore, different accretion modes have the potential to explain the observed differences in radio loudness between Galactic and AGN sources on the one side, and among the different AGN classes on the other side. Before one, however, can unambiguously identify whether, and if so, which aspect of the accretion mode gives rise to the differences, a much better understanding is required of how these different accretion modes relate to jet formation.
5.7.3 Black hole spin
Another parameter which could account for radio loudness but at the same time leave optical emission-line parameters and correlations mostly unaffected, is black hole spin. It is expected to have a strong direct influence on radio jet emission if the radio jet is powered by the extraction of black hole rotational energy (Blandford & Znajek 1977), or may indirectly be relevant if the jet is powered by the rotational energy of the inner disk (Blandford & Payne 1982).
If, indeed, rapidly spinning black holes are responsible for radio loudness of NLS1s and quasars, why then would NLS1s on average harbor less rapidly spinning black holes than Seyferts (to account for the lower frequency of radio-loudness among NLS1s)? Both BH-BH mergers and accretion will affect BH spin (e.g., Merritt 2002, Hughes & Blandford 2003, Volonteri et al. 2005). It has been suggested that NLS1 galaxies are less evolved than Seyferts in that their black holes are still in the process of growing by rapid accretion (e.g., Mathur 2001, Grupe & Mathur 2004, Botte et al. 2004, Mathur & Grupe 2005). Since accretion processes are known to be very efficient in spinning up the accreting black holes (Volonteri et al. 2005, and references therein) one then indeed expects that the final stages, ‘normal’ Seyferts and quasars, should have, on average, more rapidly spinning black holes than the NLS1s.
At the same time, spin cannot be the only quantity making objects radio-loud, else all quasars must be more radio-loud than NLS1s. Thus, spin would be a necessary but not sufficient condition. If, indeed, spin plays a role, then the few radio-loud NLS1s should be those with the more rapidly spinning BHs, already more evolved than others. One may thus expect that they lie closer to the black-hole mass – velocity dispersion () relation of Seyfert galaxies than other NLS1s. We have plotted the objects of our sample in the plane of Mathur & Grupe (2004; their Fig. 1) and indeed find that they are systematically closer to, or on, the relation followed by Seyferts.
Future X-ray observations of the iron line may help to search for signs of more rapidly spinning BHs in the radio-loud NLS1s, but less rapidly spinning BHs in the NLS1 population as a whole.
In summary, while we cannot fully exclude beaming to operate in all sources, the source properties are generally such that this mechanism is not favored (with the three exceptions mentioned above). Accretion mode, possibly in combination with spin, is a possibility.
5.8 Future work
The results of this study lead us to identify a number of important follow-up observations:
High quality optical spectra of the 11 radio-loudest objects of our sample do not yet exist, or are not yet published. Spectra of high resolution and S/N would allow a search for similarities/differences in emission lines between radio-loud and radio-quiet NLS1s the same way it is now rigorously done for broad- and narrow-line objects (e.g., Veron et al. 2001, Sulentic et al. 2002, Bachev et al. 2004). Especially important is a reliable decomposition of the faint Balmer lines like H and H into broad and narrow component, and deblending from [OIII]4363, such that extinction measurements become possible for those objects which have H redshifted out of the observable optical band. This knowledge is essential for the assessment of radio loudness (in reddened objects, radio loudness is overpredicted), and for black hole mass calculation.
Good optical spectra of the radio-loud and almost radio-loud NLS1s, and a comparison sample of quasars, will enable BH mass and bulge mass estimates using H and [OIII] or low-ionization lines, and ideally also absorption features (e.g., Grupe & Mathur 2004, Botte et al. 2004, Greene & Ho 2005) which will then allow us to test more rigorously whether claimed systematic trends of higher black hole masses in radio-loud vs. radio-quiet quasars extend to the NLS1 population.
X-ray observations of all sources are needed in order to measure accurate spectral shapes, few of them available so far, and to determine the amount of absorption. Deeper X-ray observations are required to measure iron-line profiles in search for (less) rapidly spinning black holes in NLS1 galaxies.
How much of the scatter in radio spectral index of the NLS1s is real and how much is caused by the non-simultaneity of the data, should be tested with simultaneous radio observations at different frequencies and monitoring for variability. The latter will also constrain the number of beamed sources. Radio observations of higher spatial resolution should be carried out in order to confirm the compactness of the NLS1s of our sample and thus also to check how far the similarity with known CSS sources goes.
Larger samples of AGN with a ‘relaxed’ NLS1 classification criterion where the cut in FWHM is dependent on luminosity will enable us to address the question whether the fraction of radio-loud NLS1s systematically changes (increases) with FWHMHβ and whether (radio-loud) NLS1s with higher BH masses emerge. The largest sample to date of NLS1s from the SDSS data base, but still using an FWHM cut-off, is presently being compiled by Zhou et al. (priv. comm.).
Apart from future multi-wavelength follow-up observations of the small sample of radio-loud NLS1s presented here, Virtual Observatory tools will become more and more important to study trends throughout the whole NLS1 and AGN population, since they will allow the extraction of multi-wavelength information from existing data bases in a homogeneous way which then enables us to study bulk properties of populations on the one hand, and to identify exceptional individual sources on the other hand.
Comparison with the work of Whalen et al. (2006): While our paper was being refereed, a paper by Whalen et al. (2006) appeared on the astro-ph preprint server. These authors present optical follow-up spectroscopy of FIRST radio sources identified as NLS1 galaxies, including 16 candidate radio-loud NLS1s (50% of their sample has radio powers W/Hz). Their findings are consistent with ours in that both works do not find strong correlations between optical line parameters and radio-loudness, and black holes masses show similar mass ranges. Being a radio-selected sample, the fraction of radio-loud NLS1 galaxies is higher in the sample of Whalen et al.; on the other hand a number of the sources of Whalen et al. are below a radio power of W/Hz, and we note that sources significantly above a radio index =1000 are missing in both studies.
6 Summary and conclusions
We have presented a study of the radio properties of NLS1 galaxies, with emphasis on the search for radio-loud NLS1s. The results of this study can be summarized as follows:
11 candidate radio-loud NLS1 galaxies were identified, significantly increasing the number of known radio-loud NLS1s. These are radio loud judged on both, radio index and radio power. Radio-detected NLS1s cover several orders of magnitude in radio index . The distribution is rather smooth below .
The fraction of detected radio-loud NLS1s is 7%, smaller than the fraction of radio-louds among quasars. Only 2-3% of the NLS1s exceed a radio index (SDSSJ172206.03+565451.6, SDSSJ094857.3+002225 and possibly the absorbed source TEX11111+329). This could partly, but likely not fully, be a ‘selection effect’ arising from the NLS1 definition as objects with FWHM km/s independent of luminosity.
The radio-loud NLS1s are generally steep spectrum sources and compact. Two have inverted spectra. NVSS and FIRST radio fluxes are consistent with each other in most cases, indicating little variability.
Accretion rate estimates show that most sources likely accrete close to or above the Eddington limit. Black hole masses are generally at the upper end observed in NLS1 galaxies ( M⊙, for objects with optical spectra of good quality), but still small when compared to some samples of radio-loud quasars. In particular, the NLS1s of our sample fill up a previously scarcely populated area of diagrams.
Optical properties of the radio-loud NLS1s are similar to the NLS1 population as a whole. In particular, their FeII and [OIII] emission covers almost the whole range observed in NLS1 galaxies. Their radio properties, however, extend the range of radio-loud objects to those with small FWHMHβ. The fraction of [OIII] ‘blue-winglers’ is high. X-ray properties are consistent with the NLS1 population as a whole, with and erg/s; some sources highly variable, others constant throughout the observation interval.
The starburst contribution to the radio emission, estimated for those sources with IRAS 60 detections, is small or completely negligible. The AGN is expected to dominate any starburst in radio emission by factors 5–115.
We do not find indications for beaming in most of the sources, arguing against the explanation that we see intrinsically radio quiet but beamed sources. Accretion mode and spin might be factors to account for the lower frequency of radio-loud NLS1 galaxies than quasars.
Future studies of radio-loud NLS1s and follow-up observations of the sample presented here will provide important information on distinguishing between different NLS1 models, on (the existence of) the radio-loud radio-quiet dichotomy of AGN, and on accretion disk - jet models.
References
- Abazajian et al. (05) Abazajian, K., Adelman-McCarthy, J.K., Agüeros, M.A., et al., 2005, AJ, 129, 1755
- (2) Adorf, H.-M., Lemson, G., Voges, W., Enke, H., & Steinmetz, M., 2003, in: Proc. ADASS XIII, F. Ochsenbein, R. Allen, D. Egret (eds), ASP Conf. Ser. 314, 281
- Adorf et al. (05) Adorf, H.-M., Lemson, G., & Voges, W., 2005, in: Proc. ADASS XV, C. Gabriel, C. Arviset, D. Ponz, E. Solano (eds), ASP Conf. Ser., in press
- Antonucci (93) Antonucci, R., 1993, ARA&A, 31, 473
- Bachev et al. (2004) Bachev, R., Marziani, P., Sulentic, J.W., et al., 2004, ApJ, 617, 171
- Bade et al. (1995) Bade, N., Fink, H.H., Engels, D., et al., 1995, A&AS, 110, 469
- (7) Barvainis, R., Lonsdale, C., & Antonucci, R., 1996, AJ, 111, 1431
- (8) Bauer, F.E., Condon, J.J., Thuan, T.X., & Broderick, J.J., 2000, ApJS, 129, 547
- Becker et al. (1995) Becker, R.H., White, R.L., & Helfand, D.J., 1995, ApJ, 450, 559
- Beckert and Duschl (2002) Beckert, T., Duschl, W.J., 2002, A&A, 387, 422
- Begelman (2002) Begelman, M.C., 2002, ApJ, 568, L97
- Best et al. (05) Best, P.N., Kauffmann, G., Heckman, T.M., et al., 2005, MNRAS, in press [astro-ph/0506269]
- (13) Bian, W., Zhao, Y., 2004, MNRAS, 352, 823
- Bicay et al. (2000) Bicay, M.D., Stepanian, J.A., Chavushyan, V.H., 2000, et al., A&AS, 147, 169
- Blandford (2000) Blandford, R., 2000, Roy. Soc. London Philosophical Transactions A, 358, 811
- (16) Blandford, R., & Payne, D.G., 1982, MNRAS, 199, 883
- (17) Blandford, R., & Znajek, R.L., 1977, MNRAS, 179, 433
- (18) Boller, T., Brandt, W.N., & Fink, H.H., 1996, A&A, 305, 53
- Boroson and Green (1992) Boroson, T.A., & Green, R.F., 1992, ApJS, 80, 109
- Boroson (2002) Boroson, T.A., 2002, ApJ, 565, 78
- Botte et al. (04) Botte, V., Ciroi, S., Rafanelli, P., & Di Mille, F., 2004, AJ, 127, 3168
- Brinkmann et al. (1994) Brinkmann, W., & Siebert, J., 1994, A&A, 285, 812
- Brinkmann et al. (2004) Brinkmann, W., Arevalo, P., Gliozzi, M., & Ferrero, E., 2004, A&A, 415, 959
- Celotti and Blandford (2001) Celotti, A., & Blandford, R.D., 2001, in: Black Holes in Binaries and Galactic Nuclei, L. Kaper, E.P.J. van den Heuvel, P.A. Woudt (eds), ESO Astrophysics Symposia, 206 (Springer-Verlag)
- Cirasuolo et al. (2003) Cirasuolo, M., Magliocchetti, M., Celotti A., & Danese, L., 2003, MNRAS, 341, 993
- Collin et al. (04) Collin, S., & Kawaguchi, T., 2004, A&A, 426, 797
- Condon et al. (1998) Condon, J.J., Cotton, D., Greissen, E.W., et al., 1998, AJ, 115, 1693
- Czerny et al. (1997) Czerny, B., Witt, H.J., & Zycki, P., 1997, in: The Transparent Universe, Proceedings of the 2nd INTEGRAL Workshop, C. Winkler, T. J.-L. Courvoisier, and P. Durouchoux (eds), ESA, p.397
- (29) de Breuck, C., Tang, Y., de Bruyn, A.G., Rottgering, H., & van Breugel, W., 2002, A&A, 394, 59
- (30) de Bruyn G., Miley G., Rengelink R., et al., 1998, Westerbork Northern Sky Survey (WENSS), http://www.strw.leidenuniv.nl/wenss/
- Devroye et al. (96) Devroye, L., Gyorfi, L., Lugosi, G., 1996, ”A Probabilistic Theory of Pattern Recognition”, Springer
- Elizalde and Steiner (1994) Elizalde, F., & Steiner, J.E., 1994, MNRAS, 268, L47
- Elvis (2000) Elvis, M., 2000, ApJ, 545, 63
- Elvis et al. (1992) Elvis, M., Plummer, D., Schachter, J., & Fabbiano, G., 1992, ApJS, 80, 257
- Elvis et al. (1994) Elvis, M., Wilkes, B.J., McDowell, J.C., et al., 1994, ApJS, 95, 1
- Falcke et al (96) Falcke, H., Sherwood, W., & Patnaik, A.R., 1996, ApJ, 471, 106
- Falcone et al. (2004) Falcone, A.D., Bond, I.H., Boyle, P.J., et al., 2004, ApJ, 613, 710
- Fields et al. (05) Fields, D., Mathur, S., Pogge, R., et al., 2005, ApJ, 634, 928
- Forster et al. (2001) Forster, K., Green, P.J., Aldcroft, T.L., et al. 2001, ApJS, 134, 35
- Gierlinski et al. (2004) Gierlinski, M., Done, D., 2004, MNRAS, 349, L7
- Giommi et al. (1991) Giommi, P., Tagliaferri, G., Beuermann, K., et al., 1991, ApJ, 378, 77
- Gliozzi et al. (2001) Gliozzi, M., Brinkmann, W., O’Brien, P.T., et al., 2001, A&A, 365, L128
- Greene and Ho (2005) Greene, J.E., & Ho, L.C., 2005, ApJ, 627, 721
- Greene et al. (2006) Greene, J.E., Ho, L.C., & Ulvestad J.S., 2006, ApJ, 636, 56
- (45) Gregory, P.C., & Condon, J.J., 1991, ApJS, 75, 1011
- Griffith et al. (04) Griffith, M.R., Wright, A.E., Burke, B.F., & Ekers, R.D., 1994, ApJS, 90, 179
- (47) Grupe, D., Leighly, K.M., Thomas, H.-C., & Laurent-Muehleisen, S.A., 2000, A&A, 356, 11
- Grupe et al. (04) Grupe, D., 2004, AJ, 127, 1799
- Grupe et al. (04) Grupe, D., Wills, B.J., Leighly, K.M., & Meusinger, H., 2004, AJ, 127, 156
- Grupe and Mathur (04) Grupe, D., & Mathur, S., 2004, ApJ, 606, L41
- Halpern and Moran (1998) Halpern, J.P., & Moran, E.C., 1998, ApJ, 494, 194
- Helfand et al. (2001) Helfand, D., Stone, R.P.S., Wilman, B., et al., 2001, AJ, 121, 1872
- Hooper et al. (1995) Hooper E.J., Impey, C.D., Foltz, C.B., & Hewett, P.C., 1995, ApJ, 445, 62
- Hughes and Blandford (2003) Hughes, S.A., & Blandford, R.D., 2003, ApJ, 585, L101
- Ivezic et al. (2002) Ivezic, Z., Menou, K., Knapp, G.R., et al., 2002, AJ, 124, 2364
- Jackson and Browne (1991) Jackson, N., & Browne, I.W.A., 1991, MNRAS, 250, 422
- Joly (1990) Joly, M., 1991, A&A, 242, 49
- Kaspi et al. (2005) Kaspi, S., Maoz, D., Netzer, H., Peterson, B., Vestergaard, M., & Jannuzi, B.T., 2005, ApJ, 629, 61
- Kawaguchi (2003) Kawaguchi, T., 2003, ApJ, 593, 69
- Kay et al. (1999) Kay, L.E., Magalhaes, A.M., Elizalde, F., & Rodrigues, C., 1999, ApJ, 518, 219
- Kellermann et al. (1989) Kellermann, K.I., Sramek, R., Schmidt, M., Shaffer, D.B., & Green, R., 1989, AJ, 98, 1195
- Komossa et al. (00) Komossa, S., & Meerschweinchen, J., 2000, A&A, 354, 411
- Komossa and Mathur (01) Komossa, S., & Mathur, S., 2001, A&A, 374, 914
- Komossa et al. (2006) Komossa, S., Voges, W., Adorf, H.-M., Xu, D., Mathur, S., & Anderson, S.F., 2006, ApJ 639, 710
- Kriss (1994) Kriss, G.A., 1994, in: ASP Conf. Ser. 61, ADASS III, eds: D.R. Crabtree, R.J. Hanisch & J. Barnes (San Francisco: ASP), 437
- La Franca et al. (1994) La Franca, F., Gregorini, L., Cristiani, S., de Ruiter, H., & Owen, F., 1994, AJ, 108, 1548
- Laor (1997) Laor, A., et al., 1997, ApJ, 477, 93
- Laor (2000) Laor, A., 2000, ApJ, 543, L111
- Lacy et al. (2001) Lacy, M., Laurent-Muehleisen, S.A., Ridgway, S.E., et al., 2001, ApJ, 551, L17
- Laurent et al. (1997) Laurent-Muehleisen, S.A., Kollgaard, R.I., Ryan, P.J., et al., 1997, A&AS, 122, 235
- Lawrence et al. (97) Lawrence, A., Elvis, M., Wilkes, B.J., McHardy, I., & Brandt, W.N. 1997, MNRAS, 285, 879
- Leighly (1999) Leighly, K., 1999, ApJS, 125, 297
- Leipski (2005) Leipski, C., & Bennert, N., 2006, A&A, in press [astro-ph/0511280]
- Lipari et al. (2003) Lipari, S., Terlevich, R., Diaz, R.J., et al., 2003, MNRAS, 340, 289
- Liu et al. (2005) Liu, Y., Jiang, D.R., & Gu, M.F., 2006, ApJ 637, 669
- Maccarone et al. (03) Maccarone, T.J., Gallo, E., & Fender, R., 2003, MNRAS, 345, L19
- Maccarone et al. (05) Maccarone, T.J., Miller-Jones, J.C.A., Fender, R.P., & Pooley, G.G., 2005, A&A, 433, 531
- (78) Madau, P., 1988, ApJ, 327, 116
- (79) Mahalanobis, P.C., 1936, Proceedings National Institute of Sciences of India, 2, 49
- Marecki et al. (05) Marecki, A., Kunert-Bajraszewska, M., & Spencer, R.E., 2005, A&A, in press [astro-ph/0512034]
- Marziani et al. (2001) Marziani, P., Sulentic, J.W., Zwitter,T., Dultzin-Hacyan D., & Calvani, M., 2001, ApJ, 558, 560
- Mathur, S., (2000) Mathur, S., 2000, MNRAS, 314, L17
- Mathur, S., (2001) Mathur, S., 2001, New Astronomy, 6, 321
- Mathur, S., et al. (05) Mathur S., & Grupe, D., 2005, A&A, 432, 463
- Mauch et al. (2003) Mauch, T, Murphy, T., Buttery, H.J., et al., 2003, MNRAS, 342, 1117
- (86) McLure, R.J., & Jarvis, M.J., 2004, MNRAS, 353, L45
- Meier (2003) Meier, D., 2003, New Astronomy Reviews, 47, 667
- Merritt (2002) Merritt, D., 2002, ApJ, 568, 998
- Metcalf et al. (2006) Metcalf, R.B., & Magliocchetti, M., 2006, MNRAS, 365, 101
- Miller et al. (1990) Miller, L., Peacock, J.A., & Mead, A.R.G., 1990, MNRAS, 244, 207
- Miller et al. (1993) Miller P., Rawlings, S., & Saunders, R., 1993, MNRAS, 263, 425
- Monet et al. (2003) Monet, D.G., Levine, S.E., Canzian, B., et al., 2003, AJ, 125, 984
- Moran (2000) Moran, E., 2000, New Astronomy Reviews, 44, 527
- Nagao et al. (02) Nagao, T., Murayama, T., Shioya, & Y. Taniguchi, Y., 2002, ApJ, 575, 721
- Nagar et al. (2003) Nagar, N.M., Wilson, A.S., Falcke, H., Veilleux, S., & Maiolino, R., 2003, A&A, 409, 115
- Narayan et al. (1998) Narayan, R., Mahadevan, R., Grindlay, J.E., Popham, R.G., & Gammie, C., 1998, ApJ, 492, 554
- OBrien et al. (01) O’Brien, P.T., Reeves, J.N., Turner, M.J.L., et al., 2001, A&A, 365, L122
- Okuda et al. (2005) Okuda, T., Teresi, V., Toscano, E., Molteni, D., 2005, MNRAS, 357, 295
- Oshlack et al. (01) Oshlack, A.Y.K.N., Webster, R.L., & Whiting, M.T., 2001, ApJ, 558, 578
- Oshlack et al. (02) Oshlack, A.Y.K.N., Webster, R.L., & Whiting, M.T., 2002, ApJ, 576, 81
- Osterbrock and Pogge (1985) Osterbrock, D.E., & Rogge, R., 1985, ApJ, 297, 166
- Padovani et al. (2002) Padovani, P., Costamante, L., Ghisellini, G., Giommi, & P., Perlman, E., 2002, ApJ, 581, 895
- Peacock and Wall (1982) Peacock, J.P., & Wall, J.V., 1982, MNRAS, 198, 843
- Peterson et al. (2000) Peterson, B.M., McHardy, I.M., Wilkes, B.J., et al., 2000, ApJ, 542, 161
- Peterson et al. (2004) Peterson, B.M., Ferrarese, L., Gilbert, K.M., et al., 2004, ApJ, 613, 682
- Pounds et al. (95) Pounds, K., Done, C., & Osborne, J.P., 1995, MNRAS, 277, L5
- Puchnarewicz et al. (1992) Puchnarewicz, E.M., Mason, K.O., Cordova F.A., et al., 1992, MNRAS, 256, 589
- Puchnarewicz et al. (1992) Puchnarewicz, E.M., Mason, K.O., & Cordova F.A., 1994, MNRAS, 270, 663
- Remillard et al. (86) Remillard, R.A., Bradt, H.V., Buckley, D.A.H., et al., 1986, ApJ, 301, 742
- Remillard et al (91) Remillard, R.A., Grossman, B., Bradt, H.V., et al., 1991, Nature, 350, 589
- Schlegel et al. (1998) Schlegel, D.J., Finkbeiner, D.P. & Davis, M., 1998, ApJ, 500, 525
- Schwope et al. (00) Schwope, A.D., Hasinger, G., Lehmann, I., et al., 2000, Astronomische Nachrichten, 321, 1
- Shemmer and Netzer (02) Shemmer, O., & Netzer, H., 2002, ApJ, 567, L19
- Shemmer et al. (2004) Shemmer, O., Netzer, H., Maiolino, R., et al., 2004, ApJ, 614, 547
- Shields et al. (2003) Shields, G., Gebhardt, K., Salviander, S., et al., 2003, ApJ, 583
- Siebert et al (99) Siebert, J., Leighly, K.M., Laurent-Muehleisen, S.A., et al., 1999, A&A, 348, 678
- (117) Simkin, M.V., & Roychowdhury, V.P., 2003, Complex Systems 14, 269
- Smith et al. (1998) Smith, D.A., Herter, T., & Haynes, M.P., 1998, ApJ, 494, 150
- Smith, Robinson, et al. (2004) Smith, J.E., Robinson, A., Young, S., Axon, D.J., & Corbett, E.A., 2004, MNRAS, 359, 846
- Stepanian et al. (03) Stepanian, J.A., Benitez, E., Krongold, Y., et al., 2003, ApJ, 588, 746
- Sulentic et al. (2002) Sulentic, J.W., Marziani, P., Zamanov, R., et al., 2002, ApJ, 566, L71
- Sulentic et al. (2003) Sulentic, J.W., Zamfir, S., Marziani P., et al., 2003, ApJ, 597, L17
- (123) Urry, C.M., & Padovani, P., 1995, PASP, 107, 803
- Ulvestad et al. (95) Ulvestad, J.S., Antonucci, R.R.J., & Goodrich, R.W., 1995 AJ, 109, 81
- Vanden Berk et al. (01) Vanden Berk, D.E., Richards, G.T., Bauer, A., et al., 2001, AJ, 122, 549
- Vaughan et al. (1999) Vaughan, S., Reeves, J., Warwick, R., & Edelson, R., 1999, MNRAS, 309, 113
- (127) Veron-Cetty, M.-P., Veron, P., & Goncalves, A.C. 2001, A&A, 372, 730
- Veron-catalogue (2003) Veron-Cetty, M.-P., & Veron, P., 2003, A&A, 412, 399 (VQC)
- Vestergaard et al. (2000) Vestergaard, M., Wilkes, B.J., & Barthel, P.D., 2000, ApJ, 538, L103
- Visnovsky et al. (1992) Visnovsky, K.L., Impey, C.D., Foltz, C.B., et al., 1992, ApJ, 391, 560
- Voges et al. (1999) Voges, W., Aschenbach, B., Boller, T., et al., 1999, A&A, 349, 389
- Volonteri et al. (2005) Volonteri, M., Madau, P., Quataert, E., & Rees, M.J., 2005, ApJ, 620, 69
- Wandel et al. (1999) Wandel, A., Peterson, B.M., & Malkan, M.A., 1999, ApJ, 526, 579
- Wang et al. (2003) Wang, J.-M., Ho, L.C., & Staubert, R., 2003, A&A, 409, 887
- Wang and Netzer (2003) Wang, J.-M., & Netzer, H., 2003, A&A, 398, 927
- Wang et al. (2004) Wang, J., Wei, J.-Y., & He, X.-T., 2004, Chin. J. Astron. Astrophys., 4, 415
- Wang et al. (1996) Wang, T.G., Brinkmann, W., & Bergeron, J., 1996, A&A, 309, 81
- Wang et al. (2001) Wang, T.G., Matsuoka, M., Kubo, H., Mihara, T., & Negoro, H., 2001, ApJ, 554, 233
- Warner et al. (2004) Warner, C., Hamann, F., & Dietrich, M., 2004, ApJ, 608, 136
- Wei et al. (98) Wei, J.Y., Xu, D.W., Cao. L., Zhao, Y.-H., Hu, J.-Y., & Li, Q.-B., 1998, A&A, 329, 511
- Whalen et al. (2001) Whalen, J., Laurent-Muehleisen, S.A., Moran, E.C., & Becker, R.H., 2001, BAAS 33, 1373
- Whalen et al. (2006) Whalen, D.J., Laurent-Muehleisen, S.A., Moran, E.C., & Becker, R.H., 2006, astro-ph/0601162; to appear in AJ
- White et al. (1997) White, R.L., Becker, R.H., Helfand, D., & Gregg, M.D., 1997, ApJ, 475, 493
- White et al. (2000) White, R.L., Becker, R.H., Gregg, M.D., et al., 2000, ApJS, 126, 133
- Wills et al. (2000) Wills, B., Shang, Z., & Yuan, J.M., 2000, New Astronomy Reviews 44, 511
- Wilson and Colbert (1995) Wilson, A.S., & Colbert, E.J.M., 1995, ApJ, 438, 62
- Wright (1990) Wright, A.E., & Otrupcek, R., 1990, Australia Telescope National Facility, Parkes
- Woo and Urry (2002) Woo, J.-H., & Urry, M.C., 2002, ApJ, 579, 530
- Xu et al. (2003) Xu, D.W., Komossa, S., Wei, J.Y., Qian, Y., & Zheng, X.Z., 2003 ApJ, 590, 73
- Xu et al. (2006) Xu, D., et al., 2006, ApJ, to be submitted
- Ye and Wang (05) Ye, Y.-C., & Wang, D.-X., 2005, MNRAS, 357, 1155
- Yi and Boughn (98) Yi, I., & Boughn, S.P., 1998, ApJ, 499, 198
- York et al. (2000) York, D.G., et al., 2000, AJ, 120, 1579
- Yun et al. (01) Yun, M.S., Reddy, N.A., & Condon, J.J., 2001, ApJ, 554, 803
- Zdziarksi et al. (2003) Zdziarski, A.A., Lubinkski, P., Gilfanov, M., & Revnivtsev, M., 2003, MNRAS, 342, 355
- Zheng et al. (99) Zheng, Z., Wu, H., Mao, S., et al., 1999, A&A, 349, 735
- Zheng et al. (02) Zheng, X.Z., Xia, X.Y., Mao, S., et al., 2002, ApJ, 124, 18
- Zhou et al. (02) Zhou, H.-Y., Wang, T.-G., Zhou, Y.-Y., Li, C., & Dong, X.-B., 2002, ApJ, 581, 96
- Zhou et al. (03) Zhou, H.-Y., Wang, T.-G., Dong, X.-B., Zhou, Y.-Y., & Li, C., 2003, ApJ, 584, 147
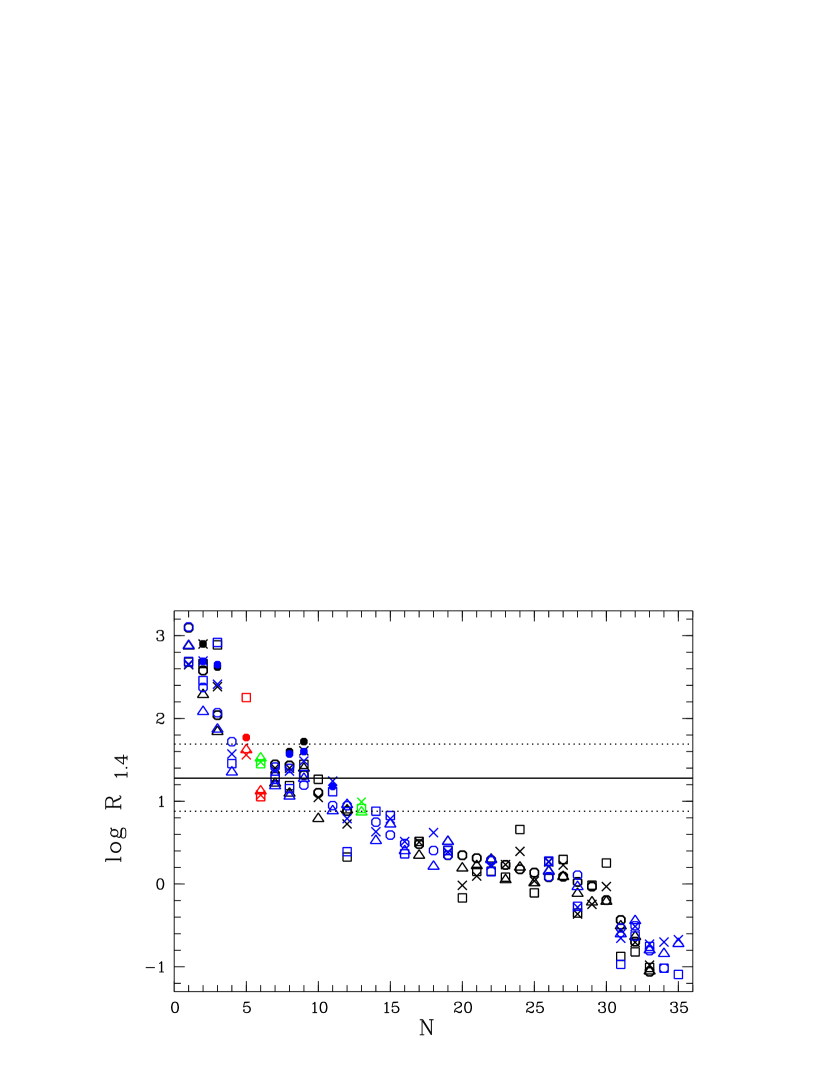
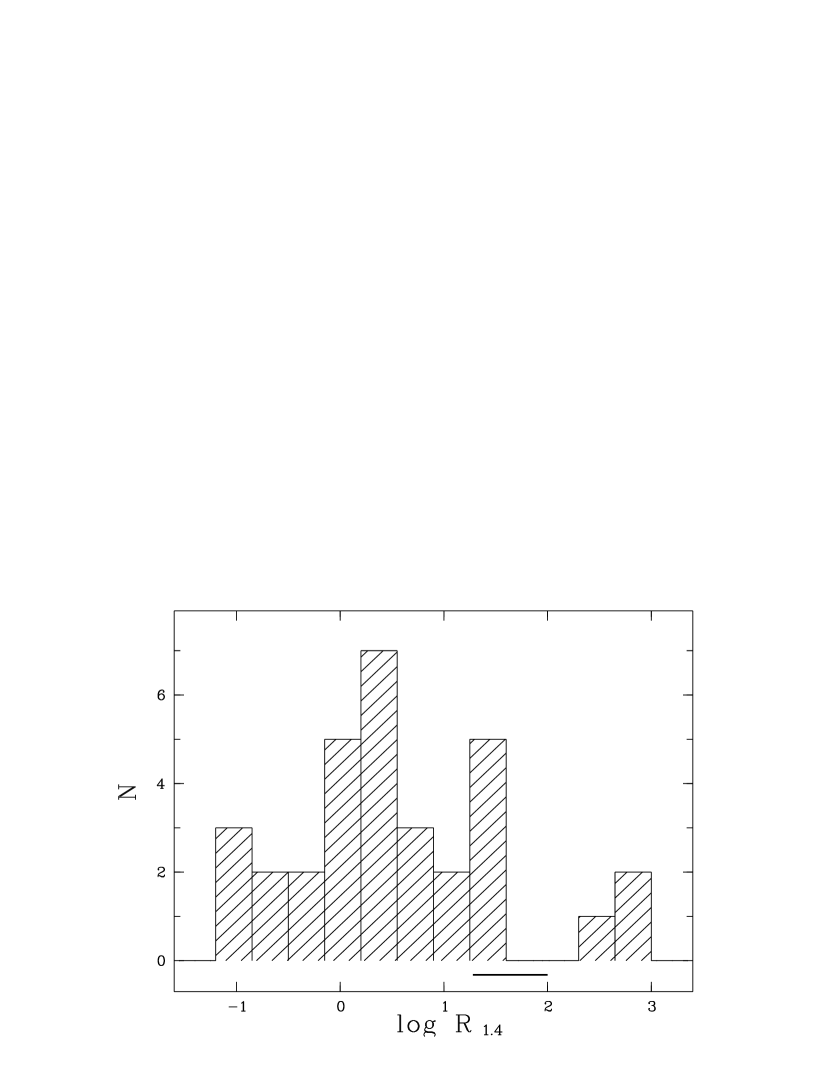
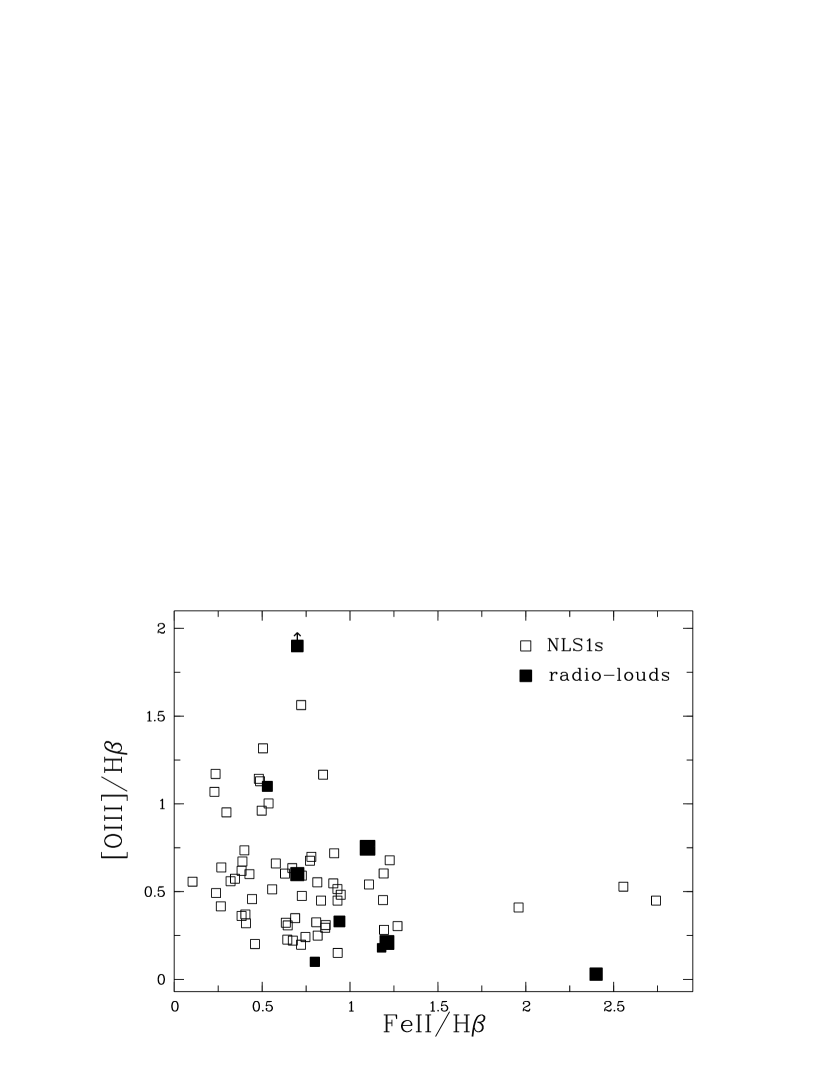
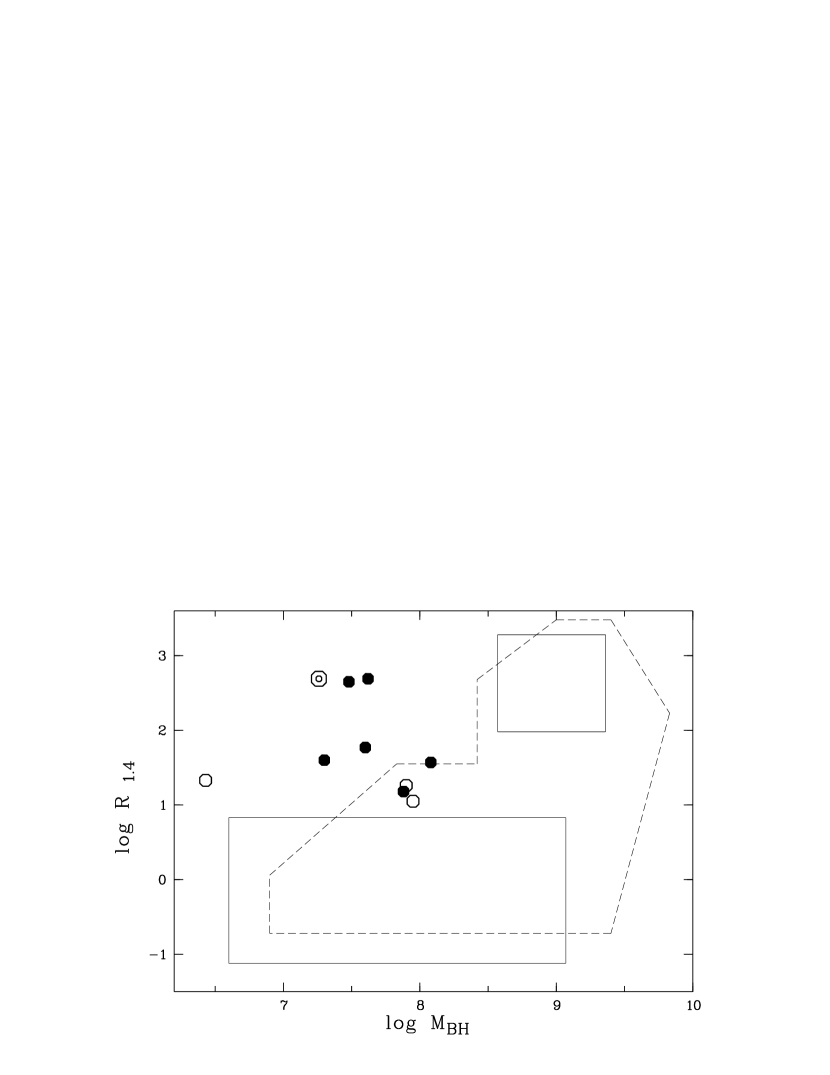
| name | , | comments, references | ||||
| GHz | GHz | |||||
| TEX11111+329 | 0.189 | 1249..445 | 1.4 | 0.33,1.4 | optically absorbed | |
| 1.4,4.85 | ||||||
| 1.4,15 | upper limit at 15 GHz ([1]) | |||||
| SDSSJ094857+002225 | 0.584 | 793..194 | 1.4 | |||
| 1000 | 5 | 0.59 | 2.7,4.85 | [2], variable | ||
| SDSSJ172206+565451 | 0.425 | 773..70 | 1.4 | 0.33,1.4 | [4] | |
| RXJ0134-4258 | 0.237 | 178..36 | 4.85 | 4.85,8.4 | see also [3] | |
| IRAS20181-2244 | 0.185 | 52..22 | 1.4 | 0.35,1.4 | ||
| RXJ16290+4007 | 0.272 | 41..21 | 1.4 | 0.42 | 1.4,4.85 | |
| 68..35 | 4.85 | |||||
| IRAS09426+1929 | 0.284 | 28..16 | 1.4 | |||
| PKS0558-504 | 0.137 | 16..14 | 4.85 | 2.7,4.85 | ||
| 0.84,2.7 | ||||||
| RXJ23149+2243 | 0.168 | 18..8 | 1.4 | |||
| 2E1346+2637 | 0.915 | 18..6 | 1.4 | |||
| SBS1517+520 | 0.371 | 27..12 | 1.4 | |||
| PKS 2004-447 | 0.24 | 6320..1710 | 4.85 | ATCA | [5], variable |
References: [1]: Nagar et al. (2003), [2]: Zhou et al. (2003), [3]: Grupe et al. 2000,
[4]: Komossa et al. 2005, [5]: Oshlack et al. 2001
| name | wHβ | w[OIII] | [OIII] | FeII | H | CR | ref | |
| SDSSJ094857+002225 | 1420/ 960/1710+w | 4002 | 0.2 | 1.3 | - | 0.04 | 2.2 | [1] |
| SDSSJ172206+565451 | 1580/1490/1990+w[OIII] | 490 | 0.6 | 0.7 | - | 0.08 | [1],[6] | |
| RXJ0134-4258 | 930/1040/1860+w[OIII] | 510 | 0.04 | 3.2 | 3.4 | 0.20 | 2.24 | [1] |
| RXJ16290+4007 | 1260/1290/1800+w[OIII] | 310 | 0.4 | 1.1 | 3.3 | 0.83 | 3.0 | [1] |
| RXJ23149+2243 | 1670/1630/2680+w[OIII] | 6203 | 0.2 | 1.4 | - | 0.11 | 1.9 | [1] |
| SBS1517+520 | 3220/2030/3810+w[OIII] | 1140 | 1.1 | 0.5 | - | 0.015 | 1.1 | [1] |
| TEX11111+329 | 1980 | 1480 | 0.75 | 1.1 | 0.04 | - | [2] | |
| IRAS09426+1929 | 2000 | - | - | - | - | 0.03 | - | |
| PKS0558-504 | 1500 | - | 0.1 | 1.56∗ | - | 4.20 | 2.8 | [3] |
| 2E1346+2637 | 1840 | 11302 | - | 1.0 | - | 0.08 | 3.4 | [4] |
| IRAS 20181-2244 | 460 | 695 | 3.4 | 0.7 | 6.7 | 0.04 | 2.6 | [5] |
1Width of narrow component fixed to [OII]3227 since [OIII]5007 is too weak; 2the reported FWHM is that of [OII] rather than [OIII] (in case of 2E1346+2637 the [OII] width is not de-convolved from the instrumental profile). 3The [OIII]profile has a very strong and broad blue wing. The FWHM reported here is that of the narrow core of the line only. 4During the RASS, the spectrum was significantly steeper ().
∗Sum of both FeII complexes.
References: [1]: this paper, [2]: Zheng et al. 2002, [3]: Remillard et al. 1986, [4]: Puchnarewicz et al. 1996, [5]: Halpern & Moran 1998, [6]: Komossa et al. 2005
| name | 10/ | comments | |
| M⊙ | |||
| SDSSJ094857+002225 | 4 107 | 4.5 | source might be beamed; see also [1] |
| SDSSJ172206+565451 | 3 107 | 3 | |
| RXJ0134-4258 | 4 107 | 1 | |
| RXJ16290+4007 | 2 107 | 7 | source might be beamed |
| SBS1517+520 | 1 108 | 0.07 | likely X-ray absorbed / is lower limit |
| RXJ2314+2243 | 8 107 | 0.2 | |
| PKS0558-504 | 9 107 | 7 | see also [2] |
| TEX11111+329 | 2 107 | - | likely optically absorbed |
| IRAS09426+1929 | - | FWHMHβ2000 km/s assumed; probably optically absorbed | |
| 2E1346+2637 | 8 107 | 4 | |
| IRAS 20181-2244 | 3 106 | 6 |
[1]: Zhou et al. (2003), [2]: Wang et al. 2001