Quasar Microlensing: when compact masses mimic smooth matter
Abstract
The magnification induced by gravitational microlensing is sensitive to the size of a source relative to the Einstein radius, the natural microlensing scale length. This paper investigates the effect of source size in the case where the microlensing masses are distributed with a bimodal mass function, with solar mass stars representing the normal stellar masses, and smaller masses (down to M⊙) representing a dark matter component. It is found that there exists a critical regime where the dark matter is initially seen as individual compact masses, but with an increasing source size the compact dark matter acts as a smooth mass component. This study reveals that interpretation of microlensing light curves, especially claims of small mass dark matter lenses embedded in an overall stellar population, must consider the important influence of the size of the source.
Subject headings:
gravitational lensing - microlensing - dark matter halos1. Introduction
As the light from a distant source shines through a foreground galaxy, the gravitational lensing effect of the individual stars within the galaxy can induce rapid fluctuations in the apparent brightness of the source (Paczynski, 1986). Since the detection of the first lensing induced variability, seen in the quadruply imaged quasar Q2237+0305 (Irwin et al., 1989; Corrigan et al., 1991), there has been intense theoretical study of this gravitational microlensing, revealing that the degree of brightness fluctuations is strongly dependent upon the size of the source being lensed (Kayser et al., 1986; Wambsganss et al., 1990; Wambsganss & Paczynski, 1991) and the mass function of the lensing objects (Lewis & Irwin, 1996; Wyithe & Turner, 2001), potentially providing a useful probe of both. Further studies have scrutinized the influence of source size and shape (Refsdal & Stabell, 1991, 1993, 1997; Agol, 2003; Mortonson et al., 2005), and more recent programs with dedicated monitoring programs (Woźniak et al., 2000; Alcalde et al., 2002; Ullán et al., 2003) have finally resulted in high quality microlensing light curves that can be compared directly with theoretical models (Wyithe et al., 2000; Kochanek, 2004).
More recently, gravitational microlensing has been proposed as an explanation of the anomalous flux ratios seen in multiply imaged quasars, with the addition of smoothly distributed dark matter broadening the width of the magnification probability distribution (Schechter & Wambsganss, 2002). This result appears somewhat surprising given a conjecture that has existed for a number of years in microlensing studies, namely that the shape of a magnification probability distribution should be independent of the mass function of the microlensing masses (Wambsganss, 1992; Lewis & Irwin, 1996); the smooth matter limit is approached as the mass of the individual objects is decreased, but the surface mass density remains the same. Clearly, the significant differences seen in the magnification probability distributions with smooth and compact matter violates this conjecture, a position recently confirmed by Schechter et al. (2004).
The fall of the microlensing conjecture therefore implies that there is a fundamental difference in the action of compact masses as opposed to smoothly distributed mass. But can compact masses appear as smooth matter to a source? It is well known that increasing the size of a microlensing source smooths out the variability of the light curve, but does this imply that to a large source, a population of small masses appears as smooth matter? While this situation was not examined in the work of Schechter et al. (2004), it existence means that the breakdown of the microlensing conjecture is further blurred by the size of the source under consideration. Studying this regime, therefore, is the goal of this paper. In Section 2, the numerical approach is outlined, while Section 3 discusses the influence of a range of source sizes and compares the resulting properties of the magnification maps. In Sections 4 and 5, the implications of this study and the conclusions are respectively presented.
2. Approach
In studying the influence of gravitational microlensing, this study employs the backwards ray tracing algorithm of Kayser et al. (1986) and Wambsganss (1992), whereby a large number of rays are fired through a field of microlensing masses and collected to form a magnification map over the source plane. The important length scale for gravitational microlensing is the Einstein radius in the source plane, given by
where are angular diameter distances between the observer (), lens () and source () respectively and typically this scale is pc for cosmological circumstances (e.g. Lewis & Ibata, 1998). As well as the mass function of the microlensing bodies, other parameters need to be specified, including the normalized surface mass density () which may be composed of compact and smooth masses, and a shear term () which describes the global asymmetric gravitational lensing influence of the overall galactic/intracluster mass distribution. Given the potential parameter space, a comprehensive study of potential microlensing configurations is beyond the scope of this paper. As a first step, a representative model was chosen with a total surface mass density of and global shear of of . Each simulation covers an area of Einstein radii for a solar mass star and consists of pixels.
A fiducial model was chosen in which half the surface mass density is in the form of solar mass stars, while the remaining mass is in the form of smoothly distributed matter. In addition to this, 43 additional simulations were undertaken. Again, half the mass was in the form of solar mass stars, while the remainder is also in the form of compact objects, but with progressively smaller masses, with each subsequent dark matter mass being 80% of the proceeding value. The limit of this procedure was compact dark matter masses of M⊙, resulting in a total number of microlensing masses in the simulation exceeding ; it was found that this represented the memory limit of available computational hardware, while greatly increasing the calculation time of the magnification maps, and hence no smaller masses were considered. It is important to note that the locations of the solar mass stars are identical in all simulations.
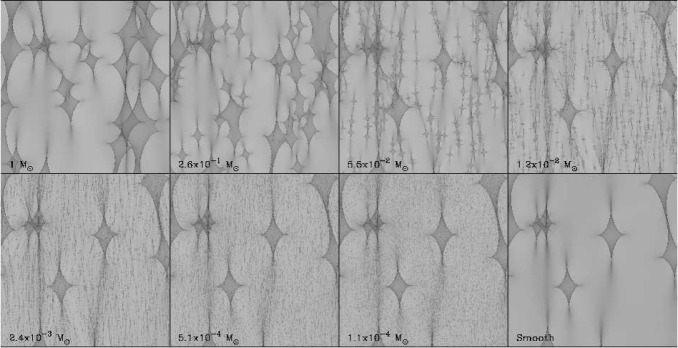
Figure 1 presents examples of the results of this approach, with the upper-left panel representing the magnification maps for the case where half the matter is in the form of smooth matter. For the additional panels in this figure, this smooth matter component has been replaced with compact objects, beginning with M⊙ and continuing down to M⊙. There is a significant difference between the caustic structures apparent in the magnification map for the smooth matter case and that for all the lensing bodies being of 1M⊙. However, as the mass of the compact objects replacing the smooth matter component is reduced, there is a very apparent evolution in the form of the caustic structure; maps appear to possess caustics structure on two distinct scales, corresponding to the two microlensing masses under consideration. For the magnification map with the smallest masses, the large scale caustic structure becomes very similar to that of the case with smooth matter. However, it is also apparent that there is significant small scale structure distributed throughout the map. As will be seen in the next section, while the magnification maps in smooth matter and small mass cases appear similar, the statistical properties, especially the magnification probability distributions, differ markedly.
3. Analysis
To determine the microlensing properties of a particular extended source, the magnification maps must be convolved with the appropriate surface brightness distribution. For the purposes of this study, the source is assumed to possess a Gaussian profile with a characteristic radius. As the source size is increased, the resulting magnification map and magnification probability distribution are compared with those of the solar mass plus smooth matter component.
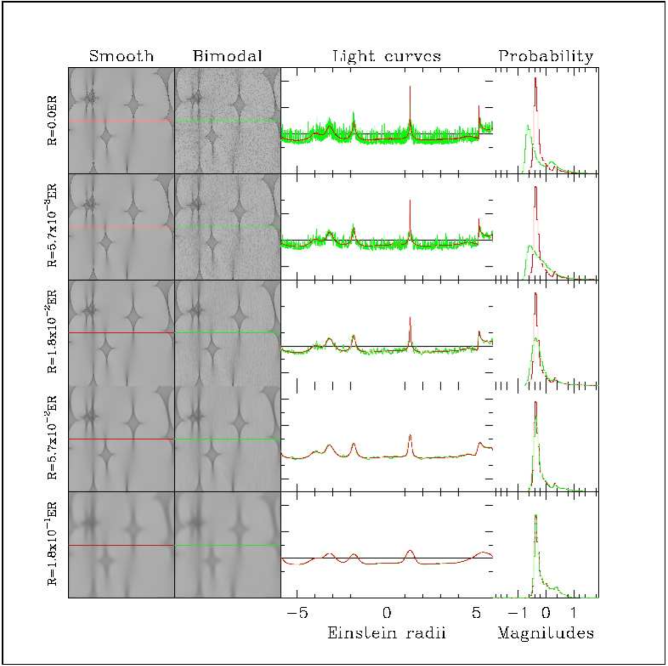
Figure 2 illustrates this procedure for the case where the compact dark matter component have individual masses of M⊙, the smallest masses that are computationally viable at this time. The upper panels present the unconvolved magnification maps for the smooth dark matter (left-hand) and compact dark matter (right-hand)111It should be remembered that these maps, by virtue of the pixelated nature, are implicitly convolved with a source on the scale of a single pixel.. The maps possess similar large scale caustic structure, but clearly the presence of small masses instead of smooth dark matter has introduced significant substructure into the caustic network. Over-plotted on these magnification maps are the resultant light curves of a source passing horizontally across the middle of the two maps and these present quite dramatic behaviour. This is reflected in the magnification probability distributions which are markedly different. Progressing down the page these magnification maps are convolved with larger and larger sources. As the source size increases, the substructure in the magnification map with compact dark matter begins to wash out. This is further reflected in the subsequent light curves, with the degree of variability decreasing. Interestingly, as the source size is increased, the light curves for the compact dark matter and correspondingly convolved smooth matter cases become very similar, again a fact seen in the magnification probability distributions which too become identical. With even larger smoothing, the magnification maps remain identical and hence the compact matter will effectively appear as a smooth dark matter component.

To examine this further, the entire sample was subjected to the same convolution procedure, starting with small Gaussian sources and increasing the radius of the kernel until the magnification probability distributions became similar. In defining this threshold, the binned cumulative magnification distributions were compared, with the difference critical convolution radius defined as being that at which
| (1) |
where and are the cumulative probability distributions; such cumulative distributions ease differences in the differential magnification probability distributions due to noise. The factor represents the fractional difference between the two magnification distribution and for the purposes of this study we choose and as representative values. Of course, the choice of the value of is rather arbitrary and other choices could be made. Hence, the functional form employed here should be viewed as illustrative rather than definitive. The results of this procedure are presented in Figure 3; here the solid line represents the Einstein radius of the smaller mass component, with the points denoting the critical radius as defined by the above criterion. This figure shows that there is a clear trend in this statistic with the critical Gaussian radius increasing in step with the Einstein radius. For and mass scales from M⊙ up to 0.1M⊙, the ratio of these two quantities is (remarkably) constant at (with a couple of discrepant points due to noise spikes in the cumulative distribution delaying convergence), although this ratio drops to for . Note, the arrows denote masses at which smoothing on the scale of less than 5 Einstein radii failed to result in convergence between the two magnification distributions. A reexamination of Figure 1 illustrates that at this high mass end, the caustic structure introduced by the compact masses is similar in scale to the overall caustic network and it is understandable that this structure has not been smoothed out on the scales under consideration.
Returning to Figure 2 it is clear that the third and fourth row of panels straddle this critical region, with magnification distributions for the smaller Gaussian source appearing quite different for the smooth matter and compact cases. Considering the lower panel, and hence larger source, the distributions in both scenarios have become very similar. Notice in this case, even when smoothed with the larger source, the resulting magnification distributions possess significant structure which is reflected in quite dramatic events in the microlensing light curve. Hence the origin of the similarity in the distributions is not due to all of the magnification structure being smoothed out of the microlensing maps. For cases where the difference in mass between the compact dark matter and the solar mass stars is less, then a lot of the structure in the magnification maps is smoothed out, with the resulting light curves possessing very little structure.
3.1. Further simulations
So far this paper has considered a single combination of microlensing optical depth and shear, but how general are the results uncovered thus far? In addressing this question, three more sets of microlensing parameters were employed, namely , and . As with the previous simulations, the source region under consideration covered 122 Einstein radii for a solar mass star and consisted of pixels. Again, in each case, half of the optical depth comprised of solar mass stars while the other half was in the form of smooth matter or compact objects, of mass either or .
Rather than simply repeating the analysis presented in Section 3, a slightly different approach was undertaken. As revealed in Fig. 1, as the masses of the compact objects decreases, the structure in the magnification map tends to that of the smooth matter case, with the smaller masses providing strong, but localized, perturbations, and it is these perturbations which are washed out by convolving with a large enough source; note, however, if the masses of the compact objects are large enough, they produce gross changes into the magnification map such that convolving cannot make the magnification identical to the smooth matter case. Hence, given the small masses considered in this second set of simulations, we would expect that the structures in the compact matter and smooth matter magnification maps should become similar, if convolved with a large enough source.

The analysis procedure again consisted of convolving the smooth matter and compact matter magnification maps with a Gaussian profile. A residual map was constructed by converting the smoothed magnification maps to magnitudes and then subtracting them. These residuals possess a Gaussian-like profile, centred upon zero, and so a residual dispersion, was calculated. The results of this procedure are presented in Figure 4, in which this residual dispersion is plotted against the smoothing radius, for the simulations under consideration. The trend is as expected, with the residual map showing large variations, with at small smoothing radii for , but as the smoothing radius is increased, falls, and hence the convolved magnification maps present similar structure. Also, falls faster for the smaller compact masses, as their magnification structure gets washed out at smaller radii.
Interestingly, the curves for the larger mass compact objects in Fig. 4 clearly show a plateau-like structure, remaining constant over a range of smoothing radii, and then beginning to decrease. Furthermore, the similarity of the curves for both masses considered suggests that the smaller mass component possesses a similar plateau structure, existing in the regime below the minimum smoothing radius we considered. Hence, this again reveals that there appears to be a critical radius below which the influence of the compact matter changes character, effectively representing a smooth mass component. A systematic study of this critical radius for a range of microlensing parameters, and the influence of physical size and structure of the emission regions in quasars, will be the subject of a forthcoming contribution.
4. Implications
One immediate implication of the results presented in this paper is that if the dark matter is in the form of relatively small compact masses, then the resulting statistical properties of a microlensing light curve will be dependent upon the size of the source under consideration. It is important to note that this is somewhat different to the usual size dependence of microlensing statistics where there is a straightforward smoothing of the light curve as the source size is increased, with a resultant narrowing of the magnification probability distribution. Rather, a small source and large source, where relative sizes of small and large can be determined from the relationship presented in Figure 3, will be subject to significantly different magnification patterns and corresponding statistics.
The effect influences the question of how well we can reveal the nature of the dark matter component, if present. In realistic gravitational microlensing scenarios, the distribution of matter in the lensing galaxy will not be a clean two-mass component population, but rather a certain mass function (or even a combination of mass functions). Depending upon the source size for a given system, this mass function will suffer a cutoff point below which observations will not be able to distinguish between smooth and granular matter. This does not mean that small lens masses and large sources combination with a single mass component cannot produce microlensing imprints. Similarly means that for large enough source sizes, sub-Jupiter masses cannot be detected unambiguously and that claims involving planetary and sub-planetary populations that produce light curves fluctuations should be thoroughly justified (i.e. Colley & Schild, 2003). For example, from Fig. 3, for , we see that for microlenses masses of 0.04 M⊙, there are still source sizes (0.7 ER) that make such a low-mass population to appear as a smooth distributed matter component. Considering the corresponding physical length scale in microlensed quasars corresponds to pc (Lewis & Ibata, 1998), it is too large to represent the optical/UV emitting region of quasars. However, for more realistic quasar accretion disk sizes of 0.1 ER, “secondary” populations with masses 10-3 M⊙ will be completely smoothed out. Since the trend in Fig. 3 is quite constant for both considered values of , this approach would also be useful in putting limits to source sizes, though a better understanding of the role of the mass populations is needed.
To some extent, it seems that our results are in contradiction with those obtained by Schechter et al. (2004). In that work, the authors concluded that “the magnification probability distribution for two disparate components is not exactly that of a single component and a smooth component”. The apparent contradiction vanishes when it is realised that Schechter et al. (2004) did not account for the source size effect (or, in other words, they assumed the same pixel size source in their study). Indeed, this is an important issue, because observationally the source effect will be always present. This means that the additional structure in the magnification maps induced by the low-mass component, seen by Schechter et al. (2004), is again blurred out by the source. So, the dependence of the magnification probability on the higher-order moments of the mass distributions is no longer true when introducing the source effect (at least for certain regions of the mass distribution function).
5. Conclusions
This paper has presented a study of the influence of source size on the properties of gravitational microlensing with a bimodal distribution of lensing masses. Given the computational limitations, the study focused upon a set of macrolensing parameters, but considered the influence of compact dark matter on a range of mass scales. It was found that small sources resolved the caustic network produced by the smaller masses, but as the source size was increased this fine scale network becomes washed out. When compared to the scenario where the smaller masses are replaced with an equivalent quantity of smooth matter, it is seen that the light curves of the smallest sources in both circumstances are quite different. As the source size is increased, the light curves, and corresponding magnification probability distributions, in each case become identical, indicating that there is a critical source scale where compact dark matter behaves, in a gravitational lensing sense, like smoothly distributed matter. This critical source scale is dependent upon the ratio of the stellar to dark matter masses, with a relatively linear trend in log-log space (i.e. source sizes smaller than the circles in Figure 3 are small enough to resolve the compact dark matter, and we can expect to see their signature in the microlensing light curve, whereas for source size greater than the circles, this signature will be smoothed out).
The results found in this paper point to another problem concerning magnification probabilities. To what extent magnification distributions are showing valuable information in real gravitational lensed systems? In other words, can we characterize systems according to their magnification distributions? To answer these questions we would need to explore a large range of combinations of and , together with different mass distribution functions; while computationally expensive, we are currently planning the first stages of such an exploration. However, it seems clear that when the source effect is taken into account, the information available from the magnification distributions can be rather poor. Of course, the magnification distributions are only the zeroth level statistic that can be used to examine the influence of gravitational microlensing, but clearly the results presented in this contribution similarly influence higher order temporal statistics that are applied to microlensing light curves.
In closing, this contribution returns to the question of the microlensing conjecture that was discussed earlier. The fall of the conjecture implies that the mass function of the compact objects was potentially amenable to microlensing observations as it is now apparent that this will imprint a signature into any microlensing light curves. However, the issue has been clouded further with the results presented in this paper illustrating that the size of a source being of vital importance when addressing the question of how well the properties of an underlying mass function can be determined. While introducing a mass function expands the potential parameter space enormously, it is important to understand the influence of the source on the values of microlensing statistics and hence future contributions will investigate its role in more general microlensing scenarios.
Acknowledgments
GFL thanks the Selby Trustees for the 2004 Selby Research Award which part funded this project. The anonymous referee is thanked for comments which improved the paper.
References
- Agol (2003) Agol, E. 2003, ApJ, 594, 449
- Alcalde et al. (2002) Alcalde et al. 2002, ApJ, 572, 729
- Colley & Schild (2003) Colley, W. N., & Schild, R. E. 2003, ApJ, 594, 97
- Corrigan et al. (1991) Corrigan, R. T., et al. 1991, AJ, 102, 34
- Irwin et al. (1989) Irwin, M. J., Webster, R. L., Hewett, P. C., Corrigan, R. T., & Jedrzejewski, R. I. 1989, AJ, 98, 1989
- Kayser et al. (1986) Kayser, R., Refsdal, S., & Stabell, R. 1986, A&A, 166, 36
- Kochanek (2004) Kochanek, C. S. 2004, ApJ, 605, 58
- Lewis & Irwin (1996) Lewis, G. F., & Irwin, M. J. 1996, MNRAS, 283, 225
- Lewis & Ibata (1998) Lewis, G. F., & Ibata, R. A. 1998, ApJ, 501, 478
- Mortonson et al. (2005) Mortonson, M. J., Schechter, P. L., & Wambsganss, J. 2005, ApJ, 628, 594
- Paczynski (1986) Paczynski, B. 1986, ApJ, 301, 503
- Refsdal & Stabell (1991) Refsdal, S., & Stabell, R. 1991, A&A, 250, 62
- Refsdal & Stabell (1993) Refsdal, S., & Stabell, R. 1993, A&A, 278, L5
- Refsdal & Stabell (1997) Refsdal, S., & Stabell, R. 1997, A&A, 325, 877
- Schechter et al. (2004) Schechter, P. L., Wambsganss, J., & Lewis, G. F. 2004, ApJ, 613, 77
- Schechter & Wambsganss (2002) Schechter, P. L., & Wambsganss, J. 2002, ApJ, 580, 685
- Ullán et al. (2003) Ullán, A., et al. 2003, MNRAS, 346, 415
- Wambsganss (1992) Wambsganss, J. 1992, ApJ, 386, 19
- Wambsganss & Paczynski (1991) Wambsganss, J., & Paczynski, B. 1991, AJ, 102, 864
- Wambsganss et al. (1990) Wambsganss, J., Schneider, P., & Paczynski, B. 1990, ApJ, 358, L33
- Woźniak et al. (2000) Woźniak, P. R., Alard, C., Udalski, A., Szymański, M., Kubiak, M., Pietrzyński, G., & Zebruń, K. 2000, ApJ, 529, 88
- Wyithe et al. (2000) Wyithe, J. S. B., Webster, R. L., & Turner, E. L. 2000, MNRAS, 318, 1120
- Wyithe & Turner (2001) Wyithe, J. S. B., & Turner, E. L. 2001, MNRAS, 320, 21
- Wyithe et al. (2002) Wyithe, J. S. B., Agol, E., & Fluke, C. J. 2002, MNRAS, 331, 1041