Exploring brown dwarf disks: A 1.3 mm survey in Taurus
Abstract
We have carried out sensitive 1.3 mm observations of 20 young brown dwarfs in the Taurus star-forming region, representing the largest sample of young substellar objects targeted in a deep millimeter continuum survey to date. Under standard assumptions, the masses of brown dwarf disks range from 0.4 to several Jupiter masses. Their relative disk masses are comparable to those derived for coeval low-mass stars: most of them are in the 1% – 5% range, and there is no clear change of relative disk mass with object mass from 0.015 to 3 solar masses. Specifically, we do not find evidence for disk truncation, as would be expected in the ejection scenario for brown dwarf origin, although the signature of ejection may be hidden in our non-detections. We use the derived mm fluxes, complemented by mid-infrared data from the Spitzer Space Telescope and ground-based near-infrared images, to construct spectral energy distributions (SEDs) for six of our sources, and model those SEDs with a Monte Carlo radiative transfer code. While the model fits are by no means unique, they allow us to investigate disk properties such as the degree of flaring and minimum radii. In several cases, we find that the SEDs in the mid-infrared exhibit lower flux levels than predicted by hydrostatic models, implying dust settling to the disk midplane. What’s more, at least 25% of our targets are likely to have disks with radii 10 AU; models with smaller disks cannot reproduce the mm fluxes even if they are very massive. This finding is in contrast to the results of some simulations of the ejection scenario for brown dwarf formation that suggest only 5% of ejected objects would harbor disks larger than 10 AU. Our findings imply that ejection is probably not the dominant formation process, but may still be relevant for some brown dwarfs.
1 Introduction
More than a decade after the discovery of the first bona fide brown dwarfs (Nakajima et al., 1995; Rebolo, Zapatero Osorio, & Martín, 1995), it is now firmly established that these objects with substellar masses () are ubiquitous in star forming regions, open clusters, and the field (see e.g. Comerón, Neuhäuser, & Kaas, 2000; Moraux et al., 2003; Kirkpatrick et al., 2000). Several hundred brown dwarfs have been identified, clearly demonstrating that substellar objects bridge the mass range between stars and planets – hence, the mass function is continuous from solar down to Jupiter-like masses.
This challenges the conventional understanding of the formation of stars and planets: Whereas stars form through fragmentation and collapse of molecular cloud cores, planets are believed to originate in subsequent processes in the circumstellar disk. This implies that the formation process is a function of object mass, and has led to a debate about the origin of brown dwarfs. Four main scenarios have been discussed recently as possible sources of (isolated) brown dwarfs (see Whitworth & Goodwin, 2005): a) Collapse of molecular cloud cores with substellar masses, i.e. in situ formation, a process comparable to the formation of stars (Padoan & Nordlund, 2004). b) Planet-like formation in a circumstellar disk, followed by ejection (Pickett et al., 2000). c) Formation as stellar embryos in multiple systems that are ejected in an early stage (Reipurth & Clarke, 2001). d) Photoevaporation of intermediate-mass cores (Whitworth & Zinnecker, 2004). It became clear, however, that only star-like formation (a) and ejection from multiple systems (c) are able to produce significant numbers of brown dwarfs, and are thus considered to be the main scenarios for brown dwarf formation (Whitworth & Goodwin, 2005; Kroupa & Bouvier, 2003).
Distinguishing between the two models has been a main motivation for observational studies of young brown dwarfs. Soon it was apparent that substellar objects with ages of a few Myrs share many properties with solar-mass T Tauri stars. Particularly, near- and mid-infrared surveys clearly indicate the existence of circum-sub-stellar material around young brown dwarfs (e.g. Muench et al., 2001; Jayawardhana et al., 2003), where the SEDs are well-described by models of either flat or flared accretion disks (Natta et al., 2002; Pascucci et al., 2003; Mohanty et al., 2004; Allers et al., 2006). Additional evidence for the existence of substellar disks comes from spectroscopic accretion studies: A significant fraction of young brown dwarfs shows spectroscopic signatures of ongoing accretion and mass outflow, typical for classical T Tauri stars (Fernández & Comerón, 2001; Jayawardhana, Mohanty, & Basri, 2003; Muzerolle et al., 2003; Mohanty, Jayawardhana, & Basri, 2005). The main conclusion so far is that accretion disks around brown dwarfs are comparable to or at least not vastly different from stellar disks, in terms of their geometry, their accretion behaviour, and their lifetime (e.g. Jayawardhana, Mohanty, & Basri, 2002; Barrado y Navascués & Martín, 2003; Scholz & Jayawardhana, 2006).
This finding alone is not sufficient to distinguish between the competing formation models: The pure existence of circum-sub-stellar disks does not rule out an ejection, because simulations show that a substantial fraction of material can survive the ejection process (Bate, Bonnell, & Bromm, 2002). Unfortunately, quantitative testable predictions for the amount of dust and gas remaining after a typical encounter in a multiple system, which leads to the ejection of the lower mass body, are rare in the literature. Heller (1995) estimates the average mass loss through an encounter to be less than % of the initial disk mass, where most of the lost material may be captured by the perturber. Is has also been predicted that brown dwarfs with disk radii larger than 10-20 AU are rare (%, Bate, Bonnell, & Bromm, 2002, 2003). Generally, it is believed that in a statistical sense an ejection process will significantly reduce the disk mass and the disk radius of the ejected body (Reipurth & Clarke, 2001), and thus leads to truncated disks. This provides motivation for studies of disk properties for brown dwarfs.
A further reason to explore disk masses in the substellar regime is the unsettled issue of a possible trend of disk mass, absolute or relative, with object mass. Intuitively, one expects lower-mass stars to have lower absolute disk masses, resulting in a constant disk mass to object mass ratio, and indeed this has been found by some authors (see the review by Natta, Grinin, & Mannings, 2000). Other groups claim to find constant absolute disk masses and, as a consequence, higher relative disk masses for lower mass stars (e.g. Nuernberger, Chini, & Zinnecker, 1997; Mannings & Sargent, 2000). The main problem, which might prevent the detection of a clear trend, is the large scatter of 2-3 orders of magnitude in the measured disk masses at any given stellar mass. Extending the mass range to substellar objects might help to determine whether there is a correlation of disk with object mass or not.
The best way to determine disk masses and outer radii is to analyse SEDs with coverage from near-infrared to the submillimeter or millimeter regime. Infrared SEDs alone are not sensitive to constrain these parameters (see Allers et al., 2006). Moreover, the submm/mm flux is directly related to the dust mass in the disk, providing a straightforward way to estimate disk masses. This method has been established by Beckwith et al. (1990) for young stellar objects, and comprehensive submm/mm surveys have been carried out for large samples of T Tauri and Herbig Ae/Be stars (e.g. Osterloh & Beckwith, 1995; Shirley et al., 2000; Andrews & Williams, 2005). The same method has been applied to a small sample of brown dwarfs by Klein et al. (2003). Their initial study provided disk masses for two and upper limits for seven young brown dwarfs.
Submm/mm observations of brown dwarfs are at the limit of the observational capabilities of current submm/mm telescopes, with typical flux levels lower than 5 mJy, and require substantial observational efforts. Here we describe the first comprehensive study of disks around very young substellar objects, aimed to probe brown dwarf formation theories and disk properties as a function of object mass, and thus providing an observational foundation for future theoretical studies of these problems. Our targets are 20 brown dwarfs in the Taurus star forming region, which represent one of the largest coeval samples of brown dwarfs known to date. For all 20 objects, we obtained deep integrations with the 1.3 mm bolometer camera at the IRAM 30 m telescope. Six sources were detected at flux levels between 2 and 8 mJy at 1.3 mm., thus increasing the number of brown dwarfs with known disk masses by a factor of 4. To probe the disk geometry, we additionally made use of Spitzer mid-infrared data for objects detected at 1.3 mm. By combining mm and mid-infrared photometry and comparing with SED models, we aimed to constrain disk properties. Particularly, we are interested in the disk radii, which can, similar to disk masses, be used to search for signatures of truncated disks and thus distinguish between formation models.
The paper is structured as follows. Sect. 2 contains a description of target sample, observations, data reduction, and reliability checks. In Sect. 3 we discuss the conversion from mm fluxes to disk masses, and compare our results with disk masses for stars from the literature. The SED modeling based on mm and Spitzer data is described in Sect. 4. The final Sect. 5 provides a summary of our results.
2 Targets, observations, fluxes
This paper is based on a 1.3 mm continuum survey of 20 brown dwarfs in the Taurus star forming region. At the time of the observations, these objects were the only spectroscopically confirmed Taurus members with spectral types later than M6 and thus most likely substellar masses (see Sect. 3.2 for a more detailed assessment of the object masses). The targets were identified in photometric surveys with follow-up optical spectroscopy by Martín et al. (2001), Briceno et al. (2002), Luhman et al. (2003b), and Luhman (2004). The sample does not include the recently published new Taurus brown dwarfs by Guieu et al. (2005).
The millimeter observations were carried out in October and November 2005 using the IRAM 30 m single-dish telescope on Pico Veleta/Spain, equipped with the bolometer MAMBO-2, which is a 117-pixel array with a HPBW (half power beam width) of . The objects were centred on the most sensitive pixel of the array, and since our target coordinates (taken from the 2MASS catalogue) are accurate within , we expect that this pixel contains the complete flux from the targets. All observations were performed in ON/OFF mode for background subtraction, using a wobble throw of 32”. The integration times per subscan were either 10 or 60 sec. Some scans for target J043903+2544 were affected by additional noise due to a known acceleration problem of the bolometer (S. Leon, priv. comm.). Each target was observed on at least two different nights, typically with on-source integration times of 20 min per night, to be able to identify problems with background subtraction, calibration, and increased noise. During the observations, we aimed to reach comparable noise levels for all targets. As a consequence, the total on-source times range between 40 and 90 min (see Table 1).
Data reduction was carried out using the MOPSIC pipeline provided by IRAM. To check for inconsistencies, fluxes were measured for different scans separately. In general, the flux levels obtained from different scans (but the same target) are comparable within the noise limits. The final flux at 1.3 mm was measured using all scans. These values are listed in Table 1. Typically, we reached noise levels of 0.7-0.8 mJy.
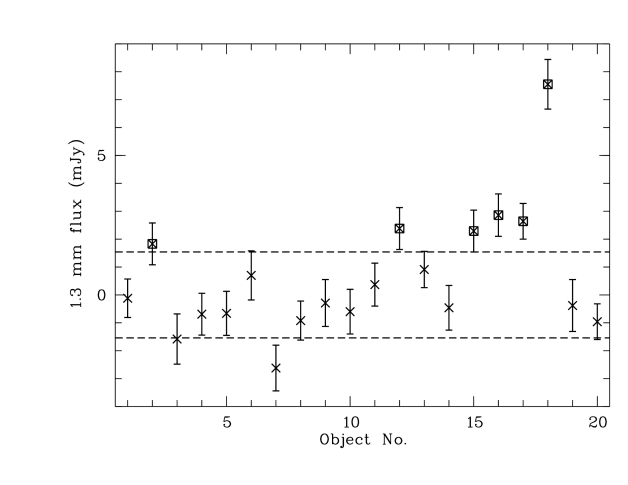
In Fig. 1 we plot the 1.3 mm fluxes obtained with IRAM for all targets, as a function of their K-band magnitude. As can be seen from this figure, five objects show clear positive detections with flux levels exceeding . A sixth object (KPNOTau2) has a detection. These six sources will be called ’detections’ in the remainder of the paper. For object KPNOTau9, we obtain a 3 negative flux level, which is most likely related to excessive background emission. Excluding this object and the six detections, all remaining measurements scatter around zero.
The example of KPNOTau9 highlights that the derived fluxes may be affected by imperfect background subtraction caused by other sources in the neighbourhood of our targets or inhomogenities in the Taurus cloud itself. To address this problem, we examined the bolometer maps for all our targets. Since the bolometer wobble throw was 32”, only sources within this radius are likely to contaminate the measurement significantly. Only one of our targets (J041411+2811) has a detection within this distance, which is, however, only visible in parts of our scans. Since our flux measurement is consistent in all scans, we consider it to be reliable. In a wider radius of 100”, two of our targets, KPNOTau9 and 12, have neighbour sources. Both targets exhibit negative flux levels, in the case of KPNOTau9 on a 3 level, which might be due to the emission from the nearby source. All other objects have maps without contaminating sources.
As a complementary test, we searched the IRAS point source catalogue for sources in a 100” circle around our targets. It turned out that only two objects – KPNOTau9 and J041411+2811 – have an IRAS neighbour. In the case of KPNOTau9, this neighbour has a 100 flux of 17 Jy and is located at a distance of 91”, and thus possibly could contaminate the background measurement for the brown dwarf. We therefore attribute the negative flux level for KPNOTau9 to improper background subtraction. The IRAS neighbour of J041411+2811 probably has no significant influence on our 1.3 mm flux measurement, as argued above. We examined the 100 IRAS images for all our sources, and found that the flux level in the region which affects the background subtraction, is more or less constant. These results confirm that our objects, with the exception of KPNOTau9, are fairly isolated and in regions without strong background inhomogenities.
An alternative assessment of the reliability of our mm fluxes can be made based on our measurements itself. If the fluxes are pure noise (i.e. no significant emission from the target and not affected by improper background subtraction), we expect them to scatter around zero, with Gaussian distribution. It is obvious that the complete sample is not consistent with Gaussian noise, because we have six objects with fluxes, whereas we expect zero. After excluding all detections (positive and negative), we expect 9.2 (66%) to have flux levels within the 1 and 13.3 (95%) within the 2 uncertainties. The actual numbers for our sample are 8 and 13, respectively.
To verify if the average flux after excluding measurements ( mJy) is consistent with the expected zero value, we carried out Monte Carlo simulations: Assuming pure Gaussian noise with (the average uncertainty) and zero average, we generated 14 datapoints and computed the average. From 10000 test runs, a substantial fraction of 15.6% resulted in an average mJy. These two simple tests show that the scatter in Fig. 1 is fully consistent with Gaussian noise plus an excessive number of outliers, confirming again that the quoted fluxes are (with the exception of KPNOTau9) most likely not severely affected by imperfect background subtraction. We therefore conclude that the fluxes for the positive detections are related to our substellar targets. Finally we note that two of our objects – CFHTBDTau1 and 4 – have already been observed with the same instrumentation (Klein et al., 2003); their 1.3 mm upper limit (for CFHTBDTau1) and flux (for CFHTBDTau4) are completely consistent with our values.
We aimed to complement our 1.3 mm fluxes with near-infrared and mid-infrared data to be able to constrain the spectral energy distribution (SED) for the sources. This is particularly interesting for the six detections, because it allows us to compare with disk models (see Sect. 4). All detections except KPNOTau2 have been observed with the IRAC and MIPS instruments on board the Spitzer Space Telescope as part of the Spitzer GO program 3584 (’A Spitzer Imaging Survey of the Entire Taurus Molecular Cloud’, PI D. Padgett). From these Spitzer images, we derived mid-infrared fluxes for these five sources and for the comparison object CFHTBDT2 (which has no mm detection). IRAF/daophot was used for aperture photometry. The apertures were chosen to avoid source confusion and to optimize signal-to-noise (5 pixels for IRAC, 8 pixels for MIPS). Measured fluxes were converted to absolute fluxes using the aperture corrections given in the Data Handbooks for IRAC and MIPS. Near-infrared and optical photometry for the same six objects was taken from 2MASS and the surveys by Martín et al. (2001) and Luhman (2004). These magnitudes were converted to fluxes using the zeropoints given by Skinner (1996). For CFHTBDT4, we added to the SED the datapoints listed in Table 1 of Pascucci et al. (2003). These SED data will be used in Sect. 4 to constrain disk properties of our targets.
Since binarity might be an important factor for the disk properties (see Sect. 3.3), we searched for archived high-resolution images of our targets. Twelve of our 20 sources have been observed in the framework of the HST program no. 9853 (PI R. White) in deep exposures with three different filters. The reduced images are publicly available, and we used them to check for companions (Sect. 3.3).
3 Disk masses
3.1 Transforming fluxes to disk masses
As outlined in Sect. 2, we are confident that the obtained 1.3 mm fluxes are related to the observed substellar objects in Taurus. If this is the case, the mm flux is due to optically thin emission from circum-sub-stellar dust, which is directly proportional to the dust mass (see Beckwith et al., 1990). The following equation relates the mm flux to the dust mass :
| (1) |
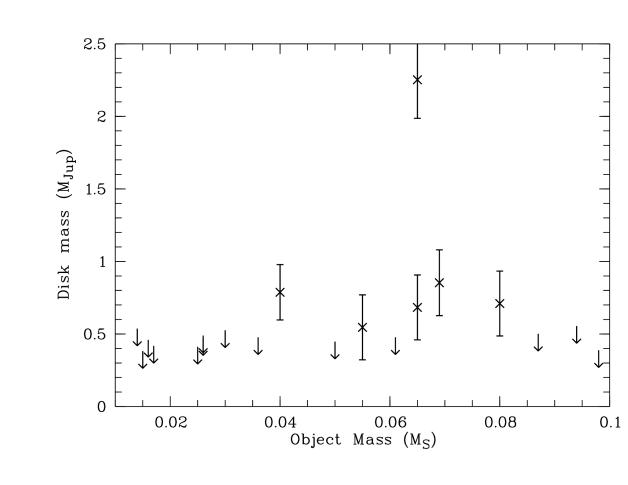
The distance of our targets is known: All objects are spectroscopically confirmed young members of the Taurus star forming region, for which a Hipparcos based distance estimate of pc has been derived (Wichmann et al., 1998). is the blackbody flux for the temperature of the dust . The plausible range for is 10-20 K, so we assume 15 K here, consistent with, e.g. Klein et al. (2003) and Shirley et al. (2000). The dust opacity is highly uncertain and not very well constrained in the literature. However, when converting submm/mm fluxes to disk masses, most groups use values between 1 to 3 cm2 g-1 at 1.3 mm, in agreement with the recommendations of Ossenkopf & Henning (1994). To be consistent with the literature values for disk masses for stars, we thus adopt a dust opacity of 2.0 cm2 g-1, as it has been used for example by Shirley et al. (2000); Nuernberger et al. (1998); Beckwith et al. (1990). To convert from dust to disk masses we assumed a dust to gas ratio of 1:100, as generally adopted in the literature. The derived disk masses (or upper limits) using these parameters are listed in Table 1, and plotted in Fig. 2. For our six detections, the disk masses range from 0.55 to 2.55.
Dust temperature, opacity, and (to a minor degree) distance are the main sources of uncertainty in this calculation, and usually lead to large uncertainties in the disk masses. To assess the errors in our mass estimates, we carried out Monte Carlo simulations: We generated random numbers for , , and in the ranges given above, and computed disk masses for our six detections. The resulting range of likely disk masses is given in Table 1. Please note that most of the uncertainty connected with these three parameters is systematic and will affect all results in a similar way. The errorbars in Fig. 2 reflect only the 1 measurement uncertainty of the mm fluxes.
3.2 Comparison with published disk masses
Disk masses have been determined for large samples of T Tauri stars and for some Herbig Ae/Be stars in star forming regions, but only for two brown dwarfs (Klein et al., 2003). This study provides the first large sample of disk masses for substellar objects. By comparing with literature results for higher mass stars, it allows us to study disk mass as a function of object mass over a mass range of more than three orders of magnitude – from 0.02 to 3. As outlined in Sect. 1, such a comparison is an important tool to probe brown dwarf formation scenarios: If brown dwarfs are ejected stellar embryos, as predicted by a main class of formation models (see Sect. 1), we expect disk truncation and thus reduced disk masses. This may lead to a break or a trend towards lower disk masses in the substellar regime.
Ideally, one has to compare disk masses for coeval objects, to exclude influence of an age spread. The disk masses of T Tauri stars show only little dependence on age for objects with ages between 1 and 5 Myr (see e.g. Nuernberger, Chini, & Zinnecker, 1997; Andrews & Williams, 2005). The disk masses decrease significantly for stars with ages Myr, but such objects are rare in Taurus. Most of the young stellar objects in Taurus are known to have ages between 1-3 Myr (Luhman, 2004). Thus, for our purposes, we consider the substellar Taurus population to be coeval. It is thus legitimate to compare our brown dwarf disk masses with those of T Tauri stars in star forming regions with similar ages. The most appropriate way to do this is to compare the ratio of disk mass to object mass.
We estimate masses for our brown dwarf targets by converting their spectral types to effective temperatures using the scale by Luhman et al. (2003a) and comparing these temperatures with the most recent evolutionary tracks by Baraffe et al. (2003) assuming an age of 2 Myr. The derived object masses are listed in Table 1. Although the uncertainties in the conversion from spectral types to masses are considerable, mainly due the evolutionary tracks at young ages (see Baraffe et al., 2002), all our targets are likely to have masses between 0.01 and 0.1. We note that the model uncertainties lead to systematic errors, thus the relative masses in our sample are more reliable. The same procedure was applied to derive masses for the young brown dwarfs and very low mass stars observed by Klein et al. (2003), which are included in the following analysis, in cases that we did not observe in our survey.
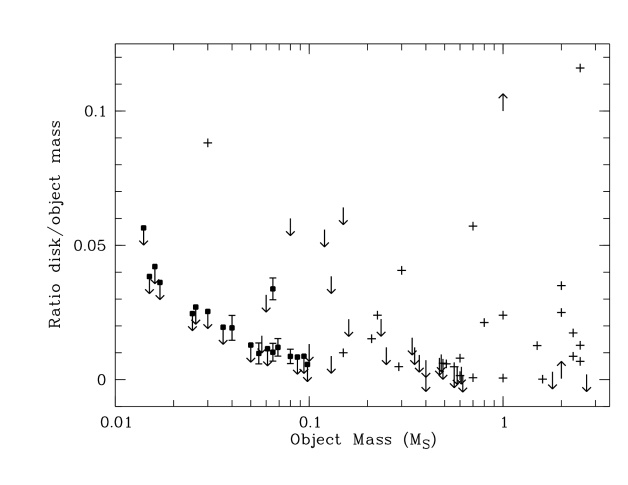
As comparison samples for higher mass stars, we used the results from Osterloh & Beckwith (1995), Nuernberger, Chini, & Zinnecker (1997), Nuernberger et al. (1998), and Natta, Grinin, & Mannings (2000). All these papers contain lists with object masses and ages as well as disk masses determined either from SED modeling or mm measurements for objects mainly belonging to star forming regions in Taurus, Oph, and Lupus. Again, all object masses should be considered as rough estimates, but for our purposes even uncertainties of 100% are tolerable. To avoid being biased by an age spread (see above), we used only the subsample of stars with ages between 1 and 5 Myr, where disk masses are known not to show a significant trend with age. All comparison stars can thus be considered to be coeval with our brown dwarfs. The final sample of comparison sources comprises of 52 objects with masses between 0.03 and 2.7, among them 25 upper and 2 lower limits. Their ratios of disk and object mass are plotted in Fig. 3 along with our values for Taurus brown dwarfs.
3.3 Discussion
Fig. 3 does not reveal a significant change of disk to object mass ratio with object mass. Specifically, there is no obvious difference in the very low mass regime, i.e., among the lowest mass stars and brown dwarfs, where ejection might become important (Goodwin, Whitworth, & Ward-Thompson, 2004). The average mass ratio (for the detections) is 1.9% in the stellar and 2.6% in the substellar regime, thus comparable given the large scatter and uncertainties. There is no hint of an underabundancy of ’massive’ disks among brown dwarfs: % (9 out of 22) detected disks around stars have ratios %, whereas there are two such objects among brown dwarfs – 2 out of 6, i.e. %. If we consider all objects, there are three stars (%) with ratios %, and one brown dwarf, i.e. % (IC348-613 from Klein et al. (2003)). Here we neglect upper limits close to 5%, because these objects are unlikely to have disk masses %. Taking into account the large uncertainties in disk and object masses, there is no statistical basis to claim that brown dwarfs lack (relative) massive disks.
There is still the possibility that such an effect is hidden in the non-detections. The average disk to object mass ratio is % in the stellar regime, which is an upper limit, because it does not take into account non-detections. Assuming no trend with mass, we expect half of the brown dwarfs to have values below 1.9%. For nine of our brown dwarfs we can rule out that they have ratios %, and for two of them we know that the ratio is %. Thus, if most of the upper limits with ratios % are in fact values lower than 1.9%, there would be reason to believe that brown dwarfs have more often very little circumstellar material than stars, which would in turn be indirect evidence for truncated disks. Based on the available observational data, this possibility cannot be definitely excluded. The next generation of submm telescopes will hopefully provide the means to verify this hypothesis.
Recapitulating, we do not see any overall trend of relative disk mass with object mass. The dominant feature seen in Fig. 3 is a large scatter over the entire mass range, which appears to be more significant than any possible mass dependency. Previous studies of this problem are inconclusive: Andrews & Williams (2005) find that (absolute) disk masses in Taurus-Auriga scatter over three orders of magnitude and do not show any trend with stellar masses (which range from 0.1 to 2.5 in their sample). The same result has been obtained by Mannings & Sargent (2000), who include datapoints for Herbig Ae stars with masses between 1 and 4. If, however, the range of disk masses is constant over such a large mass range, this implies an increase of the relative disk mass with decreasing stellar mass by about one order of magnitude. This is in agreement with the studies of Nuernberger, Chini, & Zinnecker (1997) and Nuernberger et al. (1998), who find a weak correlation of relative disk mass and stellar mass in Lupus and Oph, in the sense that stars with low masses () tend to have more massive disks.
On the other hand, the review paper by Natta, Grinin, & Mannings (2000) does not report any evidence for such a trend. They compile disk masses for T Tauri and Herbig Ae/Be stars, and find a positive correlation of (absolute) disk mass with stellar mass. Converted to relative disk mass, the correlation disappears. Consequently, they claim that the ratio of disk to stellar mass is roughly constant in the mass range from 4 to 0.3. This is confirmed by our Fig. 3, which does not show any clear sign of a trend. In any case, if there is a correlation, it is much weaker than the scatter in disk masses.
One reason for the discrepancy in the literature results might be an age spread or environmental effects on disk masses. By throwing together measurements for objects with ages varying from 0.1 to 10 Myr, as done in most literature studies, possible trends with object mass might be diluted, which was the reason for us to include only objects with ages between 1 and 5 Myr in our analysis. Strictly speaking, one has to separate age and mass effects, but this leads to very small samples.
An important reason for the consistently large scatter in all previous studies of disk masses as well as in our own data might be binarity. It has long been known that the existence of a companion and the binary separation clearly affects the submm properties of T Tauri stars (Osterloh & Beckwith, 1995; Nuernberger et al., 1998). Separations smaller than 50-100 AU appear to inhibit the submm flux (Osterloh & Beckwith, 1995; Jensen, Mathieu, & Fuller, 1994, 1996), presumably by truncating the outer disk. For very close companions ( AU), Jensen & Mathieu (1997) found evidence for cleared out inner regions, which strongly affects the mid-infrared, but not the mm fluxes. The recent analysis of Andrews & Williams (2005) finds that the presence of a companion with separation 1-100 AU tends to decrease the mass of circumstellar material, although they still have detectable disks.
If and how this trend continues in the substellar regime is unknown. We used deep images from the HST, which are available for 12 of our sources (all KPNO and CFHT objects), to assess the binarity in our brown dwarf sample by careful visual inspection. Only one of the 12 objects appears to have a companion within , corresponding to 500 AU in Taurus. KPNOTau9, the only object with an obvious companion, shows a neighbour at AU. We did photometry on images in the HST filters corresponding to z’ and i band, and found that the magnitude difference is mag in the red, but only mag in the blue filter. If it is a physical companion or at least a member of the Taurus star forming region, we expect it to be significantly redder than the primary. This is not the case, so we conclude that we are seeing a background object. To verify the lower detection limit in separation, we additionally checked three known binary brown dwarfs in Upper Scorpius, which have been detected with the same dataset (Kraus, White, & Hillenbrand, 2005). Two companions with separations of and are clearly seen by visual inspection, whereas the third one with separation is not obvious, and can only be recovered with PSF fitting. Thus, a conservative estimate for our inner detection limit is or AU.
We conclude that none of the twelve objects observed with HST is a binary with separation between 10 and 500 AU, and thus the frequency of companions in this separation range appears to be quite low. From our analysis, we derive an upper limit of 22% (with 95% confidence) for separations between 10 and 500 AU. This is in line with high-resolution imaging surveys of field brown dwarfs that find very few companions with separations AU (Bouy et al., 2003; Martín et al., 2003), although recently Bouy et al. (2006) found a possible population of wide companions in the Upper Scorpius star forming region. At least for our targets in Taurus, we expect no significant impact from wide companions on the disk properties in the substellar regime. Close companions with separations AU may still exist around our objects and affect their disks (although probably not the disk mass). Recent results indicate a spectroscopic binary frequency of 11% in the very low mass regime for field objects (Basri & Reiners, 2006). In the absence of comprehensive binary studies for brown dwarfs with disks, it is difficult to disentangle the effects of binarity and the formation process on the properties of the disk.
Pondering all these observational results, we arrive at three conclusions: a) The dominant effect in the existing database of disk masses is a large scatter over at least two orders of magnitude, independent of object mass, which might be due to binarity. b) We do not see any trend of relative disk mass with object mass, in contrast to several literature studies. c) Based on the existing mm data, there is no clear break at or around the substellar limit, indicating no significant change in the disk properties due to, for example, an ejection process.
4 Modeling the SEDs of brown dwarf disks
4.1 Model description
We use Monte Carlo radiation transfer codes to generate model SEDs for dusty disks irradiated by brown dwarfs. Given the apparent low accretion rate of brown dwarfs (Muzerolle et al., 2003) for all models we assume disk heating is dominated by radiation from the brown dwarf. In all our models presented below, for the incident stellar spectra we use NextGen model atmospheres (Allard et al., 2001; Hauschildt, Allard, & Baron, 1999) with . The combination of mm and IR data allows us to investigate disk masses, sizes, and structures. For the disk structure we explore the following two scenarios: disks in vertical hydrostatic equilibrium with dust and gas well mixed (D’Alessio et al., 1998; Walker et al., 2004); and geometrically flatter disks where the dust and gas are not coupled and grain growth and sedimentation of large grains towards the midplane has occured (e.g. Miyake & Nakagawa, 1995; Dullemond & Dominik, 2004; D’Alessio et al., 2006). For the disks in vertical hydrostatic equilibrium we use the models described by Walker et al. (2004) where the radial gradient of the disk surface density is described by a power law, . Disk surface density gradients are usually in the range , with the value quoted for the minimum mass solar nebula (Hayashi, 1981) and found for irradiated steady accretion disks (D’Alessio et al., 1998). In all our models below we use .
Hydrostatic equilibrium disks around brown dwarfs are highly flared due to the lower gravity of the central star (Walker et al., 2004) and as will be demonstrated below, such models do not provide good fits to our Taurus brown dwarf disks. Therefore, to investigate deviations from hydrostatic equilibrium (e.g., dust settling and geometrically flatter disks) we adopt the following parameterization for the two dimensional density structure of the disks (Shakura & Sunyaev, 1973)
| (2) |
where is the radial coordinate in the disk mid-plane and the scaleheight increases with radius, . We vary the degree of flaring within the geometric disk models by adjusting the values of and . As with the hydrostatic models, we assume the surface density exponent . This allows us to investigate to a first approximation the degree to which the disk structure deviates from the vertical hydrostatic equilibrium case. Our approach of using two grain populations is similar to other recent work on SED modeling (Dullemond & Dominik, 2004; D’Alessio et al., 2006).
As some brown dwarf disks show evidence for silicate features in their spectra (e.g. Pascucci et al., 2003), we have modified our code to include multiple grain size distributions that have different spatial distributions (e.g. Wolf, 2003; Carciofi, Bjorkman, & Magalhaes, 2004). The process of dust growth and sedimentation is thought to result in small grains remaining coupled to the gas and larger grains settling towards the disk midplane (Jayawardhana et al., 2002; Dullemond & Dominik, 2004; D’Alessio et al., 2006, e.g.). Therefore for this present investigation we adopt two different grain size distributions and assign them different scaleheights. We assume that small grains with an interstellar-like size distribution (Kim, Martin, & Hendry, 1994) have a larger scaleheight than the larger grain size distribution we have used previously to model SEDs of disks around Classical T Tauri stars (e.g. Wood et al., 2002; O’Sullivan et al., 2005; Schneider et al., 2003). This dust model includes silicates and carbonaceous grains using solar abundance constraints. The grain size distribution is a power law with an exponential decay for particles with sizes above m and a formal maximum grain size of 1 mm (see desription of grain model in Wood et al., 2002). Although our large grain model has been successful in fitting SEDs of other disk systems, we do not claim our particular grain model represents the dust size distribution in all disks and note that it is the product of opacity and mass that may be determined from SED fitting of long wavelength data.
For simplicity and in the absence of a detailed model for dust growth and settling, we use eqn. 2 to describe the density structure of the two grain models. Both components have the same surface density distribution ( and ) and we vary for each component to simulate the different scaleheights arising from settling of the larger grains. The disk mass is dominated by the large grain component and we add a small amount of ISM-like grains with a larger scaleheight to fit the silicate features present in the SED of CHFTBDT4. In our parameterization we assign the mass to the large grains and the mass to the ISM-like grains. The total disk mass is then , where this is the mass of dust plus gas with an assumed gas to dust ratio of 100.
For all models we assume that dust in regions close to the star is destroyed if temperatures rise above 1600K (Duschl, Gail, & Tscharnuter, 1996). This condition provides a minimum inner dust radius of typically . Any remaining gas within this gap we assume to be optically thin and therefore we effectively have an opacity gap in the disk (Lada & Adams, 1992). All models are subject to reddening using the extinction curve for interstellar grains from Kim, Martin, & Hendry (1994).
4.2 Results: Disk structure, masses and radii
As discussed in many papers, there are lots of degeneracies in fitting SED data: disk structure, scaleheights, radii, surface density, dust properties (e.g. Chiang et al., 2001). Robust determinations of the disk structure require modeling of multiwavelength imaging as well as spectroscopy and so far only a few sources have sufficient data to allow such a study (e.g., see the combined scattered light and SED modeling of GM Aur in Schneider et al. (2003)). The current data available on brown dwarf disks is limited to SED data with large gaps in wavelength coverage — the sources we are modeling have no data in the range , which is a crucial regime for determining disk structure. Therefore, the fits presented are “by eye” and we have not attempted any sophisticated least squares fitting of the data. We are not claiming the model fits presented are unique solutions for the disk structure, but they do allow us to address the following questions: what is the minimum disk radius, is there evidence for dust growth and sedimentation (i.e., flatter disks), and is there evidence that the disk structure significantly deviates from vertical hydrostatic equilibrium?
The results of our modeling are displayed in Fig. 4 and the model parameters used for each source are displayed in Table 2. Each panel in Fig. 4 shows the data and five curves: the input stellar atmosphere model, best fitting disk model using two dust components with AU, two-component disk model with AU, two component disk model with AU, and a hydrostatic model with the same total mass as the best fitting disk model and radius AU. As one of our goals is to determine whether the data will allow us to place constraints on the minimum disk radius, we have not explored disk models with radii greater than 100 AU.
Immediately we see that the hydrostatic disk models produce too much mid-infrared emission. This is due to the large scaleheights in hydrostatic disks around low mass objects (Walker et al., 2004). Better fits to the SEDs are provided by our two-component disk models where the large grains have a smaller scaleheight than the small grain population. This result is consistent with previous investigations (e.g. Testi et al., 2002; Pascucci et al., 2003) and implies that brown dwarf disks do not have dust and gas well mixed in vertical hydrostatic equilibrium. However, we also see that in general the hydrostatic models underpredict the near-IR excess emission. Compared to our two-component power law disk models, this implies that the inner disk regions have scaleheights larger than hydrostatic models and the outer disk regions are less flared with scaleheights that are smaller than the corresponding hydrostatic solution. The cause of this “super-hydrostatic” scaleheight in the inner disk regions clearly cannot be due to radiation from the central star; otherwise the hydrostatic models would fit the near-IR flux levels.
This “super hydrostatic” effect in the inner disk is also present in models of Herbig Ae disks (Vinkovic et al., 2006, C. Dullemond, private communication). For these systems SED models also require the inner disk scaleheight to be larger than that for a disk in vertical hydrostatic equilibrium. At present we do not know the reason for this “super-hydrostatic” scaleheight effect. One possibility is reprocessing of stellar photons in low density material close to the star such as a disk wind. It may also be that some other heating mechanism, e.g. chromospheric or coronal emission, is responsible for the observed near-IR excess. Finally, close companions may be able to interact with the disk and transfer energy to the inner parts of the disk. More detailed dynamical models of disk structure and evolution are clearly required to further investigate this effect.
The disk masses derived from our radiation transfer simulations are consistent with the disk mass ranges estimated from the mm fluxes alone using the simple formula of equ. (1), in particular if we take into account the different mm opacity in our adopted dust model, compared to used in Sect. 3.1. Four of our sources may be modeled with disk masses and one has a larger mm flux and a correspondingly higher . Note that these masses are the total mass of dust plus gas that contributes to the observed SED and does not include a sizeable mass of dust with grain sizes above a few hundred microns or very large objects (rocks, boulders, planets) that may be present in the disk. As such, the derived masses are the minimum circumstellar mass for the dust model we have used.
Our models show that with current data we cannot discriminate among models that have radii greater than AU. Smaller disks cannot reproduce the mm data, even if they are very massive. This is demonstrated by the AU models which have . These disks cannot reproduce the mm flux levels because there is not enough material at cool enough temperatures to provide emission at long wavelengths. Therefore, the mm flux levels observed mean that the disks must have radii greater than 10 AU.
We now give some brief comments on the individual sources in Fig. 4.
CFHTBDT4: This source was previously modeled by Pascucci et al. (2003). Our modeling agrees well with theirs for the luminosity and interstellar extinction, though our use of a model atmosphere instead of a blackbody provides a better match to the shortest wavelength fluxes. We achieve a good match to the data around the 10 silicate feature using ISM grains in an extended layer with a scaleheight twice that of the larger grains in our models. It is very difficult to discriminate the AU and AU models, even at far-IR wavelengths (see also Beckwith et al., 1990; Chiang et al., 2001). Disk radii smaller than 10 AU cannot reproduce the SED, even if the disk is very massive.
J043814+2611: This source is under-luminous at near-IR wavelengths and was suspected of being a disk viewed close to edge-on (Luhman, 2004). Our models confirm this as we find a viewing angle for the star plus disk system. The luminosity of the central source in our models is larger than that estimated from spectral typing. This is not surprising because disks viewed edge-on are seen only via scattered starlight so photometric spectral typing is prone to error. In addition Walker et al. (2004) pointed out that edge-on Classical T Tauri stars may have colors resembling less inclined brown dwarf plus disk systems. Due to the uncertainty in the spectral type we have not attempted any other models for this source (small disk radii or hydrostatic disks).
J043903+2544: The hydrostatic model for this source clearly produces too much emission at m. The “super hydrostatic” effect for the inner disk is seen by the poor match of the hydrostatic model at IRAC wavelengths. The two-component disk model provides a much better match to the data.
J044148+2534: The hydrostatic model for this source does match the m data, but at IRAC wavelengths the “super hydrostatic” effect is very pronounced.
J044427+2512: We derive a viewing angle of around for this source and a luminosity that is larger than estimated from spectral typing. As with J043814+2611, inclination effects are likely contributing to confusion in the photometric estimate of the spectral type for this source. The hydrostatic disk structure is more vertically extended than our two-component model and as such obscures the star at optical and near-IR wavelengths for .
CFHTBDT2: This source exhibits no excess emission at infrared wavelengths and we do not detect it at 1.3 mm. The source is modeled with a brown dwarf model atmosphere with K, , giving .
To summarize our SED modeling, we find that the sources detected at 1.3 mm have disks with masses in the range 0.4 to 1.2 and outer radii greater than 10 AU. In general we find the disks have scaleheights in the outer disks that are smaller than would be expected for a disk in vertical hydrostatic equilibrium around a brown dwarf, thus implying dust settling to the disk midplane. However, the near-IR excess emission appears to require the inner disks to be more vertically extended than the hydrostatic solution. It is unclear whether this is related to a true vertical thickening of the inner disk or the reprocessing of stellar radiation in low density material near the star such as a disk wind.
5 Summary
This paper presents a study of brown dwarf disk properties based on the largest sample of mm measurements for this object class so far, complemented by mid-infrared datapoints from Spitzer. We used the fluxes at 1.3 mm to constrain disk masses and the SED to constrain disk radii and geometry by comparing with SED models.
The masses of brown dwarf disks range from fractions of one Jupiter mass up to a few Jupiter masses. The relative masses of brown dwarf disks are not significantly different from values measured for coeval stars. Most of them range between and 5%, with a few outliers between 5 and 10%. A substantial fraction of brown dwarf disks (at least 5 out of 20 in our sample) have radii larger than 10 AU. Smaller disks do not have enough cool material to provide the emission observed at 1.3 mm.
What are the implications of the results given above for our understanding of brown dwarf formation? As outlined in Sect. 1, the two leading theories for brown dwarf formation are collape of (isolated) cores (in situ formation) and ejection from multiple systems. The latter process will affect disk properties and probably leads to truncated disks. Our constraints for disk masses and radii of brown dwarfs do not provide any evidence for the existence of these truncated disks. Particularly there is no change of the relative disk mass around the substellar limit. Moreover, we find % of our targets to have disk radii AU, whereas the prediction for an ejection scenario is % for radii 10-20 AU (Bate, Bonnell, & Bromm, 2002, 2003). Truncated disks are expected to evolve viscously to larger radii after the ejection process (Bate, Bonnell, & Bromm, 2003), but in this case they will have very low masses. Since we have found disks with radii AU and relative masses comparable to those of stars, they are unlikely to be truncated.
Thus, in our survey brown dwarfs appear to harbour scaled down T Tauri disks. Thus, the disk properties found in this paper and in the literature (Pascucci et al., 2003; Klein et al., 2003; Mohanty et al., 2004) are completely consistent with a scenario where brown dwarfs form in situ, i.e. from isolated molecular cloud cores with very low masses. By applying Occam’s Razor, we conclude that there is no need to invoke an ejection process. On the other hand, if ejection plays a role in brown dwarf formation, it is unlikely to be responsible for all objects.
However, although the interpretation of the available information on brown dwarf disks does not require an ejection mechanism, it cannot firmly rule out ejection either. The high number of non-detections in our mm observations may indicate that we are simply not sensitive enough to find the signature of truncated disks. Thus, it may be that the effect of an ejection process is hidden in the non-detections in our sample. Also, the large number of free parameters in the SED models and the large gap in wavelength coverage in the observations still allows for a broad range of disk radii. On the other hand, the theoretical predictions for the outcome of close encounters in multiple stellar systems, which eventually would lead to truncated disks, are sparse and mostly not quantitative. It is clear that some ejected objects can retain a substantial fraction of circum(sub)stellar material, but masses and radii of the ejection-affected disks are poorly constrained. To distinguish between ejected brown dwarfs and in situ brown dwarfs by studying disk properties at ages of 1-5 Myr additionally requires assumptions about the disk evolution on this timescale.
Whereas the non-detections in our observations might hide the signature of ejection, it is unlikely that all disks in our sample and the previously studied brown dwarf disks have experienced an ejection. At least in a few cases, brown dwarf have disks with Jupiter masses, which corresponds to 3-9% of the mass of the central object. It is unlikely that these (relatively speaking) massive disks have been truncated and lost a significant fraction of their mass during an ejection process. The large fraction of objects with disk radii AU is also hardly consistent with formation only by ejection. This simply implies that at least a fraction of brown dwarfs forms in isolation, without violent event in their early evolution. More indications for this interpretation comes from the recent discoveries of a few very wide brown dwarf binary systems (Luhman, 2004; Chauvin et al., 2004). Thus, for a subsample of brown dwarfs there is clear evidence for isolated formation. Future studies should aim to quantify the fractions of substellar objects formed via ejection and/or in situ.
The derived disk masses and upper limits put constraints on possible planet formation scenarios in brown dwarf disks. Since only a small fraction of brown dwarfs have disk masses larger than , it is unlikely that Jupiter-mass planets are frequent around brown dwarfs. Here we assume that planets have not already formed at 1-5 Myr, because our disk mass estimates are only based on the dust. On the other hand, there is certainly enough circum-sub-stellar material to form less massive planets.
Our mm observations for brown dwarfs extend the mass range of objects with constraints on disk masses down to (see Fig. 3). In our age-spread corrected sample, we do not see any significant change of relative disk mass with object mass, as claimed previously in the literature. The dominant feature in this plot is a large scatter of at least two orders of magnitude, independent of the mass of the central object. Apparently, the disk masses only scale down with object mass. As outlined in Sect. 3, binarity may play a more important role than central object mass for the evolution of the disk.
References
- Allers et al. (2006) Allers, K. N., Kessler-Silacci, J. E., Cieza, L. A., Jaffe, D. T. 2006, ApJ, in press
- Allard et al. (2001) Allard, F., Hauschildt, P.H., Alexander, D.R., Tamanai, A., & Schweitzer, A. 2001, ApJ, 556, 357
- Andrews & Williams (2005) Andrews, S. M., Williams, J. P. 2005, ApJ, 631, 1134
- Baraffe et al. (2003) Baraffe, I., Chabrier, G., Barman, T. S., Allard, F., Hauschildt, P. H. 2003, A&A, 402, 701
- Baraffe et al. (2002) Baraffe, I., Chabrier, G., Allard, F., Hauschildt, P. H. 2002, A&A, 382, 563
- Barrado y Navascués & Martín (2003) Barrado y Navascués, D., Martín, E. L. 2003, AJ, 126, 2997
- Basri & Reiners (2006) Basri, G., Reiners, A. 2006, ApJ, accepted
- Bate, Bonnell, & Bromm (2003) Bate, M. R.; Bonnell, I. A., Bromm, V. 2003, MNRAS, 339, 577
- Bate, Bonnell, & Bromm (2002) Bate, M. R.; Bonnell, I. A., Bromm, V. 2002, MNRAS, 332, 65
- Beckwith et al. (1990) Beckwith, S. V. W., Sargent, A. I., Chini, R. S., Guesten, R. 1990, AJ, 99, 924
- Bouy et al. (2006) Bouy, H., Martín, E. L., Brandner, W., Zapatero Osorio, M. R., Bejar, V. J. S., Schirmer, M., Huelamo, N., Ghez, A. M. 2006, A&A, in press
- Bouy et al. (2003) Bouy, H., Brandner, W., Martín, E. L., Delfosse, X., Allard, F., Basri, G. 2003, AJ, 126, 1526
- Briceno et al. (2002) Briceno, C., Luhman, K. L., Hartmann, L., Stauffer, J. R., Kirkpatrick, J. D. 2002, ApJ, 580, 317
- Carciofi, Bjorkman, & Magalhaes (2004) Carciofi, A. C., Bjorkman, J. E., Magalhaes, A. M. 2004, ApJ, 604, 238
- Cardelli, Clayton, & Mathis (1989) Cardelli, J.A., Clayton, G.C., & Mathis, J.S. 1989, 345, 245
- Chiang et al. (2001) Chiang, E. I., Joung, M. K., Creech-Eakman, M. J., Qi, C., Kessler, J. E., Blake, G. A., van Dishoeck, E. F. 2001, ApJ, 547, 1077
- Chauvin et al. (2004) Chauvin, G., et al. 2004, A&A, 425, 29
- Comerón, Neuhäuser, & Kaas (2000) Comerón, F., Neuhäuser, R., Kaas, A. A., 2000, A&A, 359, 269
- Duschl, Gail, & Tscharnuter (1996) Duschl, W., Gail, H. -P., & Tscharnuter, W. 1996, A&A, 312, 624
- D’Alessio et al. (2006) D’Alessio, P., Calvet, N., Hartmann, L., Franco-Hernandez, R., Servin, H. 2006, ApJ, 638, 314
- D’Alessio et al. (1998) D’Alessio, P., Cantó, J., Calvet, N., & Lizano, S. 1998, ApJ, 500, 411
- Dullemond & Dominik (2004) Dullemond, C. P., Dominik, C. 2004, A&A, 421, 1075
- Fernández & Comerón (2001) Fernández, M., Comerón, F. 2001, A&A, 380, 264
- Goodwin, Whitworth, & Ward-Thompson (2004) Goodwin, S. P., Whitworth, A. P., Ward-Thompson, D. 2004, A&A, 414, 633
- Guieu et al. (2005) Guieu, S., Dougados, C., Monin. J.-L., Magnier, E., Martín, E. L. 2006, A&A, in press (astro-ph/0509317)
- Hauschildt, Allard, & Baron (1999) Hauschildt, P. H., Allard, F., Baron, E. 1999, ApJ, 512, 377
- Hayashi (1981) Hayashi, C. 1981, Prog. Theor. Phys. Suppl., 70, 35
- Heller (1995) Heller, C. H. 1995, ApJ, 455, 252
- Jayawardhana et al. (2003) Jayawardhana, R., Ardila, D. R., Stelzer, B., Haisch, K. E., Jr. 2003, AJ, 126, 1515
- Jayawardhana, Mohanty, & Basri (2003) Jayawardhana, R., Mohanty, S., Basri, G. 2003, ApJ, 592, 282
- Jayawardhana, Mohanty, & Basri (2002) Jayawardhana, R., Mohanty, S., Basri, G. 2002, ApJ, 578, 141
- Jayawardhana et al. (2002) Jayawardhana, R., Luhman, K. L., D’Alessio, P., Stauffer, J. R. 2002, ApJ, 571, 51
- Jensen & Mathieu (1997) Jensen, E. L. N., Mathieu, R. D. 1997, AJ, 114, 301
- Jensen, Mathieu, & Fuller (1996) Jensen, E. L. N., Mathieu, R. D., Fuller, G. A. 1996, ApJ, 458, 312
- Jensen, Mathieu, & Fuller (1994) Jensen, E. L. N., Mathieu, R. D., Fuller, G. A. 1994, ApJ, 429, 29
- Kim, Martin, & Hendry (1994) Kim, S.-H., Martin, P. G., & Hendry, P. D. 1994, ApJ, 422, 164
- Kirkpatrick et al. (2000) Kirkpatrick, J. D., Reid, I. N., Liebert, J., Gizis, J. E., Burgasser, A. J., Monet, D. G., Dahn, C. C., Nelson, B., Williams, R. J. 2000, AJ, 120, 447
- Klein et al. (2003) Klein, R., Apai, D., Pascucci, I., Henning, Th., Waters, L. B. F. M. 2003, ApJ, 593, 57
- Kraus, White, & Hillenbrand (2005) Kraus, A. L., White, R. J., Hillenbrand, L. A. 2005, ApJ, 633, 452
- Kroupa & Bouvier (2003) Kroupa, P., Bouvier, J. 2003, MNRAS, 346, 369
- Lada & Adams (1992) Lada C. J., Adams F. C. 1992, ApJ, 393, 278
- Luhman (2004) Luhman, K. L. 2004, ApJ, 617, 1216
- Luhman (2004) Luhman, K. L. 2004, ApJ, 614, 398
- Luhman et al. (2003a) Luhman, K. L., Stauffer, J. R., Muench, A. A., Rieke, G. H., Lada, E. A., Bouvier, J., Lada, C. J. 2003, ApJ, 593, 1093
- Luhman et al. (2003b) Luhman, K. L., Briceno, C., Stauffer, J. R., Hartmann, L., Barrado y Navascues, D., Caldwell, N. 2003, ApJ, 590, 348
- Mannings & Sargent (2000) Mannings, V., Sargent, A. I. 2000, ApJ, 529, 391
- Martín et al. (2003) Martín, E. L., Barrado y Navascues, D., Baraffe, I., Bouy, H., Dahm, S. 2003, ApJ, 594, 525
- Martín et al. (2001) Martín, E. L., Dougados, C., Magnier, E., Menard, F., Magazzu, A., Cuillandre, J.-C., Delfosse, X. 2001, ApJ, 561, 195
- Miyake & Nakagawa (1995) Miyake, K., Nakagawa, Y. 1995, ApJ, 441, 361
- Mohanty, Jayawardhana, & Basri (2005) Mohanty, S., Jayawardhana, R., Basri, G. 2005, ApJ, 626, 498
- Mohanty et al. (2004) Mohanty, S., Jayawardhana, R., Natta, A., Fujiyoshi, T., Tamura, M., Barrado y Navascués, D. 2004, ApJ, 609, 33
- Moraux et al. (2003) Moraux, E., Bouvier, J., Stauffer, J. R., Cuillandre, J.-C. 2003, A&A, 400, 891
- Muench et al. (2001) Muench, A. A., Alves, J., Lada, Ch. J., Lada, E. A. 2001, ApJ, 558, 51
- Muzerolle et al. (2003) Muzerolle, J., Hillenbrand, L., Calvet, N., Briceno, C., & Hartmann, L. 2003, ApJ, 592, 266
- Nakajima et al. (1995) Nakajima, T., Oppenheimer, B. R., Kulkarni, S. R., Golimowski, D. A., Matthews, K., Durrance, S. T. 1995, Nature, 378, 463
- Natta et al. (2002) Natta, A., Testi, L., Comerón, F., Oliva, E., D’Antona, F., Baffa, C., Comoretto, G., Gennari, S. 2002, A&A, 393, 597
- Natta, Grinin, & Mannings (2000) Natta, A., Grinin, V., Mannings, V. 2000, Protostars and Planets IV, University of Arizona Press, 559
- Nuernberger et al. (1998) Nuernberger, D., Brandner, W., Yorke, H. W., Zinnecker, H. 1998, A&A, 330, 549
- Nuernberger, Chini, & Zinnecker (1997) Nuernberger, D., Chini, R., Zinnecker, H. 1997, A&A, 324, 1036
- Ossenkopf & Henning (1994) Ossenkopf, V., Henning, Th. 1994,A&A, 291, 943
- Osterloh & Beckwith (1995) Osterloh, M., Beckwith, S. V. W. 1995, ApJ, 439, 288
- O’Sullivan et al. (2005) O’Sullivan, M., Truss, M., Walker, Ch., Wood, K., Matthews, O., Whitney, B., Bjorkman, J. E. 2005, MNRAS, 358, 632
- Padoan & Nordlund (2004) Padoan, P., Nordlund, A. 2004, ApJ, 617, 559
- Pascucci et al. (2003) Pascucci, I., Apai, D., Henning, Th., Dullemond, C. P. 2003, ApJ, 590, 111
- Pickett et al. (2000) Pickett, B. K., Durisen, R. H., Cassen, P., Mejia, A. C. 2000, ApJ, 540, 95
- Rebolo, Zapatero Osorio, & Martín (1995) Rebolo, R., Zapatero Osorio, M. R., Martín, E. L. 1995, Nature, 377, 129
- Reipurth & Clarke (2001) Reipurth, B., Clarke, C. 2001, AJ, 122, 432
- Schneider et al. (2003) Schneider, G., Wood, K., Silverstone, M. D., Hines, D. C., Koerner, D. W., Whitney, B. A., Bjorkman, J. E., Lowrance, P. J. 2003, AJ, 125, 1467
- Scholz & Jayawardhana (2006) Scholz, A., Jayawardhana, R. 2006, ApJ, 638, 1056
- Shakura & Sunyaev (1973) Shakura N. I., Sunyaev R. A. 1973, A&A, 24, 337
- Shirley et al. (2000) Shirley, Y. L., Evans, N. J., II, Rawlings, J. M. C., Gregersen, E. M. 2000, ApJS, 131, 249
- Skinner (1996) Skinner, C. J. 1996, STScI, Instrument Science Report for NICMOS-014
- Testi et al. (2002) Testi, L., Natta, A., Oliva, E., D’Antona, F., Comeron, F., Baffa, C., Comoretto, G., Gennari, S. 2002, ApJ, 571, 155
- Vinkovic et al. (2006) Vinkovic, D., Ivezic, Z., Jurkic, T., Elitzur, M. 2006, ApJ, 636, 348
- Walker et al. (2004) Walker, C., Wood, K., Lada, C. J., Robitaille, T., Bjorkman, J. E., & Whitney, B. 2004, MNRAS, 351, 607
- Whitworth & Goodwin (2005) Whitworth, A. P., Goodwin, S. P. 2005, Mem. Soc. Astron. Italiana, 76, 211
- Whitworth & Zinnecker (2004) Whitworth, A. P., Zinnecker, H. 2004, A&A, 427, 299
- Wichmann et al. (1998) Wichmann, R., Bastian, U., Krautter, J., Jankovics, I., Rucinski, S. M. 1998, MNRAS, 301, 39
- Wolf (2003) Wolf, S. 2003, ApJ, 582, 859
- Wood et al. (2002) Wood K., Wolff M. J., Bjorkman J. E., & Whitney B. A. 2002, ApJ, 564,887
| Full name | SpT | Int. time | 1.3 mm flux | Disk massaaUpper limits are based on 2 flux upper limits. Errors correspond to 1 flux uncertainties, and do not include errors in dust temperature, opacity, and distance. | Object mass | disk mass rangebbEstimated by varying dust temperature, opacity, and object distance within the limits discussed in Sect. 3.1 |
|---|---|---|---|---|---|---|
| (min) | (mJy) | () | () | () | ||
| KPNOTau1 | M8.5 | 62 | 0.026 | |||
| KPNOTau2 | M7.5 | 60 | 0.052 | |||
| KPNOTau4 | M9.5 | 55 | 0.014 | |||
| KPNOTau5 | M7.5 | 52 | 0.052 | |||
| KPNOTau6 | M8.5 | 86 | 0.026 | |||
| KPNOTau7 | M8.3 | 51 | 0.030 | |||
| KPNOTau9 | M8.5 | 48 | 0.026 | |||
| KPNOTau12 | M9 | 66 | 0.016 | |||
| CFHTBDT1 | M7 | 41 | 0.085 | |||
| CFHTBDT2 | M8 | 47 | 0.036 | |||
| CFHTBDT3 | M9 | 52 | 0.016 | |||
| CFHTBDT4 | M7 | 51 | 0.085 | |||
| J041411+2811 | M6.25 | 74 | 0.095 | |||
| J043800+2558 | M7.25 | 59 | 0.065 | |||
| J043814+2611 | M7.25 | 81 | 0.065 | |||
| J043903+2544 | M7.25 | 59 | 0.065 | |||
| J044148+2534 | M7.75 | 69 | 0.040 | |||
| J044427+2512 | M7.25 | 41 | 0.065 | |||
| J045523+3027 | M6.25 | 29 | 0.095 | |||
| J045749+3015 | M9.25 | 82 | 0.015 |
| Full name | |||||||||||
|---|---|---|---|---|---|---|---|---|---|---|---|
| (K) | () | () | () | (AU) | () | () | |||||
| CFHTBDT4 | 2900 | 1.2 | 0.10 | 100 | 0.02 | 0.04 | 0.03 | 1.15 | 20 | 3.245 | |
| 2900 | 1.2 | 0.10 | 10 | 0.02 | 0.04 | 0.03 | 1.15 | 20 | 3.245 | ||
| 2900 | 1.2 | 0.10 | 1.0 | 1 | 0.02 | 0.035 | 1.15 | 20 | 3.245 | ||
| J043814+2611 | 3100 | 1.9 | 100 | 0.03 | 0.06 | 0.03 | 1.25 | 80 | 1.0 | ||
| J043903+2544 | 2838 | 0.6 | 0.06 | 100 | 0.03 | 0.04 | 0.03 | 1.15 | 20 | 0.1 | |
| 2838 | 0.6 | 0.06 | 10 | 0.03 | 0.04 | 0.03 | 1.15 | 20 | 0.1 | ||
| 2838 | 0.6 | 0.06 | 1.0 | 1 | 0.03 | 0.04 | 1.15 | 20 | 0.1 | ||
| J044148+2534 | 2838 | 0.42 | 0.04 | 100 | 0.05 | 0.07 | 0.03 | 1.15 | 20 | 1.5 | |
| 2838 | 0.42 | 0.04 | 10 | 0.04 | 0.06 | 0.03 | 1.15 | 20 | 1.5 | ||
| 2838 | 0.42 | 0.04 | 1.0 | 1 | 0.04 | 0.06 | 1.15 | 20 | 1.5 | ||
| J044427+2512 | 2900 | 1.4 | 0.05 | 100 | 0.05 | 0.05 | 0.03 | 1.15 | 62.5 | 1.0 | |
| 2900 | 1.4 | 0.05 | 10 | 0.05 | 0.05 | 0.03 | 1.15 | 62 | 1.0 | ||
| 2900 | 1.4 | 0.05 | 1. | 1 | 0.05 | 0.05 | 1.15 | 59 | 1.0 | ||
| CFHTBDT2 | 2700 | 0.61 | 2.0 |