Integrated specific star formation rates of galaxies, groups, and clusters: A continuous upper limit with stellar mass?††thanks: Based on observations collected at the Centro Astronómico Hispano Alemán (CAHA), operated by the Max-Planck-Institut für Astronomie, Heidelberg, jointly with the Spanish National Commission for Astronomy.,††thanks: Based on observations collected at the European Southern Observatory, Chile; ESO proposals 63.O-0005, 64.O-0149, 64.O-0158, 64.O-0229, 64.P-0150, 65.O-0048, 65.O-0049, 66.A-0123, 66.A-0129, 66.A-0547, 68.A-0013, 69.A-0014, and LP168.A-0485.
Abstract
Aims. We investigate the build-up of stellar mass through star formation in field galaxies, galaxy groups, and clusters in order to better understand the physical processes regulating star formation in different haloes.
Methods. In order to do so we relate ongoing star formation activity to the stellar mass by studying the integrated specific star formation rate (SSFR), defined as the star-formation rate per unit stellar mass, as a function of integrated stellar mass for samples of field galaxies, groups of galaxies, and galaxy clusters at . The star formation rate (SFR) is derived from the ultraviolet continuum for the galaxies and group members, and from emission line fluxes for the cluster galaxies. The stellar masses are computed from multi-band photometry including the near-infrared bands for the galaxies and groups, and from the dynamical mass for the cluster sample.
Results. For the first time, integrated SSFRs for clusters and groups are presented and related to the SSFRs of field galaxies. Tentatively, we find a continuous upper limit for galaxies, groups, and clusters in the SSFR-stellar mass plane over seven orders of magnitude in stellar mass. This might indicate that the physical processes which control star formation in dark matter haloes of different mass have the same scaling with mass over a wide range of masses from dwarf galaxies to massive clusters of galaxies.
Key Words.:
Galaxies: evolution – galaxies: formation – galaxies: fundamental parameters – galaxies: high redshift – galaxies: clusters: general1 Introduction
In 1996, Cowie et al. investigated the contribution of star formation to the build-up of stellar mass for different galaxy masses. They found that at higher redshifts a population of massive, heavily star forming galaxies emerges which cannot be found in the local universe, a phenomenon they termed “down-sizing”. This, in turn, implies that the more massive galaxies found in today’s universe have older stellar populations. After this pioneering work the specific star formation rate (SSFR), defined as the star formation rate (SFR) per unit stellar mass, was used to study this connection and to follow its evolution with redshift. It is now well established that galaxies show an SSFR falling with stellar mass with a clear upper limit in SSFR (Guzman et al., 1997; Brinchmann & Ellis, 2000; Pérez-González et al., 2003; Brinchmann et al., 2004; Fontana et al., 2003; Bauer et al., 2005; Bell et al., 2005), with a fraction of strongly star-forming galaxies at high SSFRs (Bell et al., 2005; Hammer et al., 2005; Pérez-González et al., 2005). Moreover, the most massive galaxies are dominated by the oldest stellar populations (Drory et al., 2005; Feulner et al., 2005b) and show a marked increase of their mean SSFR around (Feulner et al., 2005a; Juneau et al., 2005).
Similar studies on the star formation rate in clusters of galaxies have been carried out during the last decade finding a decrease of the integrated SFR per unit dynamical mass with mass (Finn et al., 2004, 2005) or, in some sense equivalently, a falling fraction of [OII]-emitting galaxies with velocity dispersion (Poggianti et al., 2006). For the cluster members, evidence was found for a down-sizing scenario similar to the field (e.g. Smail et al., 1998; Tanaka et al., 2005; Poggianti et al., 2006).
For galaxy groups, systematic studies are still rare, although several studies of star-formation activity as a function of environment have been performed (Hashimoto et al., 1998; Balogh et al., 2004; Wilman et al., 2005). Recently, Weinmann et al. (2006) presented SSFRs for galaxies in SDSS groups showing a decline of the SSFR with halo mass.
In this work we try to combine information on the SSFR of field galaxies with the integrated SSFR of galaxy groups and clusters to investigate the build-up of stellar mass in haloes over a wide range of masses from dwarf galaxies to massive clusters. Studies like these are important to better constrain the physical processes responsible for controlling star formation in different environments and thus haloes of different masses.
This Letter is organised as follows. In Sect. 2 we describe the galaxy, group, and cluster samples as well as our methods to derive SFRs and stellar masses. Section 3 presents our results on the distribution of the different samples in the SSFR-stellar mass plane, before we discuss and summarise our work in Sect. 4. Throughout this Letter we assume a concordance cosmology with , and . All magnitudes are given in the Vega system.
2 Deriving star formation rates and stellar masses for the different samples
2.1 The field galaxy sample
The field galaxies used in this study are taken from a combined sample
derived from the FORS Deep Field (Heidt et al., 2003; Gabasch et al., 2004a) and the GOODS-S
field. It is the same sample already used and discussed in
Feulner et al. (2005a). The FDF offers photometry in the , , , ,
, 834 nm, , and bands and is complimented by deep
spectroscopic observations (Noll et al., 2004). In this Letter we use the
-selected sub-sample covering the deep central part of the field
( 40 arcmin2) as described in Gabasch et al. (2004a), containing 5557
galaxies down to (50% completeness limit for point
sources). Photometric redshifts of FDF galaxies have an
accuracy of (Gabasch et al., 2004a).
Our -band selected catalogue for the GOODS-S field
(Salvato et al., 2006) is based on the publicly available 8
arcmin2 , , and VLT/ISAAC images
complimented by observations in , , , , and . The
sample contains 3237 galaxies with a photometric redshift accuracy of
down to over a field of view of
50 arcmin2.
For both fields, SFRs are derived from the luminosity of
the ultraviolet continuum at Å (Gabasch et al., 2004b)
converting it to an SFR (in units of solar
masses per year) as described in Madau et al. (1998) and assuming a
Salpeter initial mass function (Salpeter, 1955)
| (1) |
while stellar masses (in units of solar masses) are computed from fitting stellar population synthesis models to the galaxies’ broad-band photometry (Drory et al., 2004). A standard correction for dust extinction is applied to the SFR following the recipe of Hopkins (2004). The SSFR is then simply calculated from
| (2) |
To ensure fair comparison with the cluster sample described below we have restricted the redshift range for the field galaxies to yielding 2898 objects with an average redshift of . Note that within this interval the fraction of undetected dusty star-forming galaxies is still small (Franceschini et al., 2003).
2.2 The galaxy group sample
The integrated SSFRs and stellar masses for the groups are based on
the Munich Near-Infrared Cluster Survey (MUNICS; Drory et al. 2001; Feulner et al. 2003), a wide-area, medium deep photometric and spectroscopic
survey in the , , , , , and bands covering an area
of about 0.3 square degrees down to and
(50% completeness limit for point sources). Group membership on the
photometric redshift catalogue with its accuracy of is assigned according to a modified version of the
friends-of-friends algorithm, specifically designed to cope with
photometric redshift datasets (Botzler et al., 2004). The resulting
structure catalogue is presented in Botzler et al. (2006) and comprises 162
structures (mostly groups) containing 890 galaxies in total.
SFRs and stellar masses for the individual group members are computed
in the same manner as for the field galaxies described above (see also
Feulner et al. 2005b) and summed for each group, resulting in what we
call integrated values. To ensure fair comparison with the
cluster sample described below we have restricted the redshift range
for the groups to leaving us with 137 groups
containing 710 galaxies with an average redshift of .
2.3 The cluster sample
Since the survey volume probed by MUNICS is too small to contain massive clusters, integrated SFRs and stellar masses for galaxy clusters are obtained from the sample described in Finn et al. (2004, 2005) who derive SFRs from the H line emission. The sample contains 8 clusters at with SFR measurements of galaxies, usually within the virial radius. The average redshift of the sample is . Their integrated SFR values are corrected for dust extinction using . Since no measurements for the total stellar mass of the clusters are available, we compute this quantity from the dynamical mass (derived from the cluster velocity dispersion). To accomplish this we make use of the relation between the stellar mass and the dynamical mass within the radius (within which the mean density is 500 times the critical density) derived by Lin et al. (2003) from -band observations of local clusters:
| (3) |
To convert the values of given in Finn et al. (2005) to we use the following relation for the dynamical mass as a function of the density contrast (Horner et al., 1999):
| (4) |
Estimating the integrated SFR and stellar mass of galaxy clusters in a different manner than for the galaxies and groups is, of course, not optimal; for future studies it would be desirable to derive the SFRs and the masses using the same methods.
3 Star formation and stellar mass in field galaxies, groups, and clusters
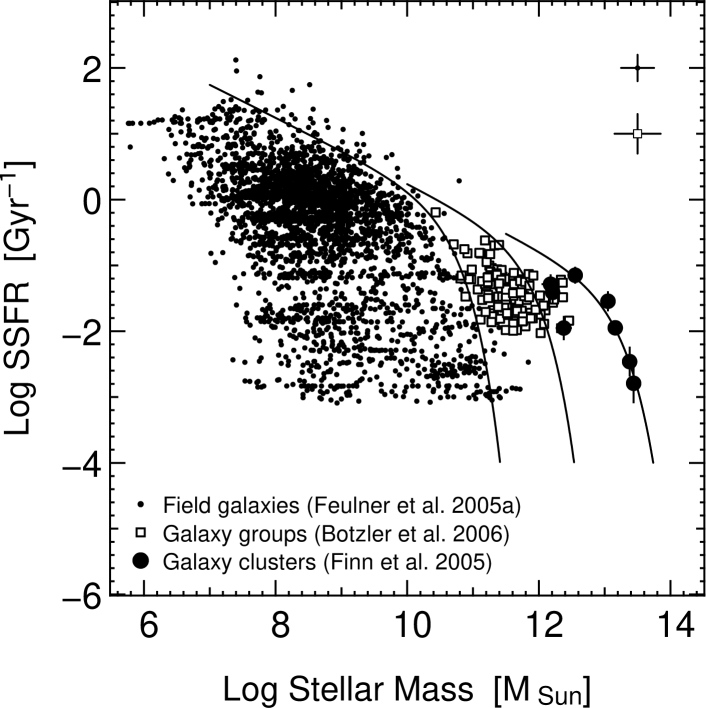
In Fig. 1 we present the resulting integrated SSFR versus stellar mass diagram for field galaxies, groups, and clusters of galaxies. For groups and clusters, this quantity has – to our knowledge – not been presented before, while it has been previously shown for field galaxies (e.g. Feulner et al., 2005a, and references therein). For the first time the distribution of field galaxies, groups, and clusters in this diagnostic diagram can be studied in context.
It is now well established that the SSFR of field galaxies is decreasing with increasing stellar mass. This trend holds up to stellar masses of where we reach the high-mass cut-off of the stellar mass function in the redshift range (e.g. Fontana et al., 2004; Drory et al., 2005).
Interestingly, the integrated SSFRs of groups and clusters continue this trend to higher stellar masses. The limiting SSFR of the groups from MUNICS follow the same sequence up to , reaching the SSFRs of clusters with at the very end of this sequence. Groups and clusters seem to form a natural extension of the SSFR distribution of galaxies, with the upper limit shaping a continuous sequence over at least seven orders of magnitude in stellar mass. It is not surprising that there is some overlap between very massive galaxies and poor groups as well as between massive groups and poor clusters. The slightly smaller values for the integrated SSFRs of the MUNICS groups could be attributed to the selection of the group members in photometric redshift space; the algorithm might miss some members in the outer regions more likely to be star-forming galaxies. Note also that due to the near-infrared selection the MUNICS group sample may be biased against high-SFR galaxies with low dust attenuation.
For easier analysis, the approximate upper boundaries to the SSFR for the different samples in Fig. 1 can be described by the following functional form (similar to the Schechter parametrisation of the luminosity function, Schechter 1976):
| (5) |
The free parameters of this function describe the normalisation (), the location of the break (), and the slope at lower stellar masses (). Their approximate values are for the field galaxies, for the groups, and for the clusters. The slope can be derived from the field-galaxy sample only but seems to apply also to the other samples. The curves corresponding to these values are plotted in Fig. 1. Note, again, that there is a smooth transition from groups to clusters, so the upper mass limit for groups should be taken with a grain of salt.
4 Discussion and conclusions
In this Letter we have for the first time presented the integrated SSFR for groups and clusters of galaxies and compared it to the SSFR of the field galaxy population. Moreover, we tentatively find a continuous upper limit for galaxies, groups, and clusters in the SSFR-stellar mass plane over seven orders of magnitude in stellar mass. This might indicate that the processes which control star formation in dark matter haloes of different mass have the same scaling with mass over a wide range of masses from dwarf galaxies to massive clusters of galaxies.
The physical processes responsible for the “down-sizing” phenomenon witnessed in individual galaxies are not yet well understood. An early formation epoch for massive galaxies or “dry merging” (Faber et al., 2006; Bell et al., 2006) of lower-mass galaxies as well as quenching of star formation in more massive haloes by feedback mechanisms (e.g. Scannapieco et al., 2005) are among the discussed possibilities. Of course, we could also see the result of a combination of these processes or be faced with different evolutionary paths leading to the population of massive galaxies with old stellar populations.
The fact that the integrated SSFRs of groups and clusters of galaxies seem to continue the trend displayed by the field galaxy population towards higher masses is intriguing. For the individual galaxies within these structures, one can naturally expect a similar general behaviour as for their counterparts in the field, modified by environmental effects. It has been known for a long time that higher density environments are occupied by galaxies with morphologically earlier types (e.g. Dressler, 1980; Postman & Geller, 1984; Dressler et al., 1997) and with overall redder colours (and thus lower star-formation activity; Butcher & Oemler 1978). Moreover, ellipticals in higher-density environments are on average older than their low-density counterparts (Thomas et al., 2005), and star formation activity in groups seems to be lower than in the field (Wilman et al., 2005). But the fact that the upper limit of the integrated SSFRs of all these objects, from dwarf galaxies to rich clusters, seems to follow a continuous sequence in the SSFR–stellar mass plane seems to suggest that there could be a smooth transition from the field to the clusters, which in turn might imply that the physical processes responsible for the lower integrated star formation activity in higher mass haloes are the same over this wide range of stellar masses, or at least have the same scaling with stellar mass.
The analysis presented here is made possible by the availability of large samples of field galaxies with well studied properties, and by the advent of group and cluster catalogues with photometric and spectroscopic data for large number of members. However, statistics is still rather poor for groups and clusters, and we could not derive SFRs and stellar masses using the same methods in all samples. Future studies of large and homogeneous samples of groups, clusters and their member galaxies will result in progress in the study of galaxy evolution as a function of local density, and allow us to better constrain the physical processes responsible for controlling star formation in different environments and thus haloes of different masses.
Acknowledgements.
The authors thank R. Bender and C. Mendes de Oliveira for helpful suggestions, J. Snigula for assistance with the structure catalogue, N. Drory for making his mass-fitting code available, A. Gabasch as well as M. Salvato for their work on FDF and GOODS-S, and the anonymous referee for his comments. G.F. and C.S.B. acknowledge funding by the DFG, G.F. also by the MPG.References
- Balogh et al. (2004) Balogh, M., Eke, V., Miller, C., et al. 2004, MNRAS, 348, 1355
- Bauer et al. (2005) Bauer, A. E., Drory, N., Hill, G. J., & Feulner, G. 2005, ApJ, 621, L89
- Bell et al. (2005) Bell, E. F., Papovich, C., Wolf, C., et al. 2005, ApJ, 625, 23
- Bell et al. (2006) Bell, E. F. et al. 2006, ApJ, in press, astro-ph/0506425
- Botzler et al. (2006) Botzler, C., Snigula, J., Bender, R., et al. 2006, MNRAS, submitted
- Botzler et al. (2004) Botzler, C. S., Snigula, J., Bender, R., & Hopp, U. 2004, MNRAS, 349, 425
- Brinchmann et al. (2004) Brinchmann, J., Charlot, S., White, S. D. M., et al. 2004, MNRAS, 351, 1151
- Brinchmann & Ellis (2000) Brinchmann, J. & Ellis, R. S. 2000, ApJ, 536, L77
- Butcher & Oemler (1978) Butcher, H. & Oemler, A. 1978, ApJ, 219, 18
- Cowie et al. (1996) Cowie, L. L., Songaila, A., Hu, E. M., & Cohen, J. G. 1996, AJ, 112, 839
- Dressler (1980) Dressler, A. 1980, ApJ, 236, 351
- Dressler et al. (1997) Dressler, A., Oemler, A. J., Couch, W. J., et al. 1997, ApJ, 490, 577
- Drory et al. (2004) Drory, N., Bender, R., & Hopp, U. 2004, ApJ, 616, L103
- Drory et al. (2001) Drory, N., Feulner, G., Bender, R., et al. 2001, MNRAS, 325, 550
- Drory et al. (2005) Drory, N., Salvato, M., Gabasch, A., et al. 2005, ApJ, 619, L131
- Faber et al. (2006) Faber, S. M. et al. 2006, ApJ, submitted, astro-ph/0506044
- Feulner et al. (2003) Feulner, G., Bender, R., Drory, N., et al. 2003, MNRAS, 342, 605
- Feulner et al. (2005a) Feulner, G., Gabasch, A., Salvato, M., et al. 2005a, ApJ, 633, L9
- Feulner et al. (2005b) Feulner, G., Goranova, Y., Drory, N., Hopp, U., & Bender, R. 2005b, MNRAS, 358, L1
- Finn et al. (2004) Finn, R. A., Zaritsky, D., & McCarthy, D. W. 2004, ApJ, 604, 141
- Finn et al. (2005) Finn, R. A., Zaritsky, D., McCarthy, D. W., et al. 2005, ApJ, 630, 206
- Fontana et al. (2003) Fontana, A., Donnarumma, I., Vanzella, E., et al. 2003, ApJ, 594, L9
- Fontana et al. (2004) Fontana, A., Pozzetti, L., Donnarumma, I., et al. 2004, A&A, 424, 23
- Franceschini et al. (2003) Franceschini, A., Berta, S., Rigopoulou, D., et al. 2003, A&A, 403, 501
- Gabasch et al. (2004a) Gabasch, A., Bender, R., Seitz, S., et al. 2004a, A&A, 421, 41
- Gabasch et al. (2004b) Gabasch, A., Salvato, M., Saglia, R. P., et al. 2004b, ApJ, 616, L83
- Guzman et al. (1997) Guzman, R., Gallego, J., Koo, D. C., et al. 1997, ApJ, 489, 559
- Hammer et al. (2005) Hammer, F., Flores, H., Elbaz, D., et al. 2005, A&A, 430, 115
- Hashimoto et al. (1998) Hashimoto, Y., Oemler, A. J., Lin, H., & Tucker, D. L. 1998, ApJ, 499, 589
- Heidt et al. (2003) Heidt, J., Appenzeller, I., Gabasch, A., et al. 2003, A&A, 398, 49
- Hopkins (2004) Hopkins, A. M. 2004, ApJ, 615, 209
- Horner et al. (1999) Horner, D. J., Mushotzky, R. F., & Scharf, C. A. 1999, ApJ, 520, 78
- Juneau et al. (2005) Juneau, S., Glazebrook, K., Crampton, D., et al. 2005, ApJ, 619, L135
- Lin et al. (2003) Lin, Y.-T., Mohr, J. J., & Stanford, S. A. 2003, ApJ, 591, 749
- Madau et al. (1998) Madau, P., Pozzetti, L., & Dickinson, M. 1998, ApJ, 498, 106
- Noll et al. (2004) Noll, S., Mehlert, D., Appenzeller, I., et al. 2004, A&A, 418, 885
- Pérez-González et al. (2003) Pérez-González, P. G., Gil de Paz, A., Zamorano, J., et al. 2003, MNRAS, 338, 525
- Pérez-González et al. (2005) Pérez-González, P. G., Rieke, G. H., Egami, E., et al. 2005, ApJ, 630, 82
- Poggianti et al. (2006) Poggianti, B. M. et al. 2006, ApJ, in press, astro-ph/0512391
- Postman & Geller (1984) Postman, M. & Geller, M. J. 1984, ApJ, 281, 95
- Salpeter (1955) Salpeter, E. E. 1955, ApJ, 121, 161
- Salvato et al. (2006) Salvato, M., Gabasch, A., Hopp, U., et al. 2006, A&A, submitted
- Scannapieco et al. (2005) Scannapieco, E., Silk, J., & Bouwens, R. 2005, ApJ, 635, L13
- Schechter (1976) Schechter, P. 1976, ApJ, 203, 297
- Smail et al. (1998) Smail, I., Edge, A. C., Ellis, R. S., & Blandford, R. D. 1998, MNRAS, 293, 124
- Tanaka et al. (2005) Tanaka, M., Kodama, T., Arimoto, N., et al. 2005, MNRAS, 362, 268
- Thomas et al. (2005) Thomas, D., Maraston, C., Bender, R., & de Oliveira, C. M. 2005, ApJ, 621, 673
- Weinmann et al. (2006) Weinmann, S. M., van den Bosch, F. C., Yang, X., & Mo, H. J. 2006, MNRAS, 366, 2
- Wilman et al. (2005) Wilman, D. J., Balogh, M. L., Bower, R. G., et al. 2005, MNRAS, 358, 71