Recent star formation in the inner Galactic Bulge seen by ISOGAL ††thanks: This is paper no. 23 in a refereed journal based on data from the ISOGAL project.,††thanks: Based on observations with ISO, an ESA project with instruments funded by ESA Member States (especially the PI countries: France, Germany, the Netherlands and the United Kingdom) and with the participation of ISAS and NASA.
Abstract
Context. The stellar populations in the central region of the Galaxy are poorly known because of the high visual extinction and very great source density in this direction.
Aims. To use recent infrared surveys for studying the dusty stellar objects in this region.
Methods. We analyse the content of a arcmin2 field centred at observed at 7 and 15 m as part of the ISOGAL survey. These ISO observations are more than an order of magnitude better in sensitivity and spatial resolution than the IRAS observations. The sources are cross-associated with other catalogues to identify various types of objects. We then derive criteria to distinguish young objects from post-main sequence stars.
Results. We find that a sample of about 50 young stellar objects and ultra-compact Hii regions emerges, out of a population of evolved AGB stars. We demonstrate that the sources colours and spatial extents, as they appear in the ISOGAL catalogue, possibly complemented with MSX photometry at 21 m, can be used to determine whether the ISOGAL sources brighter than 300 mJy at 15 m (or [15]4.5 mag) are young objects or late-type evolved stars.
Key Words.:
Galaxy:Centre - Stars:formation - Stars:variables:general - Infrared:stars1 Introduction
The ISOGAL survey is a large set of observations of the inner Galaxy at 7 and 15 m (Omont et al. PSC_AO (2003), Schuller et al. PSC_FS (2003)), obtained with the ISOCAM instrument on board the ISO satellite (Cesarsky et al. ISOCAM (1996)). The ISOGAL fields are distributed along the Galactic plane, mostly in the range. The achieved sensitivity is about 10 mJy in most fields in the Galactic Disk, and of order 20–30 mJy in the fields observed with narrow filters and 3′′ pixels, including the Galactic Centre region, and thus the observations discussed in the present paper. The catalogues of more than extracted point sources have been systematically cross-identified with the near infrared DENIS data (Epchtein et al. ref-denis2 (1997)), resulting in the ISOGAL–DENIS Point Source Catalogue (PSC), which provides measurements at 7 and/or 15 m, together with up to three near infrared bands (, and ). The astrometric accuracy is better than 0.5′′ for sources with a DENIS counterpart, and of order 2′′ for sources without.
The analysis of various individual ISOGAL fields in the Galactic disk and bulge have shown that the bulk of the detected stellar population is composed of AGB and late RGB stars (see references in Omont et al. PSC_AO (2003)). They show a rather well defined sequence in the [15] vs. [7]–[15] colour magnitude diagram, in good agreement with the colours expected for such objects (Fig. 2). On the other hand, a few thousand ISOGAL sources can be interpreted as young stellar objects or young massive stars (hereafter young objects) deeply embedded in dusty envelopes or thick disks. Theoretical models, as well as a systematic analysis of ISOGAL images and catalogues, enabled us (Felli et al. FELLI2000 (2000), Felli2002 (2002); Schuller ref-myPhD (2002)) to define criteria to roughly distinguish candidate young objects from the bulk of post-main sequence stars in the [15] vs. [7]–[15] diagram.
The ISOGAL FC–00027–00006 field (hereafter called FC–027), centred at (,) = , is located very close to the Galactic Centre, between Sgr A∗ and Sgr C, in a region of strong diffuse emission at infrared and radio wavelengths. The visual extinction in this field ranges from 20 to more than 35 magnitudes (Schultheis et al. SCHULTHE (1999)), and the photometry must be corrected carefully in order to interpret the observed magnitudes and colours properly, especially in the near infrared. However, the [7]–[15] colours cannot be affected by more than 1 mag of interstellar extinction (see Fig. 2).
We will show in the present paper that, in spite of the extinction, the nature of the bright sources (with magnitudes at 15 m [15] 4.5, equivalent to flux densities above 280 mJy) can be inferred from the raw data, as they appear in the ISOGAL PSC. The bulk of the brightest sources can be identified with various classes of objects (long period variable stars, OH/IR stars, ultra-compact Hii regions). The mid-infrared properties (especially the [7]–[15] colour and spatial extension at 15 m) of young objects (YSOs and Hii regions) are quite different from those observed for late-type stars. This leads to robust selection criteria for extracting the young population from the ISOGAL PSC (see also Lumsden et al. ref-lumsden (2002) for a similar analysis based on the MSX data). These criteria will be used to make a census of such objects in all ISOGAL fields covering the inner Galactic Bulge in a forthcoming paper, where we will estimate their luminosities, taking into account extinction corrections.
The ISOGAL data are briefly presented in Sect. 2. We then show in Sect. 3 that most ISOGAL bright sources can be associated with known objects, in particular long period variable stars, radio-sources, or infrared sources from the IRAS and MSX point source catalogues. Our main results, consisting of criteria to select young sources from the ISOGAL catalogue, are summarised and used to extract luminous young candidate objects without known counterparts from the whole FC–027 field in Sect. 4.
2 ISOGAL observations
A complete description of the ISOGAL observations, their processing and the creation of the Point Source Catalogue (PSC) can be found in Schuller et al. (PSC_FS (2003)). In the present paper, we analyse the source content of the FC–027 field. We confine our analysis to the formal limits of this field, or the “regular” catalogue (as opposed to the “edge” catalogue, see Schuller et al. PSC_FS (2003)), which covers 18.517 arcmin2 (0.09 deg2) centred at . Namely, the present paper deals with the area defined by:
| (1) |
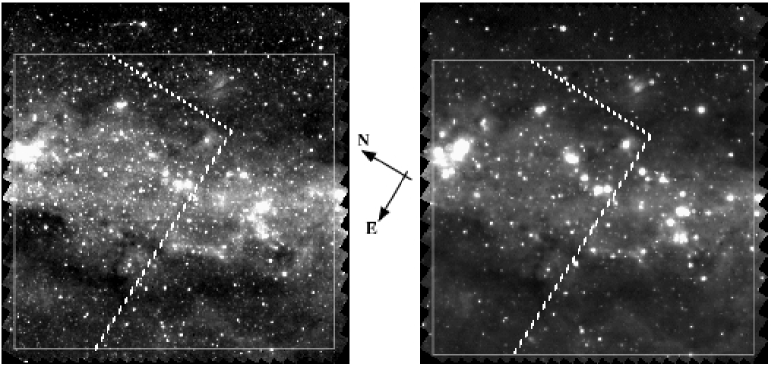
This field was observed with the narrow filters LW5 (6.5-7.1 m) and LW9 (13.9-15.9 m), using pixels of 3′′ field of view (see the raster images in Fig. 1). The 7 m image was observed on 1996, Sept. 24, while the 15 m observation was done on 1998, Feb. 19, so that variability can affect the observed colours. Point sources were extracted from the 7 m and 15 m observations down to magnitudes 8.4 at 7 m (35 mJy), and 7.0 at 15 m (28 mJy), corresponding to roughly 50% completeness (Schuller et al. PSC_FS (2003)). About 90% of the sources also have DENIS (Epchtein et al. ref-denis2 (1997)) near-infrared counterparts, with magnitudes brighter than 11.3. Fainter DENIS sources were not considered in order to reduce the fraction of chance associations, so that a few faint near-infrared counterparts may have been missed. Altogether, we estimated that no more than 1% of ISO–DENIS associations should be wrong.
3 Identification of known sources
In this Section, we will show how ISOGAL point sources can be associated with sources from various catalogues, taken from the abundant literature dealing with the centre of the Galaxy. In particular, we will focus on: long period variable stars (LPVs) and OH/IR stars (Sect. 3.1), radio sources detected in the cm continuum (Sect. 3.2), the IRAS Point Source Catalogue (Sect. 3.3) and the MSX Point Source Catalogue (Sect. 3.4). Additional results derived from specific near infrared spectroscopic observations are discussed in Sect. 3.5. The main results outlined from this compilation of data are summarised in Sect. 3.6.
3.1 Late evolved stars
As in the other ISOGAL fields, the huge majority of the detected point sources in the FC–027 field are luminous late-type giants toward the end of the red giant phase, mostly in the AGB phase (Omont et al. OMONT1 (1999), Glass et al. GLASS (1999), Ojha et al. ref-ojha (2003), van Loon et al. ref-JvL (2003)). Their photospheres are bright emitters in the near-infrared, and many of them are surrounded by dusty circumstellar envelopes due to mass loss. The dust grains absorb the stellar radiation and re-emit in the mid-infrared, so that these stars are bright in mid-infrared images. Most of these sources are variable (Alard et al. ref-alard (2001)), and we have been able to find ISOGAL counterparts to variable stars of different classes (Miras, OH/IR, other long period variables).
Glass et al. (GLASS2 (2001)) have monitored an area of 24x24 arcmin2 centred at the Galactic Centre over four years, in the K band, in search of variable stars. Their surveyed area overlaps the FC–027 field by 0.042 deg2, or nearly one half the ISOGAL field (see Fig. 1). In this overlap area, they found 110 long period variable stars (hereafter LPVs).
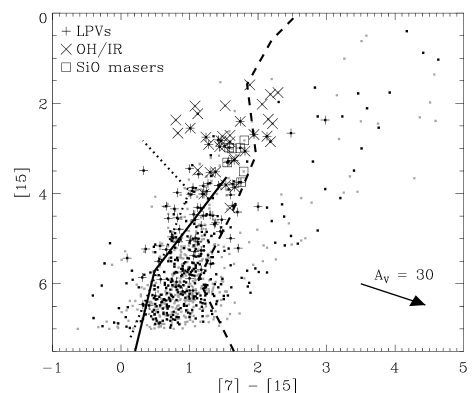
Among these 110 LPVs, 97 are associated with ISOGAL sources within a 5′′ search radius, 89 of which are detected at both 7 and 15 m. These have [7]–[15] colours mostly around 1 mag, along a sequence spanning the range 3 to 6 mag at 15 m (Fig. 2). However, a few 0.1 mag in the observed colours may be due to variability, because of the 1.5 year delay between the 7 m and 15 m observations. Blending effects may also introduce errors in the [7]–[15] colours. Most of the 13 LPVs without association appear as faint objects at 7 m. Confusion with the bright diffuse background, added to the high source density in this field, explain these peculiar cases. In addition, 10 out of these 13 sources have mean K-band magnitudes above 9.5 (Glass et al. GLASS2 (2001)), while only one third of those with an ISOGAL counterpart have such faint near-IR magnitudes.
Three catalogues of OH/IR stars (Lindqvist et al. lindqvist (1992), Sevenster et al. sevenster (1997), Sjouwerman et al. sjouw (1998)) were compiled and associated with ISOGAL data in the inner Galactic Bulge by Ortiz et al. (ortiz (2002)). They found 37 OH/IR stars in the FC–027 field, 34 of which are associated with ISOGAL sources within 6′′. As shown with crosses in Fig. 2, they are found at the brightest end of the main sequence in this diagram, with magnitudes [15] 4.5 and colours 0.8 [7]–[15] 2.3. These are typical colours and magnitudes for OH/IR stars with bolometric magnitudes in the range mag and mass-loss rates between and a few M⊙/yr (Ortiz et al. ortiz (2002), Groenewegen groen (1993)).
Another seven sources (indicated with square symbols in Fig. 2) were detected in the 86 GHz SiO maser line by Messineo et al. (ref-messineo (2002)), who observed 12 sources selected in the FC–027 field. This detection rate of 58% is consistent with the 48% detection rate found by Deguchi et al. (ref-deguchi (2004)), who surveyed the complete sample of LPV stars published by Glass et al. (GLASS2 (2001)) in SiO 43 GHz lines.
| ISOGAL Name | [7] | [15] | |||||
|---|---|---|---|---|---|---|---|
| 17h41m54s | –29∘09.0′ | 17h45m05s | –29∘10′12′′ | 174505.6-291018 | 5.24 | 1.78 | |
| 17 41 43 | –29 10.5 | 17 44 54 | –29 11 43 | 174452.5-291122 | 5.70 | 2.11 | |
| 17 41 38 | –29 10.0 | 17 44 49 | –29 11 13 | ||||
| 17 41 23 | –29 12.6 | 17 44 34 | –29 13 50 | 174433.8-291355 | 6.49 | 1.98 |
3.2 Radio continuum sources
Large fractions of the Galactic Disk, including the central region, have been surveyed at radio wavelengths by different teams, using the VLA at 1.4 GHz (Zoonematkermani et al. zoone (1990)), 5 GHz (Becker et al. BWHZ94 (1994)), and 1.6 GHz (Liszt Liszt85 (1985); Liszt & Spiker LS95 (1995)). In addition, Downes et al. (DGSW (1979)) conducted pointed observations in the Galactic Centre region with several telescopes.
A number of compact or small extended radio continuum sources from these catalogues are found in the FC–027 field. We consider as their infrared counterparts the nearest ISOGAL neighbour brighter than 5 mag at 15 m. Infrared counterparts are found within 10′′ for all sources, except for source number 3 in Downes et al. (DGSW (1979)) for which the separation is 18′′, and source number 7 in Liszt & Spiker (LS95 (1995)) which coincides with a compact group of ISOGAL sources discussed in Sect. 4.3.
In addition to these catalogued sources, a number of faint radio sources can be seen in the 1616 MHz map of Liszt and Spiker (LS95 (1995), see their Figure 1). They were not included in their table, but some of them can be associated with bright ISOGAL sources, as indicated in Table 1. The positions of all these radio sources in the [15] vs. [7]–[15] colour magnitude diagram are shown in Fig. 3.
The sensitivity of the Becker et al. (BWHZ94 (1994)) catalogue in the central region of the Galaxy is of order 40 mJy, and that of the Downes et al. (DGSW (1979)) survey is close to 10 mJy. Liszt & Spiker (LS95 (1995)) report a noise level of 0.7 mJy/beam in their data, but their observations cover only a fraction of the FC–027 field. In addition, all these radio data show extended emission at various positions in the field, so that confusion may limit the actual sensitivity of these surveys. It is clear that any Hii region powered by a single B-type star at the distance of the Galactic Centre would have been missed by these radio observations.

3.3 IRAS sources
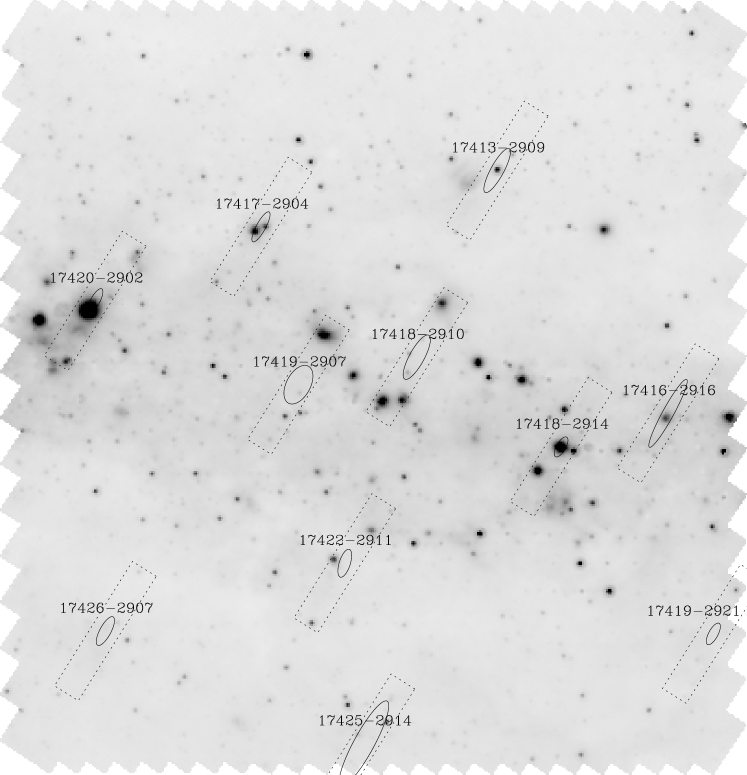
The IRAS observations were highly limited by source confusion in the very dense regions of the inner Galactic Bulge, so that no clear and unique association can be found between the IRAS and ISOGAL catalogues in most cases. We therefore looked for ISOGAL counterparts at least within the 3 uncertainty ellipse of each IRAS point source. In most cases, both the positions and the photometry of the IRAS sources probably result from a combination of several infrared sources, on top of diffuse emission (Fig. 4). We will thus consider the brightest source at 15 m as the most likely main counterpart to the source responsible for the emission detected by IRAS.
Eleven IRAS PSC sources are located in this field. Four of them (17418–2914, 17419–2907, 17420–2902 and 17422–2911) have and flux ratios all higher than or close to 10, making these sources very likely to be associated with compact Hii regions (Wood and Churchwell ref-wood-church (1989)). Two other sources (17416–2916 and 17417-2904), with and no detection at 60 m, could well be compact Hii regions. The ISOGAL counterparts to these ultra-compact Hii regions show peculiar colours: they are very bright at 15 m, as was expected from their detection by IRAS, and very red in [7]–[15] (see triangle symbols in Fig. 3).

3.4 MSX sources
The Midcourse Space Experiment (Price et al. ref-price (2001)) performed observations in the mid-infrared of the complete Galactic plane, in the range, in six bands centred on wavelengths between 4 and 21 m, at a spatial resolution of . Here we will use version 2.3 of the MSX PSC (Egan et al. ref-msx2 (2003)). It was built by extracting point sources from co-added images, resulting in a 400 000 source catalogue with a sensitivity of about 40 mJy in the A band (8.3 m). In particular, three raster-scanned experiments were combined at the Galactic Centre, greatly improving the sensitivity. However, as many as 10% of the point sources extracted from the densest region of the Galactic Centre may actually be diffuse emission on the scale of the MSX pixel rather than true point sources, as we will show below.
We find 333 MSX sources in the FC–027 field. After adding small offsets to the MSX coordinates, 257 sources (77%) can be associated with ISOGAL sources within an 8′′ search radius. Two among the remaining 76 are located near the edge of the field and can be associated with ISO sources outside the limits. A few other ones, including the two brightest ones at 15 m among the non-associated MSX sources, are found at the barycentre of two or more bright sources that appear resolved with ISO. This is clearly an effect of the higher spatial resolution of ISO as compared to the 18′′ pixels of MSX.
However, at least one ISOGAL point source can always be found within 30′′ of any MSX source. We have performed a -analysis, similar to that used to cross-corelate the MSX and 2MASS catalogues in the Large Magellanic Cloud (Egan et al. ref-chi2 (2001)), to estimate the probability that an MSX source and its closest ISOGAL neighbour can be real matches. It turned out that, among the 76 sources with no counterpart at less than 8′′, 55 associations have values below 18.6, where 99.99% of the true matches must lie. All of them have ISO–MSX separations less than 18′′, i.e. are within one MSX pixel, so that these associations may be real, except for about ten of them that show ISO–MSX magnitude differences greater than 2 mag. Altogether, about one half of the latter associations with separations greater than may still be real. Most of the 76 MSX sources without ISOGAL associations within 8′′ are located in regions of diffuse emission, and the other half may well correspond to patches of diffuse emission rather than genuine point sources.
To estimate the fraction of chance associations between MSX and ISOGAL, we also performed cross-identifications between the ISOGAL PSC and the MSX catalogue, adding an arbitrary offset to the coordinates of the latter. The results show that nearly one third of the MSX sources can be randomly associated with ISO sources within an 8′′ search radius, as expected from the average ISO source density. However, when taking into account the fact that a fraction of these sources are well associated with ISOGAL, we estimate that no more than 40 ISOGAL–MSX associations (out of 257) should be false. Also note that the number of MSX sources found within the FC–027 field corresponds to 0.1 source/pixel in average, so that the extraction was certainly limited by confusion. Therefore, the reality of the weakest sources and their associations with ISOGAL should be regarded with extreme caution.
Nevertheless, we find a fair general agreement between the ISO and MSX magnitudes, both at 7 and at 15 m, as shown in Fig. 5, although with quite large dispersion partly due to the variability of some sources, and to a few wrong associations for the faintest sources. The distributions of magnitude differences show clear tails toward positive differences, that can be explained by MSX including more flux from diffuse extended emission, or from several point sources resolved by ISO, while only the magnitudes of the nearest ISO counterparts have been taken into account. In addition, the false ISO–MSX associations, as well as the Malmquist bias on the faintest MSX sources, certainly contribute to the tail in that direction (MSX magnitudes seem brighter than ISOGAL), due to the lower sensitivity of MSX compared to ISOGAL.
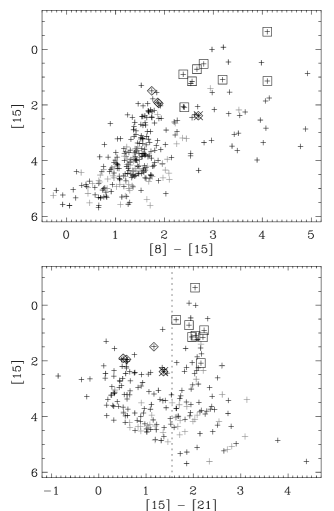
The MSX survey provides photometry up to 21 m (E band, 18.2–25.1 m), which can be used to extract candidate young massive stars with a colour criterion similar to the Wood and Churchwell (ref-wood-church (1989)) criteria for IRAS colours. Indeed, the ISOGAL sources identified as young objects from their IRAS or radio counterparts all have MSX flux ratios FE/FD above 2 (or colours [15]–[21] 1.55 mag, see Fig. 6). Therefore we will use the criterion FE/FD 2 as an indication of the young nature of ISOGAL-MSX sources in Sect. 4. The interpretation as young objects from the MSX D-E colour alone is somewhat less secure than the Wood and Churchwell (ref-wood-church (1989)) criteria, since objects of this type emit the bulk of their energy at wavelengths longer than 25 m. Also, not all sources with FE/FD 2 show other signs of high mass star formation, and the nature of those with moderate [8]–[15] colours ( 2 mag) remains unclear (see also Sect. 4.2 and Fig. 10). However, the limit FE/FD 2 is more conservative than the criteria FE FD FA and FE 2FA used by Lumsden et al. (ref-lumsden (2002)) to extract massive young objects from the MSX PSC. We will therefore use the criterion FE/FD 2 to confirm the young nature of sources selected on the basis of their red ISOGAL colours.
3.5 Near-infrared spectroscopic observations
We have conducted near-infrared (H and K bands) spectroscopic observations with the SOFI instrument on the NTT in July 2000; the observations and their analysis have been extensively described by Schultheis et al. (ref-sofi (2003)). The purpose of these observations was to derive the nature of sources with various positions in the [15] vs. [7]–[15] colour magnitude diagram from their spectra. Indeed, near infrared spectra contain enough features to distinguish late type evolved stars from young objects: the former show strong molecular bands (mainly CO and H2O), while the latter generally show only atomic lines (hydrogen Br, HeI, FeII, NaI and CaI, among others), or red featureless continuum, possibly with signatures of shocks (e.g. H2 at 2.12 m), characteristic of massive YSOs (Hoare et al. ref-hoare (2004)). It is therefore possible to infer the nature of the sources from the equivalent widths of the observed molecular bands, as shown in Schultheis et al. (ref-sofi (2003), see in particular their Figure 5).
The observed sample included 65 sources in the FC–027 field. Only two of them show near-IR spectra consistent with a young stellar nature, or with hot stars in a more evolved stage. These are 174516.2–290315 (labelled A33 in Schultheis et al. ref-sofi (2003)), also associated with a radio and an IRAS sources; and 174504.9–291146 (labelled A40), which also has a radio counterpart. The near-IR spectrum of the latter can possibly be interpreted as tracing a Wolf-Rayet star. As can be seen in Fig. 7, these observations tend to confirm that most sources with [7]–[15] colours below or close to 2 mag are evolved stars in the AGB phase.

Five sources with colours [7]–[15] 2.5 mag show near-IR spectra interpreted as AGB (Fig. 7). In addition, the weak ([15] = 4.87, [7]–[15] = 1.74) source 174521.9–291344 has an AGB-type near-IR spectrum, but also has a radio continuum counterpart (Fig. 3). A visual inspection of the images shows that, for these six sources, either a second source or an extended patch of diffuse emission shows up only at 15 m. Thus, these are certainly blends between AGB stars, mainly detected in K-band and at 7 m, and unrelated diffuse emission that does not appear at wavelengths shorter than 15 m, and could possibly trace recent star formation.
3.6 Summary
The results of all identifications discussed in the previous sections are shown in the summary [15] vs. [7]–[15] colour magnitude diagram (Fig. 8). It can be seen that sources interpreted as young objects (i.e. with IRAS Hii regions or radio continuum counterparts, and the two sources with NIR-spectra of hot stars), occupy a well-defined region in the right-upper part of this diagram, while sources identified with AGB stars are mostly found to the left of [7]–[15] 2. Only seven OH/IR stars are located in the [7]–[15] 2, [15] 4.5 region. Six of them also have MSX counterparts, all with flux ratios FE/FD less than 2, while all identified young objects have MSX flux ratios FE/F 2. Therefore, FE/F 2 seems to be a good criterion to confirm the young nature of YSO candidates.

Also note that the majority of sources brighter than [15] 4.5 have known counterparts in either of the young object or AGB classes. Indeed, in the area covered by Glass et al. (GLASS2 (2001)) observations, the nature of 69 out of 88 sources (almost 80%) with [15] 4.5 and a 7-15 m association can be derived from existing data, or from their red MSX D–E colours for five of them. The fraction of unidentified sources becomes much larger beyond this magnitude limit, where the distinction between young and evolved objects also becomes less clear.
4 Extraction of the young stellar population
4.1 Selection criteria
According to the summary colour magnitude diagram (Fig. 8 and Sect. 3.6), the simple colour criterion [7]–[15] 2 seems appropriate to select young objects, especially for the brightest objects ([15] 4.5 mag). However, a moderate number of evolved stars (e.g. deeply embedded OH/IR stars) also show [7]–[15] colours between 2 and 3 mag. Carbon stars could also have [7]–[15] colours in excess of 2 mag, but it is known that such objects are very rare in the direction of the inner Galactic Bulge (e.g. Blanco et al. ref-blanco (1984), Glass ref-glass86 (1986)). Consistently, we found no carbon stars among the 100 sources in the inner Galactic Bulge for which we obtained near-IR spectra (Schultheis et al. ref-sofi (2003)). Planetary nebulae may also show red mid-IR colours, but Jacoby & Van de Steene (ref-PNsurvey (2004)) estimated their total number in the central 16 deg2 of the Galaxy to be of order 250, so that we expect a very small number of such objects in this 0.1 deg2 field.
Another important parameter of the ISOGAL sources, related to their spatial extension, appears to give a powerful criterion to distinguish massive star forming regions from stars in their late evolution. The uncertainty in the measured magnitude, especially at 15 m, noted in the ISOGAL PSC (Schuller et al. PSC_FS (2003)), is derived from the residuals between the source profile and the analytical PSF used for the extraction. While the values of show a larger dispersion for faint sources, and can reach typically 0.1–0.15 mag, they are generally low (0.05 mag) for point sources brighter than [15]4.5 mag.
The distribution of the values is shown versus the [7]–[15] colours for all sources with [15] 4.5 in Fig. 9. Only one LPV star is found with [7]–[15] 2 and 0.05, but its mid-infrared magnitudes are affected by a blend with a bright nearby extended source. On the other hand, all sources interpreted as young objects have high values of both [7]–[15] and . In other terms, stars in the AGB phase appear point-like in the ISO observations, while more extended emission is detected around young sources: these may be small groups or clusters of YSOs, or single objects embedded in diffuse emission. Indeed, ground-based mid-IR images of similar objects selected from the MSX survey show, in most cases, a point-like source embedded in extended diffuse emission, probably arising from PAH (Hoare et al. ref-hoare (2004)).

Thus, we can combine a colour and an extension criteria in order to extract the population of ISOGAL sources associated with young objects, with very little contamination by evolved stars. As shown in Fig. 9, the criteria that we have defined are:
| (2) |
Most sources with an MSX association with a flux ratio FE/FD 2 are found in the same region of this diagram, as shown with open circles in Fig. 9. This gives an additional argument showing that the combination of the proposed colour and spatial extension criteria are appropriate to select candidate young objects.
As compared with the selection criteria that we defined in Felli et al. (Felli2002 (2002)), the addition of a constraint on the spatial extension at 15 m for the sources with moderately red colours (2 [7]–[15] 3) greatly reduces the contamination of our sample by anomalously red AGB stars (e.g. OH/IR stars with large mass loss, Fig. 9). Also, we consider only sources redder than [7]–[15] 2 as candidate young objects, while Felli et al. (Felli2002 (2002)) used [7]–[15] 1.8 to select all candidates from the ISOGAL database. However, both the interstellar extinction and confusion issues due to a high source density are more extreme in the FC–027 field, located near the Galactic Centre, than in the general Galactic Disk environment of most ISOGAL fields. In addition, OH/IR and similar evolved stars are relatively rare outside of the Galactic Bulge: in the range, the number density of IRAS sources with a probability of variability greater than 90% (i.e. mostly AGB stars) already drops by a factor 2 from to , while the number density of sources detected at 25, 60 and 100 m (mostly young stars) is roughly constant over (see Fig. VII.Ap.7 and VII.Ap.16 in the IRAS Explanatory Supplement). Therefore, we do not expect many evolved sources in the Felli et al. (Felli2002 (2002)) sample extracted with somewhat looser criteria. On the other hand, we may have missed a few young objects with [7]–[15] colours below 2 mag in the present study.
We also want to stress that our criterion on selects sources marginally resolved with ISO, i.e. with angular sizes of order 30′′. This roughly corresponds to a 1 pc linear size at the distance of the Galactic Centre. Thus, our combination of colour, magnitude and spatial extension criteria is well adapted to select young objects in the direction of the Galactic Bulge, where most sources are expected to be at similar distances (see also Sect. 4.4 below), but it would be much less efficient in sight lines where distances to sources are spread over a wide range.
4.2 Extraction of all YSO candidates
Using the proposed selection criteria (see Eq. 2), 33 candidate young objects with [15] 4.5 mag (or F280 mJy) were selected, including 13 with IRAS and/or radio continuum counterparts. In addition, 15 sources are found with [15] 4.5 mag, but with no association at 7 m in the ISOGAL PSC (which has a 50%-completeness level around 8.0 mag at 7 m, see Sect. 2). One of them (174529.1–290413, with [15] = 4.41 and = 0.13) is associated with an LPV star; the lack of magnitude at 7 m and the high value can be explained by confusion issues. The other 14 sources with [15] 4.5 all have 0.07, and can also be considered as candidate young objects.
Among these 46 candidates, 30 (or 65%) are also associated with MSX sources. All of them are detected in the A, D and E bands, and all but two have flux ratios FE/FD 2, as can be seen in Fig. 10. On the other hand, only four LPV stars and one OH/IR star have FE/FD above 2. This colour-colour diagram therefore seems to be an efficient means for distinguishing young objects from evolved stars, whereas the mid-IR selection criteria used by Lumsden et al. (ref-lumsden (2002)) do not reject evolved stars as efficiently, as can be seen in Fig. 10 - however, they used additional criteria based on 2MASS near-IR magnitudes to eliminate many of the evolved sources.

The most relevant infrared properties of our 46 YSO candidates are given in Tables A and A in Appendix A. Tables with all available magnitudes (ISO, DENIS, 2MASS, MSX and IRAS when relevant) can be retrieved electronically through CDS. These tables also contain aperture magnitudes at 15 m. These were computed by integrating a number of pixels in an inner radius, and subtracting the background estimated as the median in an outer annulus; the radii that we used were adapted for every individual source, in order to avoid contaminations by nearby sources.
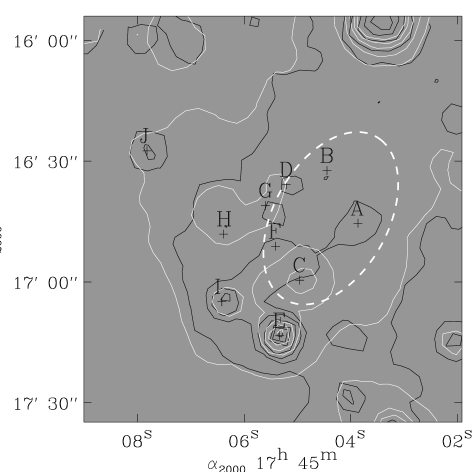
4.3 Comments on the cluster around LS95 7
A compact group of nine ISOGAL point sources (Fig. 11) is located in the vicinity of the radio source No. 7 detected at 1.6 GHz by Liszt and Spiker (LS95 (1995)), who reported an extended size of 31′′48′′ (Sect. 3.2). Sources extracted in a 30′′ radius around 17h45m05s, are reported in Table 2. At least two of them, sources C and H, are probably young objects, since they have [7]–[15] colours above 3.5 mag, and signs of spatial extension as indicated by value of above 0.1 mag. These two sources are in the samples extracted with our criteria discussed in Sect. 4.2.
| Id. | ISOGAL name | [7] | [15] | q7-15 | |
|---|---|---|---|---|---|
| ISOGAL-PJ | mag | mag | mag | 4 | |
| A | 174503.9–291645 | 6.59 | - | - | 0 |
| B | 174504.4–291632 | 7.63 | - | - | 0 |
| C | 174505.0–291659 | - | 3.21 | 0.11 | 0 |
| D | 174505.2–291635 | 7.39 | - | - | 0 |
| E | 174505.3–291713 | 4.21 | 2.73 | 0.04 | 4 |
| F | 174505.4–291651 | 6.80 | - | - | 0 |
| G | 174505.6–291641 | 7.48 | - | - | 0 |
| H | 174506.4–291648 | 7.41 | 3.96 | 0.13 | 2 |
| I | 174506.4–291704 | 5.35 | 3.89 | 0.05 | 4 |
Diffuse emission is also visible around these sources at 15 m, suggesting that this could be a group of young objects still in their parent cocoon. We can also note that if this group is at the distance of the Galactic Centre, the projected distance between sources C and H would be of order 1 pc, which could correspond to a very young OB-association. Complementary observations at higher spatial resolution, with a sensitivity at least comparable to ISOGAL, would greatly help in understanding the nature of this object.
4.4 Distance to the sources
Most radio sources that we considered in the present paper were only observed in the continuum, so that no radial velocity data are available. Only for the source LS95 7 that we discussed in the previous section, Liszt and Spiker (LS95 (1995)) report a radial velocity VLSR = –44.1 km s-1, as derived from observations in the H70 radio recombination line. Thus, this source is probably associated with the Sgr C complex, in the vicinity of the Galactic Centre.
Using the available data, we cannot exclude that some of the candidates that we have selected are foreground. However, given the high over-density of such sources in the inner Galactic Bulge as compared to the rest of the Galactic disk, we expect a very small fraction of foreground sources: the Besançon model (Robin et al. ref-besancon (2003)) predicts 8% contamination by foreground objects. It is still possible that a few of our candidates are much closer than the Galactic Centre, especially among the brightest sources. Additional observing programmes are ongoing to further constrain the distance to these sources.
4.5 Summary

We have been able to extract a sample of 46 candidate massive young objects brighter than 4.5 mag at 15 m (or F280 mJy) from a 0.09 deg2 area at about 40 pc in projection from the Galactic Centre, using mid-infrared photometry from the ISOGAL survey. We have adopted a conservative approach, since this survey goes down to magnitude 7.0 at 15 m with good completeness (Sect. 2); the distinction between young and evolved stars becomes more subtle when going to fainter levels than this. A source located at 8.5 kpc with magnitude [15] 4.5 would have a luminosity around 104 L⊙ according to Felli et al. ((Felli2002, 2002, Sect. 3.2)), consistent with a single B0 star.
Only 13 of these 46 sources show other signatures of young massive stars, such as IRAS or radio continuum counterparts (including one not seen by MSX), and 16 do not appear in the MSX PSC, while most of the others display MSX colours typical of young stars. The distribution of these YSO candidates is shown in galactic coordinates in Fig. 12. It appears that most of them are located in the range, and that their distribution is tilted with respect to the Galactic Plane, going from at to at . In the mid-infrared, diffuse emission probably arising from PAHs and small dust grains is seen in the same latitude range (Fig. 1). Moreover, strong radio continuum emission at 1.6 GHz is observed at the positions of most candidates. Some of them are coincident with peaks of radio emission, and others are located in regions of extended radio emission, including eight candidates without known counterparts located in the extended component around Sgr A. This adds to the confidence that we are interpreting these sources correctly as young massive objects.
5 Conclusion
We have shown in this paper that the bright end of the stellar populations detected by ISOGAL can be well characterised, using already existing data and complementary mid-infrared observations. A sample containing 182 sources brighter than 280 mJy at 15 m, complete over a 0.09 deg2 area close to the Galactic Centre, has been associated with several catalogues of evolved stars on one hand, and with high-mass young objects previously detected by IRAS or in the radio continuum on the other. With the addition of infrared photometry at 15 and 21 m from MSX, and spectroscopic near-infrared data for some sources, a majority (61%) could be identified with evolved stars or with young objects.
The mid-infrared magnitudes and colours and the spatial extension of the 15 m emission of the young objects are sufficiently peculiar to provide robust criteria for selecting good candidate young massive objects from the ISOGAL data. Using a colour criterion [7]–[15] 2 mag, combined with a minimum spatial extension indicated by 0.1 mag for the least red sources ([7]–[15] between 2 and 2.5 mag), we could extract 46 candidates from the analysed field. Only 13 of them were previously reported as ultra-compact Hii regions. About 65% are also detected by MSX, and they also have red colours in the longer 15 to 21 m wavelengths. Their positions in the field are almost always coincident with diffuse extended infrared emission, with peaks or more extended emission in the radio continuum in most cases. They are mainly distributed in the range, or very close to the Galactic Plane, where one expects to find the largest incidence of star formation. All this tends to confirm their interpretation as young objects, embedded in vast structures of dust and gas heated by recently formed stars.
The exact nature of our objects remains unclear. Following Felli et al. (Felli2002 (2002)), their bolometric luminosities can be roughly derived from their flux densities at 15 m, and one finds values in the range L⊙, assuming that they are at the distance of the Galactic Centre. Such luminosities could come from single O or early B stars. However, most of them show spatial extension of order 1 pc (as resolved by ISO) and only very few are associated with known ultra-compact Hii regions, suggesting that there is no very early type star present in most cases. Thus, these objects could be small groups or clusters of young stars of intermediate masses. To be detected with such red colours in the mid-infrared, they would have to be in a protostellar phase, possibly in the compact molecular core stage, prior to the formation of a compact Hii region (e.g. Brand et al. ref-brand (2001)), or an evolutionary stage somehow similar to class I for low-mass YSOs. Some candidates may also be compact Hii regions falling below the sensitivity of current radio continuum surveys, thus corresponding to the next stage in the early evolution of massive stars.
Several follow-up projects, including spectro-imagery with the Spitzer Space Telescope, have been initiated to better understand the nature of these objects. Moreover, the ISOGAL data cover most parts of the inner Galactic bulge, in the longitude range. The criteria that we have presented here can be used to extract the young population from the other ISOGAL fields, to get a more complete picture of the recent star formation in the central 400 pc of the Galaxy; this will be the subject of a second paper.
Acknowledgements.
We are very grateful to Dr. H.S. Liszt for providing us with his VLA 1.6 GHz data of the Galactic Centre region. This research made use of data products from the Midcourse Space Experiment. Processing of the data was funded by the Ballistic Missile Defense Organization with additional support from NASA Office of Space Science. We gratefully thank the MSX team and in particular Dr. D. Mizuno for making us parts of the MSX catalogue version 2.3 available prior to its publication. MS is supported by the APART programme of the Austrian Academy of Science.References
- (1) Alard, C., Blommaert, J.A.D.L., Cesarsky, C., et al. 2001, ApJ 552, 289
- (2) Becker, R.H., White, R.L., Helfand, D.J., Zoonematkermani, S. 1994, ApJS 91, 347
- (3) Blanco, V.M., McCarthy, M.F., Blanco, B.M. 1984, AJ 89, 636
- (4) Brand, J., Cesaroni, R., Palla, F., Molinari, S. 2001, A&A 370, 230
- (5) Cesarsky, C.J., Abergel, A., Agnèse, P., et al. 1996, A&A 315, L32
- (6) Deguchi, S., Imai, H., Fujii, T., et al. 2004, PASJ 56, 261
- (7) Downes, D., Goss, W.M., Schwarz, U.J., Wouterloot, J.G.A. 1979, A&AS 35, 1
- (8) Egan, M.P., Van Dyk, S.D., Price, S.D. 2001, AJ 122, 1844
- (9) Egan, M.P., Price, S.D., Kraemer, K.E., et al. 2003, The Midcourse Space Experiment Point Source Catalog Version 2.3, AFRL-VS-TR-2003-1589, Air Force Research Laboratory
- (10) Epchtein, N., de Batz, B., Capoani, L., et al. 1997, The Messenger 87, 27
- (11) Felli, M., Comoretto, G., Testi, L., Omont, A., Schuller, F. 2000, A&A 362, 199
- (12) Felli, M., Testi, L., Schuller, F., Omont, A. 2002, A&A 392, 971
- (13) Glass, I.S. 1986, MNRAS 221, 879
- (14) Glass, I.S., Ganesh, S., Alard, C., et al. 1999, MNRAS 308, 127
- (15) Glass, I.S., Matsumoto, S., Carter, B.S., Sekiguchi, K. 2001, MNRAS 321,77
- (16) Groenewegen, M. A. T. 1993, Ph.D. Thesis, University of Amsterdam
- (17) Hoare, M.G., Lumsden, S.L., Oudmaijer, R.D., et al. 2004, in Milky Way Surveys: The Structure and Evolution of our Galaxy, Proc. of ASP Conference 317, ed. D. Clemens, R. Shah, T. Brainerd, 156
- (18) Jacoby, G.H., Van de Steene, G. 2004, A&A 419, 563
- (19) Jiang, B.W., Gao, J., Omont, A., Schuller, A., Simon G. 2006, A&A 446, 551
- (20) Lindqvist, M., Winnberg, A., Habing, H.J., Matthews, H.E. 1992, A&AS 92, 43
- (21) Liszt, H.S., 1985 ApJ 293, L65
- (22) Liszt, H.S., Spiker, R.W. 1995, ApJS 98, 259
- (23) Lumsden, S.L., Hoare, M.G., Oudmaijer, R.D., Richards, D. 2002, MNRAS 336, 621
- (24) Messineo, M., Habing, H.J., Sjouwerman, L.O., Omont, A., Menten, K.M. 2002, A&A 393, 115
- (25) Ojha, D.K., Omont, A., Schuller, F., et al. 2003, A&A 403, 141
- (26) Omont, A., Ganesh, S., Alard, C., et al. 1999, A&A 348, 755
- (27) Omont, A., Gilmore, G., Alard, C., et al. 2003, A&A 403, 975
- (28) Ortiz, R., Blommaert, J.A.D.L., Copet, E., et al. 2002, A&A 388, 279
- (29) Price, S.D., Egan, M.P., Carey, S.J., Mizuno, D.R., Kuchar, T.A. 2001, AJ 121, 2819
- (30) Robin, A.C., Reylé, C., Derrière, S., Picaud, S. 2003, A&A 409, 523
- (31) Schuller, F. 2002, PhD thesis, Paris VI University
- (32) Schuller, F., Ganesh, S., Messineo, M., et al. 2003, A&A 403, 955
- (33) Schultheis, M., Ganesh, S., Simon, G., et al. 1999, A&A 349, L69
- (34) Schultheis, M., Lançon, A., Omont, A., Schuller, F., Ojha, D.K. 2003, A&A 405, 531
- (35) Sevenster, M.N., Chapman, J.M., Habing, H.J., Killeen, N.E.B., Lindqvist, M. 1997, A&AS 122, 79
- (36) Sjouwerman, L.O., van Langevelde, H.J., Winnberg, A., Habing, H.J. 1998, A&AS 128, 35
- (37) van Loon, J.T., Gilmore, G.F., Omont, A., et al. 2003, MNRAS 338, 857
- (38) Wood, D.O.S., Churchwell, E. 1989, ApJ 340, 265
- (39) Zoonematkermani, S., Helfand, D.J., Becker, R.H., White, R.L., Perley, R.A. 1990, ApJS 74, 181
Appendix A Complete list of YSO candidates
Table 3 shows two examples of the full data for our 46 candidate young objects. This table contains photometry and quality flags from the 2MASS, DENIS, ISOGAL, MSX and IRAS catalogues. The separations between the ISOGAL objects and the other sources are also given, as well as the separations between the 7 m and 15 m sources. The ISOGAL 15 m flux densities have been determined by PSF-fitting (column F15) and by aperture photometry (column ap15). The complete version of this table is available through VizieR at the CDS.
Tables A and A show only the ISOGAL and DENIS data for the candidates detected at 7 and 15 m, and the ones only detected at 15 m, respectively. These tables are available in the online version of the present paper.
| 2MASS | DENIS | ||||||||
| Name | J | H | K | flag | sep. | I | J | K | sep. |
| ISOGAL-PJ- | [mag] | [mag] | [mag] | [′′] | [mag] | [mag] | [mag] | [′′] | |
| 174437.9–291014 | 14.640 | 12.895 | 11.750 | BUU | 1.62 | - | - | - | - |
| 174449.5–291805 | 16.116 | 13.162 | 11.189 | UBA | 0.61 | - | 15.31 | 9.02 | 1.49 |
| ISOGAL | MSX | |||||||||||
| F7 | F15 | ap15 | flag | sep. | Name | FA | FC | FD | FE | flag | sep. | |
| Jy] | [Jy] | [Jy] | [Jy] | [′′] | [Jy] | [Jy] | [Jy] | [Jy] | [′′] | |||
| 0.132 | 0.370 | 4.66 | 0.067 | 33 | 4.68 | G359.6885+00.0634 | 0.49 | 0.96 | 2.49 | 13.20 | 4444 | 7.1 |
| 0.270 | 1.854 | 3.70 | 0.255 | 43 | 6.00 | G359.5969–00.0415 | 0.66 | 2.02 | 4.43 | 15.47 | 4444 | 3.7 |
| IRAS | |||||
| Name | F12 | F25 | F60 | F100 | flag |
| [Jy] | [Jy] | [Jy] | [Jy] | ||
| - | - | - | - | - | - |
| 17416-2916 | 12.9 | 43 | 1480 | 4850 | 1311 |
1http://vizier.u-strasbg.fr/viz-bin/VizieR
| ISOGAL name | J | K | qID | sep. | [7] | q7 | [15] | q15 | qII | sep. | ap15 | MSX | ||
|---|---|---|---|---|---|---|---|---|---|---|---|---|---|---|
| ISOGAL-PJ | mag | mag | ′′ | mag | mag | mag | mag | ′′ | mag | |||||
| 174433.8-291355 | – | – | – | – | 6.49 | 0.10 | 4 | 1.98 | 0.12 | 4 | 4 | 1.30 | 1.10 | + |
| 174437.9-291014 | – | – | – | – | 6.98 | 0.16 | 3 | 4.20 | 0.18 | 3 | 2 | 4.68 | 1.45 | + |
| 174449.5-291805 | 15.31 | 9.02 | 4 | 1.49 | 6.20 | 0.12 | 4 | 2.45 | 0.14 | 3 | 0 | 6.59 | 1.70 | + |
| 174452.5-291122 | 11.39 | 7.66 | 2 | 3.05 | 5.70 | 0.18 | 3 | 2.11 | 0.13 | 4 | 2 | 3.95 | 0.60 | + |
| 174454.9-291413 | – | – | – | – | 4.27 | 0.09 | 4 | 1.01 | 0.04 | 4 | 4 | 0.91 | 0.55 | + |
| 174455.3-291538 | – | – | – | – | 4.97 | 0.12 | 4 | 1.82 | 0.06 | 4 | 4 | 0.46 | 1.40 | + |
| 174455.8-292009 | – | 10.51 | 4 | 1.76 | 7.23 | 0.13 | 4 | 3.98 | 0.09 | 4 | 3 | 2.12 | 2.80 | |
| 174455.8-291727 | 11.92 | 10.62 | 2 | 3.46 | 6.98 | 0.09 | 4 | 2.39 | 0.05 | 4 | 4 | 0.42 | 1.90 | X |
| 174456.1-291257 | – | – | – | – | 5.93 | 0.05 | 4 | 1.36 | 0.10 | 4 | 4 | 0.41 | 0.60 | X |
| 174457.0-290557 | 15.25 | 10.11 | 5 | 0.63 | 4.48 | 0.17 | 3 | 1.65 | 0.08 | 4 | 4 | 0.94 | 0.70 | + |
| 174459.1-290653 | – | 11.07 | 4 | 1.47 | 6.89 | 0.10 | 4 | 3.49 | 0.05 | 4 | 4 | 0.76 | 3.00 | + |
| 174459.5-291604 | – | 10.78 | 3 | 1.81 | 4.08 | 0.17 | 3 | 0.50 | 0.12 | 3 | 4 | 1.33 | –0.30 | + |
| 174503.2-291737 | – | – | – | – | 5.90 | 0.06 | 4 | 2.40 | 0.07 | 4 | 4 | 0.47 | 1.90 | + |
| 174503.4-290900 | – | – | – | – | 5.68 | 0.18 | 3 | 1.76 | 0.17 | 3 | 4 | 1.82 | 0.00 | + |
| 174503.5-291552 | – | 11.06 | 2 | 2.96 | 4.13 | 0.10 | 4 | 0.62 | 0.04 | 4 | 4 | 1.67 | 0.35 | + |
| 174504.4-291359 | – | – | – | – | 6.96 | 0.17 | 3 | 3.62 | 0.14 | 3 | 3 | 2.95 | 2.00 | + |
| 174504.9-291146 | 15.24 | 9.01 | 5 | 1.11 | 4.27 | 0.09 | 4 | 1.97 | 0.11 | 4 | 4 | 1.66 | 0.70 | + |
| 174505.6-291018 | – | – | – | – | 5.24 | 0.16 | 3 | 1.78 | 0.09 | 4 | 4 | 1.09 | 1.00 | + |
| 174506.4-291648 | 13.51 | 9.17 | 5 | 0.34 | 7.41 | 0.12 | 4 | 3.96 | 0.13 | 3 | 2 | 3.54 | 1.50 | + |
| 174506.5-291118 | – | – | – | – | 5.29 | 0.12 | 4 | 0.88 | 0.07 | 4 | 4 | 0.33 | 0.10 | + |
| 174508.0-291039 | 14.44 | 9.03 | 5 | 0.67 | 6.59 | 0.09 | 4 | 4.24 | 0.11 | 4 | 2 | 4.38 | 2.80 | |
| 174508.4-291753 | – | – | – | – | 7.94 | 0.10 | 4 | 3.66 | 0.09 | 4 | 4 | 1.78 | 2.60 | + |
| 174516.2-290315 | 11.47 | 7.86 | 5 | 1.05 | 5.66 | 0.15 | 3 | 1.03 | 0.19 | 3 | 2 | 3.42 | –1.00 | + |
| 174517.8-290813 | – | – | – | – | 7.30 | 0.09 | 4 | 4.10 | 0.09 | 4 | 4 | 0.42 | 3.50 | + |
| 174518.1-290439 | – | – | – | – | 6.30 | 0.10 | 4 | 2.54 | 0.05 | 4 | 4 | 1.66 | 1.95 | + |
| 174518.1-291051 | – | – | – | – | 6.51 | 0.16 | 3 | 3.00 | 0.08 | 4 | 4 | 0.68 | 2.60 | |
| 174520.7-291258 | – | – | – | – | 5.97 | 0.19 | 3 | 2.79 | 0.11 | 4 | 4 | 1.55 | 1.70 | + |
| 174520.7-290213 | – | 10.40 | 2 | 2.89 | 4.57 | 0.18 | 2 | 0.40 | 0.12 | 3 | 4 | 0.61 | –0.40 | + |
| 174522.8-290331 | – | – | – | – | 5.16 | 0.14 | 3 | 2.29 | 0.14 | 3 | 2 | 5.51 | 1.30(†) | |
| 174523.3-290331 | 15.76 | 8.48 | 5 | 0.24 | 5.52 | 0.09 | 1 | 2.29 | 0.14 | 3 | 3 | 2.67 | 1.30(†) | |
| 174523.9-290310 | 14.58 | 8.72 | 5 | 0.36 | 6.09 | 0.06 | 4 | 3.29 | 0.14 | 3 | 2 | 3.95 | 2.30 | |
| 174526.3-291229 | – | – | – | – | 6.67 | 0.16 | 2 | 2.31 | 0.09 | 4 | 4 | 0.46 | 1.60 | + |
Note: (†) These two 7 m sources correspond to a single source at 15 m.