Luminous Infrared Galaxies In the Local Universe
Abstract
We study the morphology and star formation properties of 159 local luminous infrared galaxy (LIRG) using multi-color images from Data Release 2 (DR2) of the Sloan Digital Sky Survey (SDSS). The LIRGs are selected from a cross-correlation analysis between the IRAS survey and SDSS. They are all brighter than 15.9 mag in the -band and below redshift , and so can be reliably classified morphologically. We find that the fractions of interacting/merging and spiral galaxies are and respectively. Our results complement and confirm the decline (increase) in the fraction of spiral (interacting/merging) galaxies from to , as found by Melbourne, Koo & Le Floc’h (2005). About 75% of spiral galaxies in the local LIRGs are barred, indicating that bars may play an important role in triggering star formation rates in the local universe. Compared with high redshift LIRGs, local LIRGs have lower specific star formation rates, smaller cold gas fractions and a narrower range of stellar masses. Local LIRGs appear to be either merging galaxies forming intermediate mass ellipticals or spiral galaxies undergoing high star formation activities regulated by bars.
1 INTRODUCTION
Ultraluminous infrared galaxies (ULIRGs) are a class of star forming galaxies discovered by the InfraRed Astronomical Satellite (IRAS). Studies have convincingly established that they are interacting/merging galaxies in the local universe (see, e.g., Sanders & Mirabel 1996 and Lonsdale et al. 2006 for reviews; see also Cui et al. 2002). These galaxies are experiencing massive starbursts (with infrared luminosity, ) and may eventually form sub- early type galaxies (Genzel et al. 2001). There is also a scaled-up version of ULIRGs at high redshift – the submillimeter emitting galaxies uncovered by deep SCUBA surveys in blank fields. These galaxies may, however, be forming more massive galaxies at earlier times (e.g., Tacconi et al. 2006).
Recently, luminous infrared galaxies (LIRGs, with ) has attracted much attention, especially after the launch of the (Werner et al. 2004). The increased sensitivity of allows us to probe this population at high redshift. In fact, observations of the Chandra Deep Field South (CDFS) and the Hubble Deep Field North (HDFN) reveal that the LIRGs contribute more than half of the comoving infrared luminosity density at (Pérez-González et al. 2005; Le Floc’h et al. 2005). An important question naturally arises: what is the morphology of these LIRGs? Are they mostly merging galaxies, just like ULIRGs as pointed out by Arribas et al. (2004)? The answer may offer clues how the high star formation rate in these galaxies is triggered.
The study of LIRGs is also important for understanding the star formation history in the universe. It is well known that the comoving star formation density steeply declines from to 0 by a factor of (e.g., Lilly et al. 1996; Madau et al. 1998). Recent observations of the CDFS and HDFN confirm the rapid decline of the comoving infrared luminosity since redshift (Pérez-González et al. 2005; Le Floc’h et al. 2005). The rapid decline in the star formation rate does not, however, mean that the stellar mass assembled is negligible since redshift . From the spectral energy distributions of galaxies, Dickinson et al. (2003) concluded that 30% to 50% of the stellar mass in present-day galaxies has been formed since . Most of this stellar mass buildup cannot occur in massive early-type galaxies as most of their stellar mass is already in place by redshift (e.g., Reddy et al. 2006). So the substantial stellar mass assembly since redshift likely occurs in intermediate-mass galaxies (so called “downsizing”, Cowie et al. 1996; Hammer et al. 2005; Bell et al. 2005; Juneau et al. 2005), with mass between to . As LIRGs contribute the majority of the star formation rate at , it is important to understand how this population evolves as a function of redshift in order to understand the decline in the star formation rate from redshift 1 to the local universe.
Zheng et al. (2004) studied the morphologies of 36 distant LIRGs () with HST images. They find that only 17% LIRGs are obvious mergers and the fraction of interacting/merging systems is at most 58%. Furthermore, distant LIRGs are classified as normal disk galaxies and are compact sources. The average stellar mass of LIRGs is . This study shows that a large fraction of distant LIRGs are star forming disk galaxies through various morphological phases at intermediate redshift, and a substantial fraction of the stellar mass in disk galaxies may be assembled through an LIRG phase since redshift 1. Although the sample size of Zheng et al. (2004) is small, subsequent works based on larger samples arrived at similar classification conclusions. For example, Bell et al. (2005) investigated several hundred infrared luminous galaxies with at z in CDFS and find that more than half are massive spirals and less than a third are strongly interacting/merging galaxies.
Melbourne et al. (2005) performed the most comprehensive study on the morphological evolution of LIRGs since using 119 LIRGs in the Great Observatories Origins Deep Survey-North field (GOODS-N). Their sample covers the redshift range from to 1. They derived the optical morphologies and photometries from HST images, redshifts from Keck observations, and the infrared luminosities from observations. They also find evidence for the morphological evolution for LIRGs in the last 8 Gyr. Above redshift 0.5, about half of LIRGs are spirals and the ratio of peculiar/irregular to spiral is about 0.7, and all morphological classes of LIRGs span a similar range of infrared and optical luminosities. In contrast, at lower redshift, spirals account for just one third of LIRGs, and they also appear to be slightly fainter than peculiar/irregular galaxies at similar redshift.
In addition to the morphological evolution, LIRGs in the local universe and those at high redshift may also differ in other aspects. For example, Reddy et al. (2006) find, from deep MIPS 24 m observations that LIRGs at have a wide range of stellar mass, spanning from to . Furthermore, based on observations, Pérez-González et al. (2005) investigated the evolution of the specific star formation rate (SFR per unit stellar mass) as a function of the total stellar mass since and find that LIRGs at higher redshift have higher specific SFRs than the local counterparts. These differences hint that local LIRGs may not be the exact analogues of LIRGs at high redshift, and thus it is important to establish the morphology and star formation properties of local LIRGs.
So far the local sample used to establish the evolution trend is still small. Ishida (2004) performed a morphological classification for a low redshift sample with 56 LIRGs drawn from the IRAS Bright Galaxy Sample (Soifer et al. 1987). Clearly a larger sample is desirable to firmly establish the properties of the local LIRGs, including their morphologies and star formation properties. We assemble such a sample by cross-correlating the IRAS source catalogue and the Data Release 2 (DR2) of the Sloan Digital Sky Survey (SDSS, see below). Our LIRG sample includes 159 objects with redshift . Due to the low-redshift of our objects, the linear physical resolution of the SDSS images is comparable to that achieved for the high redshift objects observed with ACS on board the HST (Melbourne et al. 2005). Therefore comparisons in the morphology of our local sample and those at high redshift can provide a clear picture for the morphological evolution of LIRGs since . The outline of the paper is as follows. In §2 we describe our local LIRG sample and in §3 we discuss how we perform the morphological classification and derive the star formation properties in LIRGs. We present our main results in §4 and finish with conclusions in §5. Throughout this paper we adopt a cosmology with a matter density parameter , a cosmological constant and a Hubble constant of .
2 THE SAMPLE
Our sample LIRGs are drawn from the LIRG catalog of Cao et al. (2006), who carried out a cross-correlation study of the IRAS point source catalogue (PSC) and faint source catalogue (FSC) (Moshir et al. 1992) with DR2 of the SDSS (Abazajian et al. 2004). The total number of LIRGs identified with high reliability from the FSC is 908. The IRAS survey covers all sky while the DR2 covers only 2627 square degree of sky at a (Petrosian) magnitude limit of 17.77 mag in the band. Note that the catalog of Cao et al. (2006) may miss some local LIRGs that are too faint (for example, due to heavy dust extinctions) to be included in the SDSS (for detail see Cao et al. 2006).
As pointed out by Fukugita et al. (2004), a reliable visual morphological classification can be performed only for SDSS galaxies brighter than mag after correcting for the Galactic extinction (Schlegel et al. 1998). In addition, SDSS spectroscopic selection of galaxies become incomplete at mag (Kauffmann et al. 2003). We therefore restrict our sample LIRGs to be , which reduces the number of LIRGs to 210. Furthermore, we selected only the LIRGs from the FSC LIRG sample of Cao et al. (2006) with IRAS 60m flux greater than 0.3 Jy (rather than 0.2 Jy for the whole sample) to maximize the sample completeness. This step further reduces the number of LIRGs to 159. While our selection criteria remove half of LIRGs with , we show in §4 below that these do not lead to significant biases in morphological classifications and stellar mass distributions.
The r-band magnitude, redshift and infrared luminosity distributions of the sample are shown in Fig. 1. It is clear from Fig. 1 that our sample LIRGs have , and most are in the redshift range of 0.04 0.08. The LIRG sample in this redshift range is just what is needed to extend the analysis for the evolution of LIRGs based on CDFS and GOODS-N from high redshift to the local universe. Fig. 1 (bottom left panel) also shows that most of our LIRGs have infrared luminosity smaller than .
3 MORPHOLOGICAL CLASSIFICATION AND ESTIMATION OF STAR FORMATION PARAMETERS
In this section, we first describe our classification schemes and procedures in detail in §3.1, and then discuss how we derive the stellar mass, star formation rate, and cold molecular gas mass in §3.2. For the majority of our galaxies (), the star formation properties can be derived in a straightforward manner, however for some galaxies (e.g., those in a pair or group of galaxies, see Fig. 2 for examples), extra care must be taken, and this is described in more detail in §3.3.
3.1 Morphological Classification
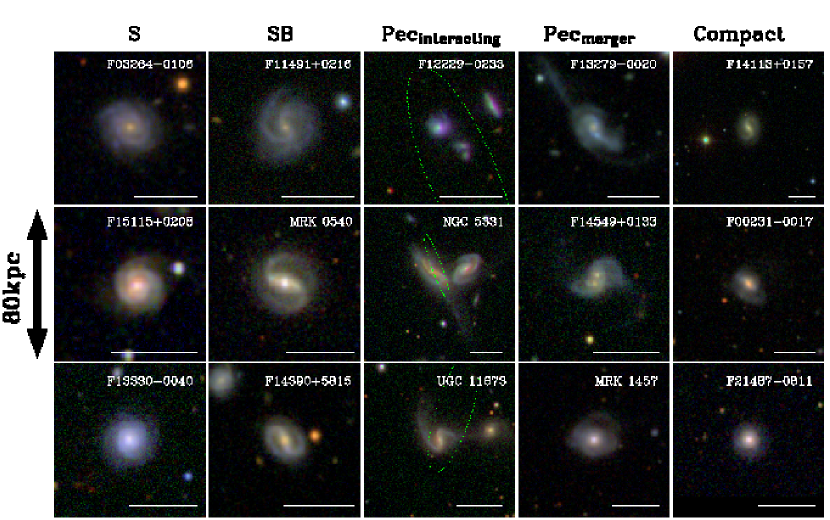
In order to compare the morphology of local LIRGs and those at high redshift, we adopted the same classification scheme as Melbourne et al. (2005), who divided galaxies into peculiars (interacting and merging), spirals (including barred and non-barred, face-on and edge-on spirals), compact galaxies and elliptical galaxies. The peculiar galaxy type is characterized by irregular, asymmetric shape and show clear interacting/merging sign or merger relics, such as tidal features. The compact type is signified by their small sizes (for a quantitative criterion, see below), while spirals and ellipticals have their usual definitions, for example the spirals have (largely) symmetric shape, obvious disk and bulge components and exhibit no disturbed spiral arms.
We performed the visual classification for all LIRGs primarily in the r-band, but also used composite color images as a cross-check, a procedure adopted by Zheng et al. (2004) and Melbourne et al. (2005) as well. The color images were produced by combining (, , ) filter data following Lupton et al. (2004)111All the images are available at http://www.jb.man.ac.uk/~smao/LIRG.html. The classification was done independently by four of us (JLW, XYX, ZGD, HW). For the majority of galaxies, the classification was the same. However, for of LIRGs, the classifications differ. For these, a consensus classification was adopted after discussions.
In light of the important role galactic bars may play in star formation processes, we further divided the spirals into barred and non-barred types. Reliable visual identification of bars can, however, only be performed for low-inclination angle () spirals with ( means edge-on). Furthermore only strong/obvious bars can be identified with high confidence. So to double check the reliability of visual bar identifications, we also used a quantitative method to identify bars by examining the changes of isophote shapes in the -band and the color images (e.g., Jogee et al. 2004; Zheng et al. 2005). This method relies on the fact that at the end of strong bars, there are often rapid changes in the position angle and ellipticity. This approach identified nearly the same barred spirals as the visual search, so we believe our classification of barred galaxies is reliable.
In practice we first selected isolated compact galaxies using the criterion that their half-light radii must be smaller than 3 kpc. The half-light radius is taken to be the -band Petrosian radius , within which half of the -band Petrosian luminosity is enclosed. There are 19 isolated compact galaxies in our LIRG sample. For the remaining 139 LIRGs, we carried out the morphological classifications as discussed above. Note also that there are no early type galaxies in our sample, so our objects fall into only three categories (peculiar, spiral, and compact galaxies).
3.2 Stellar Mass, Star Formation Rate, and Cold Molecular Gas Mass
LIRGs are undergoing high star formation activities, and so the stellar population in these galaxies is a mix of young and old stars. The stellar mass for the old (evolved) stellar population is estimated based on the SDSS photometric data following Bell et al. (2003):
| (1) |
where is the -band absolute magnitude, is the rest-frame color in the AB magnitude system. The term 4.67 is the absolute magnitude of the Sun in the SDSS band. The photometric -correction is calculated using the method of Blanton et al. (2003, kcorrect v4_1_4). The coefficients and are taken from Table 7 of Bell et al. (2003). Throughout this paper a Salpeter (1955) stellar initial mass function (IMF) is used with and . This gives a stellar mass 0.15 dex higher (the last term in eq. 1) than that in Bell et al. (2003) where a “diet” Salpeter stellar IMF is used. The stellar mass estimated using eq. (1) is uncertain by about 0.3 dex due to the effects of dust, galaxy age and star formation history. The bottom right panel of Fig. 1 shows the stellar mass distribution of 159 local LIRGs. A more detailed discussion will be presented in §4.2, together with their velocity dispersion information.
The star formation rate (SFR) of LIRGs is derived following Kennicutt (1998a)
| (2) |
where is the infrared luminosity between 8-1000 m; the systematic uncertainty in the SFR normalisation is about a factor of 2-3 (Kennicutt 1998b). The bottom left panel of Fig. 1 shows the distribution of SFR for our LIRG sample.
The cold molecular hydrogen reservoir in LIRGs will limit how many new stars can be formed in the current starburst episode, and so it is important to estimate the molecular hydrogen mass. To do this, we first derive the CO luminosity using the correlation between the CO luminosity and the infrared luminosity obtained by Gao & Solomon (2004a),
| (3) |
and then obtain the molecular hydrogen mass using the relation
| (4) |
(Gao & Solomon 2004b; Solomon & Bout 2005), where we take as 4.6 , the approximate value for the Milky Way. Note that the adopted conversion factor may over-estimate the molecular gas mass by a factor of few for interacting/merging LIRGs (Solomon & Bout 2005).
3.3 Parameter Estimation for Merging and Deblended Galaxies
For the majority () of our galaxies, the procedure to derive various quantities as discussed in the last section is straightforward. However, for some () of our galaxies, the determination is not simple for two reasons. First, given the poor IRAS resolution (the average major axis of the error ellipse in position is approximately 40 at 60 m), there may be a pair or a group of galaxies within an IRAS error ellipse. Fig. 2 shows three examples. In such cases, it is difficult to determine which galaxy (or galaxies) is the true contributor of the infrared emission. Second, the SDSS photometric pipeline tends to deblend very extended galaxies or remnants of mergers into several small parts. For multi-nucleus systems, the SDSS pipeline may also identify them as several galaxies. When we performed the cross-correlation of an IRAS object with the SDSS catalogue, only one optical object in the SDSS is identified as the counterpart of an IRAS source. For artificially deblended objects, this will result in an under-estimate of the stellar mass for artificially deblended objects.
To solve the problem of deblending, we carefully examined the SDSS image of each object. We flag all objects within 3 Petrosian half-light radii () that are brighter than 10% of the identified galaxy in either the - and -band. After excluding probable foreground and background objects, the stellar mass of the identified galaxy and all the deblended parts are summed up to give the total stellar mass. Galaxies outside , but with obvious merger signs (such as tidal tails and bridges) are also included in the total stellar mass.
As we mentioned above, due to the low spatial resolution of IRAS, when the identified source is in a pair or group of galaxies, the infrared luminosity may be from the whole system, rather than just from a single object. For these sources, we visually examined the region covered by the IRAS error ellipses in the -band images. We include all galaxies with obvious interacting/merging signatures in the infrared emission and the stellar mass calculation. For those galaxies without obvious signs of interacting or mergers, we also checked whether their redshifts are available in the SDSS or the NASA/IPAC Extragalactic Database (NED) 222The NASA/IPAC Extragalactic Database (NED) is operated by the Jet Propulsion Laboratory, California Institute of Technology, under contract with the National Aeronautics and Space Administration.. If they are and their redshifts are the the same as our target, then we also include them as a contributor of the infrared emission. For F12229-0233 in Fig. 2, there are three galaxies within the IRAS error ellipse, so we included all of them in the stellar mass and infrared luminosity calculations. Fog NGC 5331 and UGC 11673, the error ellipse intercepts one member of an interacting pair. For these two cases, we included both in the total stellar mass budget. For NGC 5331, this is consistent with the high-resolution images obtained by Surace et al. (2004) who presented a re-analysis of IRAS images for 106 interacting galaxies. The infrared contours for NGC 5331 (at 10% peak flux level, see their Fig. 1) from 12 m to 100 m clearly encloses both galaxies, suggesting that we should include both galaxies in the infrared luminosity and stellar mass calculations.
In total, there are 43 optical counterparts of IRAS sources where the stellar mass is calculated from the deblended or multiple components of the system. Among them, 23 objects have companions or deblended objects occurred within , and 23 have companions outside. There are three (overlapping) cases where there are deblended components within , and interacting pairs outside .
Our procedures are not perfect. The first problem arises due to un-identified contributors to the infrared emission. Companions that contribute to the infrared emission, but without obvious merging signatures, will be missed in our stellar mass budget. The second problem is that if the infrared emission comes from only one galaxy in an interacting or merging system, our procedure will obviously over-estimate the stellar mass corresponding to the infrared galaxy, as we include the stellar mass from all members. Such ambiguous cases are relatively few in number, and so our results should not be significantly affected, although we caution that interacting/merging galaxies will suffer most from the problems discussed above.
4 RESULTS
4.1 Morphology of Local LIRGs and Comparisons with high redshift
Out of the 159 sample LIRGs, 19 LIRGs are classified as isolated compact category according to the criterion that their half-light radii should be smaller than 3 kpc. 77 (48%) can be unambiguously classified as interacting/merging galaxies or merger remnants with obvious merger relics. There are an additional 9 objects which show signs of possible interacting or relics of merger. If we add them into the interacting/merging class, the total fraction can be as high as . This fraction is still significantly smaller than that in ULIRGs where almost all are merging/interacting systems. For the remaining LIRGs, 63 (40%) are classified as normal spirals, of which 11 have high inclination angles () and hence difficult to identify bars in these galaxies. For the remaining 52 spirals with low inclination angles, 39 (75%) show clear strong bars. This large fraction of barred spirals indicates that bars may play an important role in triggering the intense star formation activities in the LIRGs.
Fig. 2 shows three examples for each category. The first and second columns show the normal spirals and barred spirals respectively. Clearly some barred spirals have close companions (at least in projection). It is possible that such minor tidal interactions produce both the bar and the symmetric spiral arms, and provide the perturbations to channel the gas to the central regions. The third and fourth columns of Fig. 2 show the interacting and merging LIRGs, which exhibit all possible interacting/merging stages, such as interacting pair galaxies, multi-merging groups of galaxies, mergers with two close nuclei, and galaxies with a single nucleus but with merger relics. The compact class of LIRGs is shown in the last column of Fig. 2. They are on average at smaller redshift than the whole sample. These objects all have compact sizes, but their morphologies appear to be diverse, ranging from spirals with clear symmetric arms to merging galaxies with tidal features, implying that they may not have a homogeneous physical origin. From the spectroscopic information (Brinchmann et al. 2004), the active galactic nuclei (AGN) fraction in the compact category is not much higher than that in other classes of LIRGs, and so AGNs may not be the main reason for their compact morphology.
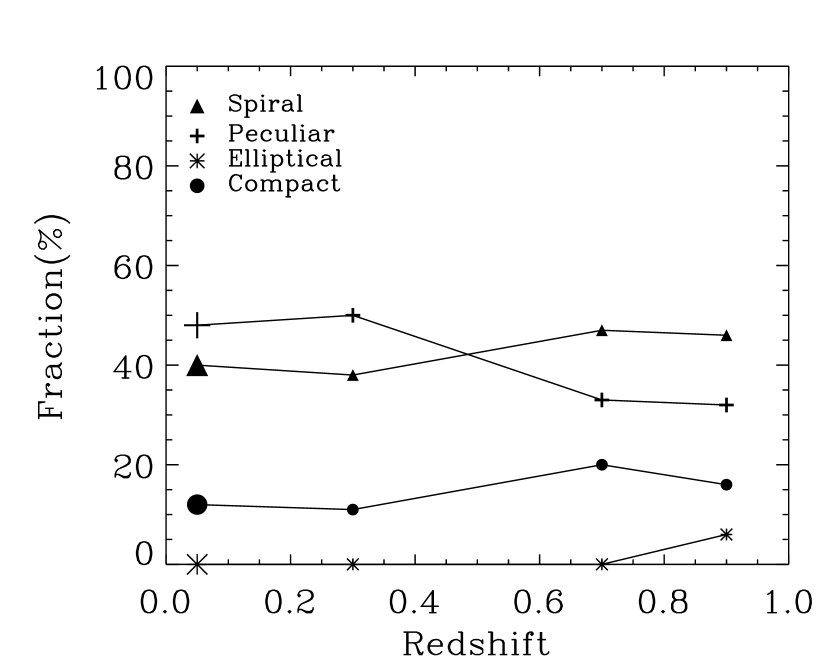
Our morphological classifications for local LIRGs are plotted in Fig. 3 together with the corresponding results from those of LIRGs at higher redshift () taken from Table 1 of Melbourne et al. (2005). Our results are consistent with the extrapolation of theirs to the local universe. These results clearly indicate that the fraction of interacting/merging galaxies increases from about at to about at , accompanied a decrease in the fraction of spirals from roughly 50% to 40%. Note that most of the changes occur between redshift 1 and 0.3 and there are virtually no changes from redshift 0.3 to the present day.
As discussed in §2, to obtain reliable visual classifications, we only selected galaxies brighter than 15.9 in the -band. To see how this magnitude cutoff affects the morphological mixes, we also performed rough classifications for 381 LIRGs in the FSC sample of Cao et al. (2006) with mag and below redshift 0.1. We find that the relative fractions of different categories do not differ significantly from those of the bright LIRG sample () we focused on. Thus our magnitude cutoff has not introduced significant biases into the morphological types of local LIRGs. Note also that the LIRG samples used by Reddy et al. (2006) and Le Floc’h et al. (2005) are also optical magnitude and infrared flux limited samples.
4.2 Stellar Mass, Specific SFR and Cold Molecular Mass of Local LIRGs
The bottom right panel of Fig. 1 shows the stellar mass distribution of 159 local LIRGs. We can see from Fig. 1 that the stellar mass of the old stellar population for most local LIRGs is in the range of 310 to 510, indicating most local LIRGs are intermediate mass galaxies, within a factor of few of the stellar mass in the Milky Way (where , see Mo & Mao 2004, §2.3).
The left column of Fig. 4 further examines the distribution of infrared luminosity for each category of LIRGs. As can be seen, the peculiar galaxies appear to have a relatively extended tail toward larger infrared luminosity compared with other types, while the compact type appears to be skewed toward smaller values. Table 1 lists in more detail the number of objects for each morphological class in different infrared luminosity ranges. From Table 1, we can see that the fraction of interacting/merging LIRGs increases from 40% to 100% when the infrared luminosity increases from to larger than . In contrast, there are no spirals with infrared luminosity larger than , implying that the local spirals LIRGs have lower infrared luminosities than those of interacting/merging LIRGs. The latter dominates in number at higher infrared luminosity, just as in ULIRGs. This result is consistent with that obtained from a deep wide-field survey for LIRGs by Ishida (2004).
The middle column in Fig. 4 illustrates the stellar mass distribution for each category of LIRGs. Although the shapes of distributions differ in detail for different morphological types, the median stellar mass is almost the same for normal disk galaxies and interacting/merging system; only the compact galaxies has a median stellar mass that is lower by about 0.2 dex. We also checked the stellar mass distributions for the whole LIRG sample of Cao et al. (2006) with , rather than only for the 159 galaxies with as shown in Fig. 4. The stellar mass range of the fainter sample is similar to the brighter one, suggesting that our magnitude limit (imposed in order to obtain reliable visual morphological classifications) had no significant impact on the stellar mass distribution. Therefore, the stellar mass range of local LIRGs appears to be narrower than that of high redshift LIRGs (from to ), as found by several recent studies using Spitzer 24m observations (Reddy et al. 2006; Le Floc’h et al. 2005; Pérez-González et al. 2005).
The stellar mass inferred using eq. (1) depends on various assumptions such as stellar populations. It is therefore interesting to cross-check whether their dynamical properties are also consistent with those of an intermediate mass population. The MPA group provides estimates of the velocity dispersion of these galaxies (D. Schlegel, et al. in preparation as quoted in Heckman et al. 2004). There are 152 our LIRGs with available velocity dispersions 333http://www.mpa-garching.mpg.de/SDSS/ and have a median per-pixel signal-to-noise ratio greater than 10. As the instrumental resolution of the SDSS is approximate 70 km s-1, we exclude objects with velocity dispersion smaller than 70 km s-1. Visual checks of the images also reveal that three objects have spectroscopic locations displaced from the central regions of galaxies, and so they are excluded from the velocity dispersion analysis, leaving us with a total of 147 LIRGs with velocity dispersions. The right column of Fig. 4 shows the histograms of velocity dispersion for different types of galaxies. It can be seen that all types of galaxies have similar ranges of velocity dispersions; the median value for each type is , similar to that () for an galaxy (see Table 1 Bernardi et al. 2005). Note that the velocity dispersions for several objects in the peculiar class exceed , which indicates that these galaxies may not have reached dynamical equilibrium.
There may be other differences between the local and high redshift LIRGs as well. The left panel of Fig. 5 shows the specific SFR (SFR per units stellar mass) vs. the stellar mass for sample LIRGs. Clearly, there is a trend that more massive LIRGs have smaller specific SFRs, which is also seen in studies of high redshifts LIRGs based on observations. This trend is partly due to the inverse proportionality of the specific SFR on the stellar mass. Quantitatively, Fig. 5 shows that the SFRs for most of sample LIRGs are between 10 to 100 , with a median of about 30 . Most of the specific SFRs lie between 0.06 to , consistent with those derived by Pérez-González et al. (2005) for LIRGs below redshift 0.4 (see their Fig. 11). Our sample extends the Spitzer samples to the local universe, as they have very few galaxies below redshift . In contrast, the specific SFRs of high redshift LIRGs span two order of magnitude from to (Pérez-González et al. 2005), substantially higher than those for the local LIRGs.
As shown in §3.2, the stellar mass and cold molecular gas mass can be estimated using eqs. (1-4), which can then be combined to derive the cold gas fraction, . This is shown in the right panel of Fig. 5. The average cold gas fraction is , which is substantially smaller than that at high redshift, namely about (Reddy et al. 2006). The low gas fraction () in the local LIRGs also implies that the total stellar mass built in the LIRGs episode will be limited, i.e., the stellar mass buildup has almost ceased in the local universe. Note that if the conversion factor adopted in eq. (4) over-estimates the molecular gas mass in the local universe for interacting/merging LIRGs (Solomon & Bout 2005), the difference in the cold gas mass fraction between low- and high-redshift will be even larger.
5 CONCLUSIONS
In this paper, we have studied a sample of 159 LIRGs obtained by cross-correlating IRAS and the DR2 of the SDSS. We performed a careful morphological classification of these galaxies and studied their physical properties. We compared their properties with higher redshift LIRGs, and found systematic differences. Our main conclusions are as follows:
-
1.
In the local LIRGs, the fractions of interacting/merging and spiral galaxies are and respectively. This confirms the decline of the fraction of spiral galaxies in LIRGs from redshift 1 to the local universe, as first found by Melbourne, Koo & Le Floc’h (2005).
-
2.
The majority () of our disk galaxies are strongly barred, indicating that bars may play a key role in star forming galaxies (with SFR ) in the local universe.
-
3.
Most LIRGs are intermediate mass galaxies, as seen from their inferred stellar masses and observed velocity dispersions.
-
4.
Compared with high redshift LIRGs, local LIRGs have lower specific star formation rates, smaller cold gas fractions and a narrower range of stellar masses.
We conclude that most local LIRGs are either major mergers between gas-rich spirals enroute to the formation of intermediate mass ellipticals, or massive disk galaxies undergoing an episode of star formation regulated by bars. Most of the gas in the local universe has already been turned into stars, and hence gas-rich galaxies are rare. Either major mergers and/or bars are required to bring the gas into the centers of galaxies and trigger the high star formation rates seen in LIRGs (see Jogee, Scoville & Kenney 2005 for an excellent discussion). On the other hand, higher redshift LIRGs have much higher gas fractions (Reddy et al. 2006). The higher gas reservoir makes it more likely that the LIRG phase can occur in more numerous galaxies, and in a variety of galaxies ranging from dwarf galaxies, galactic bulges to cores of ellipticals, resulting in a larger range of stellar masses than local LIRGs.
While the local LIRGs are rare, and can just account for about 5% of the total infrared energy from galaxies (Le Floc’h et al. 2005), nevertheless, their proximity renders detailed studies of these objects easier than their much more abundant high redshift counterparts. The understanding of these objects may provide important insights into the physical mechanisms that drive the star formation process in the local universe, and how disks and spheroidals are assembled both locally and in the past.
References
- (1) Abazajian, K., et al. 2004, AJ, 128, 502
- (2) Arribas, S., Bushouse, H., Lucas, R. A., Colina, L., & Borne, K. D. 2004, AJ, 127, 2522
- (3) Bell, E. F., Mcintosh, D. H., Katz, N., & Weinberg, M. D. 2003, ApJS, 149, 289
- (4) Bell, E. F., et al. 2005, ApJ, 625, 23
- (5) Bernardi, M., Sheth, R. K., Nichol, R. C., Schneider, D. P., & Brinkmann, J. 2005, AJ, 129, 61
- (6) Blanton, M. R., et al. 2003, AJ, 125, 2348
- (7) Brinchmann, J., Charlot, S., White, S. D. M., Tromonti, C., Kauffmann, G., Heckman, T., & Brinkmann, J. 2004, MNRAS, 351, 1151
- (8) Cao, C., Wu, H. , Wang, J. L., Hao, C. N., Deng, Z. G., Xia, X. Y., & Zou, Z. L. 2006, ChJAA, 6, 197
- (9) Cowie, L. L., Songaila, A., Hu, E. M., & Cohen, J. G. 1996, AJ, 112, 839
- (10) Cui, J., Xia, X. Y., Deng, Z. G., Mao, S., & Zou, Z. L. 2001, AJ, 122, 63
- (11) Dickinson, M., Pavovich, C., Ferguson, H. C., & Budavári, T. 2003, ApJ, 587, 25
- (12) Elbaz, D. 2005, SSRv, 119, 93
- (13) Fukugita, M., Nakamura, O., Turner, E. L., Helmboldt, J., & Nichol, R. C. 2004, ApJ, 601, L127
- (14) Gao, Y., & Solomon, P. M. 2004a, ApJS, 152, 63
- (15) Gao, Y., & Solomon, P. M. 2004b, ApJ, 606, 271
- (16) Genzel, R., Tacconi, L. J., Rigopoulou, D., Lutz, D., & Tecza, M. 2001, ApJ, 563, 527
- (17) Hammer, F., Flore, H., Elbaz, D., Zheng, X. Z., Liang, Y. C., & Cesarsky, C. 2005, A&A, 430, 115
- (18) Heckman, T. M., Kauffmann, G., Brinchmann, J., Charlot, S., Tremonti, C., & White, S. D. M. 2004, ApJ, 613, 109
- (19) Ishida, C. M. 2004, Ph.D. Thesis, University of Hawaii
- (20) Jogee, S., et al. 2004, ApJ, 615, L105
- (21) Jogee, S., Scoville, N., & Kenney, J. D. P. 2005, ApJ, 630, 837
- (22) Juneau, S., Glazebrook, K., & Crampton, D. 2005, ApJ, 619, L135
- (23) Kauffmann, G., et al. 2003, MNRAS, 341, 33
- (24) Kennicutt, R. C. 1998a, ARA&A, 36, 189
- (25) Kennicutt, R. C. 1998b, ApJ, 498, 541
- (26) Le Floc’h, E., et al. 2005, ApJ, 632, 169
- (27) Lilly, S. J., Le Fevre, O., Hammer, F., & Crampton, D. 1996, ApJ, 460, L1
- (28) Lonsdale, C., Farrah, D., & Smith, H. 2006, in “Astrophysics Update 2 - topical and timely reviews on astronomy and astrophysics”, Ed. John W. Mason (Springer Verlag) (astro-ph/0603031)
- (29) Lupton, R., Blanton, M.R., Fekete, G., Hogg, D.W., O’Mullane, W., Szalay, A. & Wherry, N. 2004, PASP, 116, 133
- (30) Madau, P., Pozzetti, L., & Dickinson, M. 1998, ApJ, 498, 106
- (31) Melbourne, J., Koo, D. C., & Le Floc’h, E. 2005, ApJ, 632, L65
- (32) Mo, H. J., & Mao, S. 2004, MNRAS, 353, 829
- (33) Moshir M., Kopan G., Conrow J., et al. 1992. Explanatory Supplement to the IRAS Faint Source Survey, Version 2, JPL D-10015 8/92, Pasadena: JPL
- (34) Pérez-González, P. G., et al. 2005, ApJ, 630, 82
- (35) Reddy, N. A., Steldel, C. C., Fadda, D., Yan, L., Pettini, M., Shapley, A. E., Erb, D. K., & Adelberger, K. L. 2006, ApJ, in press (astro-ph/0602596)
- (36) Salpeter, E. 1955, ApJ, 121, 161
- (37) Sanders, B. T., & Mirabel, I. F. 1996, ARA&A, 34, 749
- (38) Schlegel, D. J., Finkbeiner, D. P., & Davis, M. 1998, ApJ, 500, 525
- (39) Solomon, P. M., & vanden Bout, P. A. 2005, ARA&A, 43, 677
- (40) Soifer, B. T., Sanders, D. B., Madore, B. F., Neugebauer, G., Danielson, G. E., Elias, J. H., Lonsdale, C. J., & Rice, W. L. 1987, ApJ, 320, 238
- (41) Surace, J. A., Sanders, D. B., & Mazzarella, J. M. 2004, AJ, 127, 3235
- (42) Tacconi, L. J., et al. 2006, ApJ, 640, 228
- (43) Werner, M. W., et al. 2004, ApJS, 154, 1
- (44) Zheng, X. Z., Hammer, F., Flores, H., Assémat, F., &Pelat, D. 2004, A&A, 421, 847
- (45) Zheng, X. Z., Hammer, F., Flores, H., Assémat, F., & Rawat, A. 2005, A&A, 435, 507
| 11 log | 11 log 11.3 | 11.3 log 11.6 | 11.6 log | |||||
|---|---|---|---|---|---|---|---|---|
| N | % | N | % | N | % | N | % | |
| Total | 159 | 100 | 111 | 100 | 39 | 100 | 9 | 100 |
| Non-barred spiral | 13 | 8 | 10 | 9 | 3 | 8 | 0 | 0 |
| Barred spiral | 39 | 25 | 30 | 27 | 9 | 23 | 0 | 0 |
| Highly-inclined | 11 | 7 | 10 | 9 | 1 | 3 | 0 | 0 |
| Peculiar | 77 | 48 | 45 | 41 | 23 | 59 | 9 | 100 |
| Compact | 19 | 12 | 16 | 14 | 3 | 8 | 0 | 0 |