The Narrow Line Region of the Seyfert 2 galaxy Mrk 78.
An infrared view
Abstract
We report near-infrared spectroscopic data for the Seyfert 2 galaxy Mrk 78, taken with the LIRIS near-infrared camera/spectrometer at the William Herschel Telescope (WHT). The long-slit spectra clearly show extended emission. The resolution and depth of the near-infrared spectra allows the examination of its morphology and ionization regions, and a direct comparison with similarly deep visible spectra. The emission-line ratios obtained are used to derive the extinction towards the nucleus. The detection of strong features such as [Fe II], H2, hydrogen recombination lines and the coronal [Si VI]1.962 line is used to study the kinematics and excitation mechanisms occurring in Mrk 78, revealing that despite of the strong radio-jet interaction present in this object, photoionization from the active nucleus dominates the narrow line region emission, while UV fluorescence is the source of the H2 emission. Lines with extended emission yield velocity distributions with an amplitude of about 600 km s-1, the consequence of an eastern lobe moving away from us plus a western lobe with the opposite contribution. We used the photoionization code CLOUDY to recreate a typical narrow line region region, to derive the ionization parameter, and to compare our spectral data with diagnostic diagrams.
1 Introduction
The availability of advanced near-infrared (NIR) instrumentation with panoramic arrays offers the possibility of employing diagnostic techniques that were formerly reserved to optical spectroscopy. Besides, long-slit NIR spectroscopy offers the possibility of characterizing the velocity field in AGN, using different line species from high ionization emission lines (e.g., [Si VI] 1.962 m), H recombination lines, Fe lines (mostly triggered by shocks), molecular H lines, or even stellar absorption features. These constitute a plethora of diagnostic tools that can be used to characterize many of the relevant phenomena acting in AGN, from the regions close to the actual nucleus, to partially ionized zones, to the borders of molecular clouds, etc. Furthermore, dust extinction is reduced in the IR with respect to the optical range, thus revealing lines whose optical counterparts could be obscured.
The velocity dispersions measured in the narrow emission line region (NLR) of Seyfert galaxies are believed to be governed by the galaxy’s gravitational field (Whittle, 1992; Nelson & Whittle, 1996). However, in a minority of Seyferts, with relatively luminous linear radio sources, there is evidence for significant additional (jet related) acceleration (Ferruit, 2002; Veilleux et al., 2002). The interplay between radio-emitting flows and the line-emitting gas is important in the study of active galaxies, especially those with observable radio jets (Cecil et al., 2000, 2002; Ferruit et al., 1999). This interplay can occur in a wide range of circumstances, for instance, radio jets can be disrupted or deflected by the material in the nuclear and interstellar media. In turn, the jets can ablate, shock accelerate, or destroy line-emitting clouds, or even trigger bursts of star formation. Mrk 78 is a classical example of an AGN with a jet–gas interaction, showing large bipolar flows (Whittle et al., 1988; Pedlar et al., 1989), with about half of the NLR flux originating in two components, having velocities of 680 km s-1 and km s-1, respectively.
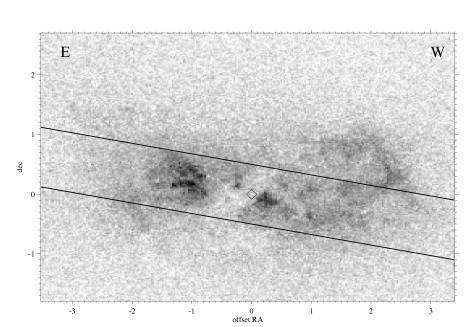
In this paper we present NIR long-slit data of Mrk 78 with the aim of understanding and characterizing the mechanisms responsible for its emission spectrum. Mrk 78 is a Seyfert 2 with galactic extinction amounting to mag (Schlegel et al., 1998). Its measured redshift () (Michel & Huchra, 1988) gives a distance of 150 Mpc and a physical scale of 715 pc/arcsec ( = 75 km s-1 is used throughout this paper). HST WFPC and FOC images taken in optical broad-band filters and [O III] 5007 emission (Capetti et al., 1994; Whittle & Wilson, 2004) show a complex structure of ionized gas aligned with the radio axis at PA = 84 plus a dust lane running across the galaxy center at PA = 135∘ (see Fig.1). No signs of broad emission line region (BLR) emission has been detected from spectropolarimetry (Tran, 1995). In the soft X-ray images, taken by HRI/ROSAT, Mrk 78 appears extended and its spectrum can be fitted by a thermal plasma plus galactic extinction (Levenson et al., 2001).
Section 2 describes the observations, and Section 3 presents the main results, covering first the nuclear emission to continue with the extended emission spectra and the kinematics obtained from the line profiles and line displacements. Section 4 discusses the extinction towards Mrk 78, and makes an attempt at disentangling the various ionizing mechanisms at play in Mrk 78. Finally, Section 5 summarizes the main conclusions.
2 Observations and Data Reduction
NIR spectra in the range 0.8–2.4 m were obtained on the night of 2005 March 22 at the 4.2 m William Herschel Telescope (WHT) using LIRIS, a recently commissioned NIR camera/spectrometer (Manchado et al., 2004; Acosta-Pulido et al., 2003). LIRIS is equipped with a Rockwell Hawaii 10241024 HgCdTe array detector. The spatial scale is 0.25 arcsec/pixel and the slit width used during the observations was 1′′, allowing a spectral resolution of 600 km s-1 and 650 km s-1 in the and spectra, respectively. The slit was oriented along PA = 80∘, centred on the galaxy nucleus (see Fig. 1). Weather conditions were relatively good, although with sparse cirrus. The seeing during our observations varied bewteen 1 and , measured from the FWHM of the comparison stars in our NIR spectra.
Observations were performed following an ABBA telescope-nodding pattern, placing the source in two positions along the slit, separated by 15′′. Individual frames were taken with integration times of 300 s and total on-source integration times of 60 min in each of the and spectra. The wavelength calibration was provided by observations of argon and xenon lamps available in the calibration unit at the A&G box of the telescope. In order to obtain the telluric correction and the flux calibration, the nearby HD 61232 A0 V star was observed with the same configuration as the galaxy. The data were reduced following standard procedures for NIR spectroscopy, using IRAF111IRAF is distributed by the National Optical Astronomy Observatories, which are operated by the Association of Universities for the Research in Astronomy, Inc., under cooperative agreement with the National science Foundation. http://iraf.noao.edu/ and the LIRIS-QL dedicated software. Consecutive pairs of AB two-dimensional spectra were subtracted to remove the sky background. The resulting frames were then wavelength-calibrated and flat-fielded before registering and coadding all frames to provide the final spectrum. The final wavelength-calibrated galaxy spectra were divided by a composite spectrum to remove telluric contamination. This composite spectrum was generated from the observed spectra of A0 V star HD 61232, divided by a Vega model convolved with the actual spectral resolution as described by Vacca et al. (2003). Differences in the strength of telluric features likely due to mismatch of air masses and variation of atmospheric conditions between observations of the galaxy and the reference star are taken into account using Beer’s law. The IRAF task telluric was used in this step. The flux calibration was carried out by normalizing with the magnitudes provided in the 2MASS survey catalogue (Cutri et al., 2003). The agreement in the continuum flux level in the overlap region for the and spectra is quite good in spectral shape and absolute value (about 15%).
3 Results
3.1 Nuclear Emission
In order to study the nuclear emission we have extracted a spectrum covering 1.25 arcsec centred on the maximum of the galaxy profile. We have identified the maximum of the continuum as the position of the active nucleus and registered in the [O III] maps (see Fig. 1), as presented in Whittle & Wilson (2004). These authors have done the registration of the optical (with HST spatial resolution) and radio images using absolute ground–based astrometry (Clements, 1981). They found a good alignment between the peak of the optical images and the position of the radio core. This fact gives confidence about the NIR peak should also coincide with the position of their nucleus. The resulting nuclear spectra in the , and ranges are plotted in Figs 2, 3, and 4, where the wavelength has been translated to the observer’s rest frame. The most obvious features in the nuclear spectra are [S III]0.907, 0.953, He I1.083, [Fe II]1.256, 1.643, Pa, Pa, and the coronal line [Si VI] 1.962 (all wavelengths are given in m). The recombination line Br is also present in the band, although it appears very weak and is probably immersed in an absorption feature. For this reason its measured flux is subject to a large uncertainty. It is noteworthy to mention that in other Seyfert 2 galaxies, e.g., NGC 2273 and NGC 4569, this line is not found (Rhee & Larkin, 2005).
Emission from the H2 molecule is clearly detected, whose most prominent lines are the transitions H2 1-0 S(2) and H2 1-0 S(1). Both H2 2-1 S(1) and H2 1-0 S(0) emission lines are detected at level.
Several other lower-intensity lines are detected in the spectra, namely [Ca I] 0.985, [S VIII] 0.991, He II 1.012, [S II] 1.032 (a blend of four [S II] transitions) and [P II] 1.188, which has particular relevance as a discriminator for different excitation mechanisms of the gas (Oliva et al., 2001).
Wherever possible all features were measured by fitting a Gaussian component using the program twofitlines (Acosta-Pulido, 2000), developed in the IRAF enviroment, and the resulting values are reported in Table 1. The [Si VI] and H2 1–0 S(3) lines are strongly blended and two Gaussians were employed to separate the emission from these lines (the Starlink program DIPSO was used to perform the fits). The resulting fluxes and EWs are also reported in Table 1. The relative intensity between the H2 1–0 S(3) and H2 1–0 S(1) lines is 0.83, which is in good agreement with the theoretically predicted value of 1 for a wide range of conditions (Draine & Woods, 1990), hence encouraging confidence concerning the deblending procedure. The [Si VI] line appears broader ( Å or 1100 km s-1 after deconvolution) in comparison to other detected infrared lines ( km s-1). Rodríguez-Ardila et al. (2002) claimed a trend of increasing line widths with increasing ionization potential, perhaps indicating the existence of an emission region for the coronal lines closer to the nucleus than the classical NLR.
| Line Nucleus | Flux | EW | |
|---|---|---|---|
| (m) | (10 | () | |
| 0.907 | 3.54 0.21 | -21.5 | |
| 0.953 | 6.87 0.21 | -42.5 | |
| 0.985 | 0.39 0.06 | -3.03 | |
| 0.991 | 0.17 0.03 | -1.62 | |
| HeII | 1.012 | 0.59 0.05 | -3.26 |
| 1.032 | 0.71 0.12 | -4.05 | |
| HeI | 1.083 | 5.40 0.14 | -31.3 |
| 1.189 | 0.53 0.09 | -2.38 | |
| 1.256 | 0.96 0.13 | -5.93 | |
| Pa | 1.282 | 1.75 0.25 | -10.9 |
| 1.643 | 0.85 0.23 | -6.25 | |
| Pa | 1.875 | 4.33 0.18 | -40.5 |
| H2 1-0S(3) | 1.955 | 0.43 0.11 | -8.34 |
| 1.962 | 1.97 0.17 | -17.6 | |
| H2 1-0S(2) | 2.032 | 0.30 0.08 | -3.56 |
| H2 1-0S(1) | 2.121 | 0.52 0.08 | -6.88 |
| Br | 2.165 | 0.25 0.02 | -4.13 |
| H2 1-0S(0) | 2.222 | :0.20 | … |
| H2 2-1S(1) | 2.248 | :0.20 | … |


3.1.1 Absorption-Line Features: The Stellar Population
Several absorption features are readily seen in the band nuclear spectrum of Mrk 78 (see Fig. 3). In particular we observed the following ones: Mg I 1.50, CO 1.58, Si I 1.59, CO 1.62, CO 1.64 and Mg I 1.71 (all wavelengths are given in m). These features are named according to their main contributor, although, depending on the stellar spectral type, other species may become dominant. For example, for very cool stars, OH dominates the Si I feature (Origlia et al., 1993; Dallier et al., 1996). In the band, we have also detected Ca I 2.26, Mg I 2.28 and the 12CO(2,0) band head, at 2.29 µm. Unfortunately, the entire band is not included in our observations as part of it lies outside our spectral range due to the galaxy redshift.
The ratio of the equivalent width of the 1.62 m CO(6,3) feature to that of the 1.59 m Si I one is a good temperature indicator for late-type stars (Origlia et al., 1993; Förster Schreiber, 2000; Ivanov et al., 2004), since the CO(6,3) feature grows rapidly from early K to late M stars, while the SiI one is only weakly dependent on stellar temperature. Moreover, dilution and reddening effects are cancelled out, due to the closeness of the features in wavelength.
In order to identify the spectral types that produce the absorption features seen in the range of Mrk 78, we compare our spectra with digitally available stellar templates from Dallier et al. (1996), observed in the band with a medium resolution. The equivalent width of the intrinsic stellar features have been computed after convolution of the templates, in order to match the resolution of our galaxy spectra. As a result of this comparison, for Mrk 78, the equivalent-width ratio of the CO 1.62 feature to Si I 1.59 corresponds to spectral types in the range K5 III to M3 III (see Table 2). This is consistent with results obtained by Oliva et al. (1995) for a range of galaxy types and with those of Thatte et al. (1997) for NGC 1068. An age of several hundred Myr is estimated for the stellar system, based on the fact that intermediate to low mass giants dominate the integrated IR luminosity (Renzini & Buzzoni, 1986).
In Seyfert galactic nuclei, these late-type stellar features are substantially diluted by non-stellar nuclear emission. Assuming a single stellar population, the dilution fraction () can be computed from the ratio of measured to intrinsic EWs of any absorption feature (Oliva et al., 1995). Thus in the band, using the CO 1.62 feature, a starlight dilution in the range 30–37% is obtained for the nuclear spectrum. For the band CO(2,0) 2.29 we use, as intrinsic EWs for giant stars, those computed from the digitally available spectra from Wallace & Hinkle (1997), resulting in a dilution factor of 43-47% in this band (see Table 2). The stellar contribution in the band was estimated from the colors of K–M giants. The remaining non-stellar spectrum resembles a power law (). The index of this power law is relatively close to the average value () claimed for the NIR pure AGN emission (Neugebauer et al., 1979), which is steeper than in the optical range.
Another common way of determining the age of the stellar population in the NIR is by means of the strength of the CO absorption feature starting at 2.29 µm. There are several working definitions of the CO index. We have used that given by Ivanov et al. (2000), which is more appropriate to the CO band measured in Mrk 78, where the spectrum ends beyond 2.31 µm. Indeed, in Mrk 78, because of its redshift, the CO band feature is close to the edge of the atmospheric window; hence, measuring the continuum level on both sides of the feature is subject to large uncertainties. The Ivanov CO index is narrower than that of Doyon et al. (1994) and has the additional advantages of being insensitive to extinction, and to possible uncertainties in the continuum shape of the infrared spectra. We measure it as follows:
where and are the averaged flux within a bandwidth of 0.01 m, centred on the blue continuum and at the band head respectively. The resultant CO index is 0.149 0.002, which is among the lowest values obtained for Seyfert 2 galaxies by Ivanov et al. (2000), as expected because these authors use a larger spatial scale. Our value is also lower than the average one corresponding to the sample of pure starburst galaxies as reported by the same authors. Knowing the dilution factor from the non-stellar component in the band, which is approximately 45%, we can estimate the CO index after removing the non-stellar contribution, being its value 0.289 0.007. In order to estimate an age from this CO index we need to transform its value into an age-calibrated one. First we convert our narrow spectral index into the broader, most usual one, using an expression from Ivanov et al. (2000):
We then obtain a photometric index using a linear relationship from Doyon et al. (1994):
which gives a COphot of 0.216 0.023. Looking at Fig. 1 in Origlia & Oliva (2000), it is ambiguous as to which isochrone is most applicable to determine the age of the stellar population. It is well known that the CO band strength is sensitive to surface gravity and depends both on metallicity and effective temperature. For solar metallicity, the value of the index points to 30 Myr using Geneva tracks (Schaller et al., 1992), or to two different values, namely 25 and 80 Myr, if Padua tracks (Bertelli et al., 1994) are chosen. These ambiguities have led to the use of the CO index as an age indicator being questioned. Origlia & Oliva (2000) claim that an inadequate treatment of the AGB phase produces CO features that are too weak, so that the results are fairly dependent on the evolutionary tracks one adopts. Nevertheless, if late-type giants were the dominant population in the nucleus of Mrk 78, 100 Myr would be a lower limit to the age of the stellar population, and the 80 Myr point would then be the only one possible for this case. Summarizing, we conclude that stellar features in the and bands are dominated by intermediate to low mass giants, with an estimated aged of approximately 100 Myr.

| Line | EW(Å) | Range(m) | |||
|---|---|---|---|---|---|
| Mrk 78 | K5III | M1III | M3III | ||
| SiI1.589 | 2.3 | 2.8 | 2.9 | 2.9 | 1.585-1.592 |
| CO(6,3)1.619 | 5.1 | 7.8 | 7.3 | 8.1 | 1.614-1.627 |
| CO(2,0)2.290 | 8.1 | 14.1 | 15.2* | 15.3 | 2.291-2.303 |
3.2 Extended Narrow Line Region
Extended emission on both sides of the nucleus is observed, along the slit, in several spectral lines; namely, in [Fe II] 1.256,1.643, [S III] 0.907,0.953, He I 1.083, Pa, Pa and [Si VI] 1.962. The emission in weaker lines such as Br plus in several H2 molecular lines also appears extended although it becomes difficult to measure, as they are at about one level. The spectral features were measured by means of Gaussian fits using the in–house software utility twofitlines (Acosta-Pulido, 2000). The spectra were extracted after coadding three columns along the spatial direction, equivalent to 075. However, in a region around east of the nucleus several lines are split into two kinematic components (discussed in Section 3.3). In those cases the line fluxes are obtained by simple integration over the line profile.
Several line flux profiles are shown in Fig. 6, where the Pa profile has been chosen as a baseline against which to compare the other line profiles. We note that the flux distribution of Pa is asymmetric around the nucleus. It shows first a slow decline within east of the nucleus and then falls steeply beyond 2′′. Instead, on the opposite side of the nucleus the profile falls quickly 1′′ west of the nucleus, further showing a shoulder at The Pa emission profile can be compared with the high spatial resolution Mrk 78 [O III] and radio images from Whittle & Wilson (2004). The radio image shows two lobes on both sides of the central nucleus, which is actually the brightest radio source. However, in [O III] radiation there are two cones of emission east and west of the center (Whittle & Wilson, 2004), which is consistent with the existence of a nuclear obscuring structure. The large size of the [O III] obscured region suggests that obscuring material is required on a much larger scale in addition to the few parsec size torus (Pier & Krolik, 1992) obscuring the active nucleus (Capetti et al., 1994). A transverse [O III] profile reveals that the emission is brighter to the east, decreasing towards the west after 2′′, just where the Pa shows a shoulder.
The high-ionization line ratio [Si VI]/Pa shows its maximum at the position of the nucleus. It also shows an enhancement east of the nucleus, while it stays low () in the western lobe. This is a clear indication that the ionization is higher in the nucleus and also in the east lobe, compared to the west side.
In contrast, the [S III]/Pa line ratio shows a minimum at the nucleus and then increases to a nearly constant value in the lobes. Both these facts are indicative of a decrease in the ionization level outside the nucleus, as discussed below in Section 4.3.
The [Fe II]/Pa line ratio has an interesting behavior, showing a minimum at the position of the nucleus, while a high value, exceeding by a factor the value in the eastern lobe, appears in the western one.
The Pa/Pa ratio is an indicative of extinction: there are some indications that the gas in the east and west lobes does not suffer so much extinction as in the nucleus, as concluded by Whittle & Wilson (2004).

The He I1.083/Pa ratio shows a shallow peak coincident with the nucleus of the galaxy, indicating higher ionization than in the outer nebular regions.
Finally, the line ratios including H2 indicate that the molecular emission is compact and concentrated towards the nucleus, although we cannot exclude the possibility that the molecular emission may extend in a direction perpendicular to the ionization cone as mentioned by Reunanen et al. (2003).
In summary, the scenario that we may envisage through these ratios consists of a prominent highly ionized nucleus, which is obscured by dust; an eastern lobe where the ionization parameter is also very high according to the [Si VI] emission (a line with a very high ionization potential); and a western lobe where the [Fe II] emission is mostly due to the higher radio-jet interaction in the west. Both lobes are less affected by extinction than the nucleus, as can be seen from the behavior of the Pa/Pa ratio in Figure 6. This coincides with the existence of a dust band crossing the galaxy center, as can be seen in Figure 1.
3.2.1 Eastern and Western Emission
By looking at the variation of the line widths along the slit, we noted that there are two regions where the FWHM increases noticeably (see the discussion in Section 3.3). These positions coincide with the shoulders seen in the Pa flux profile. For this reason we decided to study these zones separately. We extracted two spectra in the and ranges, one centred on to the east, and the other 2′′ to the west, covering 1.5 arcsec (see Figs 7, 8, and 9).
In the east lobe, the most prominent lines (He I1.083, [Fe II]1.257, Pa and Pa) appeared double-peaked, as can be seen in the insets of Figures 7 and 9. The two kinematic components correspond to a blue one, which is present overall along the slit, plus a weak red component, which is only detected close to this lobe. In the west zone, the FWHM appears slightly larger than the mean value, although it is not large enough to detect more than one kinematic component.
We report integrated fluxes for the red and blue components of the eastern and western regions in Table 3. The fluxes were measured by Gaussian fitting as described in Section 3.2. In the case of the east region we employed two components, the velocity difference between them being km s-1, whereas in the west region a single component was used.
The relative intensity of [Fe II] emission appears much brighter in the west; the values at the nucleus and at the east are similar. [Si VI] shows the largest value at the nucleus, and the lowest in the west lobe; intermediate and similar values are measured in the two components at the east lobe. Differences between the blue and red spectra on the east side are clearly seen in the [S III] and Pa fluxes relative to Pa (see Table 3), showing a lower value for the blue component.
The depth of the stellar features appears very different in the east and west lobes (see Figs 8 and 9), being much larger in the east one. Quantitatively, in the east the dilution factor is around 20%, and in the west this factor is larger than 60%, measured from the CO(2,0) band head. Similar values are determined from the stellar absorption features in the band. As expected for regions outside the nucleus, in the east lobe the stellar contribution dominates the continuum emission. In contrast, in the western lobe there could be an intense non-stellar continuum diluting the stellar counterpart, which could be related to the blue extended continuum claimed by Whittle & Wilson (2004), although its origin is still unclear. Otherwise, there could be an enhancement of old stellar population, that would contribute less to absorption features.


| Line Nucleus | (m) | Nuclear emission | SW emission | Blue NE emission | Red NE emission |
|---|---|---|---|---|---|
| 0.907 | 0.82 0.08 | 1.02 0.07 | 0.68 0.23 | 1.16 0.25 | |
| 0.953 | 1.59 0.11 | 2.22 0.13 | 1.45 0.11 | 2.56 0.16 | |
| HeII | 1.012 | 0.14 0.02 | 0.12 0.02 | 0.13 0.02 | 0.13 0.02 |
| HeI | 1.083 | 1.25 0.08 | 0.89 0.06 | 1.16 0.07 | 0.96 0.07 |
| 1.256 | 0.22 0.04 | 0.61 0.05 | 0.29 0.04 | 0.22 0.05 | |
| Pa | 1.282 | 0.40 0.07 | 0.45 0.05 | 0.32 0.04 | 0.51 0.06 |
| 1.643 | 0.20 0.06 | 0.63 0.06 | 0.29 0.04 | 0.15 0.04 | |
| Pa | 1.875 | 1.00 | 1.00 | 1.00 | 1.00 |
| 1.962 | 0.45 0.06 | 0.09 0.04 | 0.24 0.02 | 0.26 0.03 |
3.3 Kinematics of the Ionized Gas
A visual inspection of the two-dimensional spectrum reveals that the most intense emission lines describe what is most readily explained as a rotation curve, redshifted towards the east of the galaxy and blueshifted towards the west. Moreover, all lines appear to be resolved with an average line width of 500 km s-1.
In order to analyze the velocity field we have fitted Gaussians to the line profiles, as described in the previous section. We note that around in the east and near 2′′ in the west the measured line widths increase noticeably. The velocity field appears to be clearly perturbed in those regions. Furthermore, the presence of double-peaked profiles becomes evident in some of the lines around to the east, e.g., He I, [Fe II], Pa and Pa (see Figs 7 and 9). We have plotted in Fig. 10 the velocity and FWHM variation along the slit. This has been done for an emission line where we clearly distinguish two components, namely Pa, and for another line, the [S III], for which a single, though broader, component can be fitted. In both cases, the overall behavior resembles that of a galaxy rotation curve with a half amplitude of km s-1.
The Pa line profile, in the eastern lobe, can be split into two kinematic components, a blueshifted one, roughly corresponding to the nominal rotation field, and a redshifted one, with a larger mean velocity of 600 km s-1, which may correspond to gas accelerated by interaction with the radio jet, as proposed by Whittle & Wilson (2004).
As stated above, the FWHM also increases at 2′′ towards the west (see Fig. 10), suggesting that the gas dynamics in this region are also affected by the interaction with the radio jet. However, the spectral resolution of our spectra does not allow us to distinguish the different kinematic components.

4 Discussion
4.1 Extinction towards the Nucleus
According to the unification scheme for Seyfert galaxies, the nucleus of Mrk 78 should be hidden from our view. This is apparently the case, as for instance Capetti et al. (1994) claim strong obscuration towards the nucleus of Mrk 78, based on different arguments. They found that the observed UV flux is at least three orders of magnitude smaller than the flux required to ionize the NLR. Based on this fact, applying the reddening curve from Cardelli et al. (1989) and the standard dust–to–gas ratio, they estimated a lower limit for the column density of cm-2. They also concluded that the nuclear emission must be intrinsically anisotropic in order to explain the observed low infrared luminosity as compared to the nuclear luminosity required to account for the overall NLR luminosity. Besides, Whittle & Wilson (2004) showed color images in which the nuclear extinction is clearly seen across several hundred parsecs. Indeed, we have not detected any broad wings in the H recombination lines present in our spectra. Previously, Goodrich et al. (1994) reported the non-detection of a broad component for Pa in this galaxy, although their spectra have much lower signal to noise ratio than ours.
Moreover, the extinction towards the nucleus can be estimated from our spectra using several reddening indicators, such as the [Fe II] and [Fe II] lines, or other line ratios between the observed Paschen and Brackett H recombination lines. From these line ratios we have determined the optical extinction, , using Draine’s parameterization (Draine, 1989) . The results are presented in Table 4. The [Fe II]1.257/1.644 µm line ratio is a reliable indicator given that it is not dependent on the density or temperature of the line-emitting gas. We measured a value of 1.13 (see Table 4), which yields a moderate value for the extinction when compared to the theoretical value of 1.34 (Bautista & Pradhan, 1998). The [Fe II]1.257/1.644 line ratio measured for Mrk 78 is very close to the mean value 0.98 found in a sample of Seyfert galaxies by Rodríguez-Ardila et al. (2004). These authors argued that either the gas emission [Fe II] lines are affected by the same large extinction for most Seyfert galaxies, or the theoretical value is overestimated, given the uncertainties in the determination of the transition coefficients.
Other available reddening indicators are the Pa/Pa and the Pa/Br line ratios. However, these ratios depend on the density and temperature of the line-emitting gas. In particular, the Pa/Pa ratio varies by % when the temperature changes from 5000 to 20000 K (Hummer & Storey, 1987). We have adopted theoretical values corresponding to = 10 000 K and cm-3. In our case, the observed Pa/Br line ratio is larger than the theoretical value. This could be due to an underestimation of the Br line flux, because of either the weakness of the line or an underlying absorption feature.
The values derived for the visual extinction agree very well with those estimated by other authors using narrow emission lines (Veilleux et al., 1997; Rodríguez-Ardila et al., 2004). It is worth mentioning that the extinction measured using these narrow lines provides only an indication of the material located between us and the NLR. However, the nucleus itself and the BLR may be hidden by a larger amount of material. In fact, the non-detection of broad wings in recombination lines implies a lower limit of (Veilleux et al., 1997), if we assume the existence of a hidden BLR.
| Ratio | Theoretical | Measured | AV |
|---|---|---|---|
| [FeII]1.26/1.64 | 1.34 | 1.130.34 | 1.97 |
| Pa/Pa | 0.49 | 0.400.07 | 1.85 |
| Pa/Br | 12.2 | 17.31.6 | … |
4.2 The Emission-Line Spectrum
The simultaneous observation of very high and low ionization lines imply that a wide variety of physical conditions must coexist in the nuclear region of Mrk 78. This is a characteristic feature of gas photoionized by a power-law radiation source extending from the UV through X-rays. In particular the detection of strong coronal lines such as [Si VI] (IP = 166.7 eV) and [S VIII] (IP = 280.9 eV) are indicative of the presence of extreme UV and X-ray photons (Prieto & Viegas, 2000).
Marconi et al. (1994) concluded that the [Si VI] 1.962 emission line is associated uniquely with Seyfert 1 and 2 nuclei, and can only be produced by photoionization by a hard nuclear continuum. Furthermore, they indicate that this line must be produced in a dense gas with large column densities. Hot stars, present in HII regions are not capable of exciting the [Si VI] line, neither increasing the ionization parameter nor the ionizing star temperature. This coronal line is therefore an excellent tracer of Seyfert activity in galaxies with visually obscured nuclei. Indeed, Oliva & Moorwood (1990) found strong [Si VI] in NGC 1068 despite the strong obscuration present in this Seyfert galaxy. Coronal lines are forbidden transitions of highly ionized species, which are formed in extreme energetic environments. Reunanen et al. (2003) observed that coronal line emission appears to be extended along the ionization cone axis, implying an anisotropic nuclear radiation field. Furthermore, coronal lines are seen with similar strength and frequency in both Seyfert types (Prieto & Viegas, 2000), thus their study provides a clean test of the Unification Model.
4.2.1 The Origin of the Intense [Fe II] Emission
It is well known that [Fe II] emission is weak in HII regions but strong in the shock-excited filaments of supernova remnants. In AGN, strong [Fe II] emission is also common, although there is still some controversy about what is the dominant process responsible for this emission. Several processes may contribute to the production of the [Fe II] lines: 1) photoionization by soft X-ray–extreme UV radiation from the central source, producing large partially ionized regions in NLR clouds of high optical depth; 2) the interaction of radio jets with the surrounding medium, which induces shocks and produces partially ionized cooling tails; and 3) fast shocks associated with supernova remnants present in starburst regions. The [Fe II]1.257/Pa line ratio, or equivalently [Fe II]1.644/Pa, has proved to be very useful for distinguishing between a stellar and non-stellar origin for the [Fe II] emission. These line ratios increase from HII regions (photoionization) to supernovae remnants (shock excitation), passing through starburst and active galaxies (Alonso-Herrero et al., 1997; Rodríguez-Ardila et al., 2004). Galaxies with [Fe II]1.644/Pa222We transform the [Fe II]1.257/Pa line ratio to [Fe II]1.644/Pa using the theoretical relations for both [Fe II] and H Paschen lines. The following equation was used [Fe II]1.644/Pa = 0.37 [Fe II]1.257/Pa. lower than 0.11 are clasified as starbursts generally, LINERS if this value is larger than 0.75, and Seyfert galaxies are contained in the range 0.15–0.75 (Larkin et al., 1998; Rodríguez-Ardila et al., 2004). In the case of Mrk 78, the [Fe II]1.644/Pa line ratio is seen to increase outside the nucleus and shows larger values in the west lobe (see Section 4.3). We found [Fe II]1.644/Pa for the nuclear emission and similar values in the east lobe that are well within the range of Seyfert galaxies. Those values can be explained as due to photoionization by hard UV nuclear radiation (see Fig. 12). Starburst activity is not sufficient to explain these values. In the west lobe a higher value, [Fe II]1.644/Pa, was measured that is closer to the LINER locus, probably related to shock excitation, associated with a more efficient interaction with the radio jet. In order to explain the [Fe II]1.644/Pa line ratio in the west lobe a composite model including shock excitation plus photoionization by the nuclear radiation is required.
On the other hand, we have detected [P II] 1.188 µm, which is an important emission line for discriminating between the different excitation mechanisms acting in the NLR. In particular, this line is very useful when compared with the [Fe II] 1.257 line (Oliva et al., 2001). Both lines are produced in partially ionized regions having similar critical densities and excitation temperature. In contrast, iron is a well known refractory species and is strongly depleted in dust grains, whereas phosphorus is a non-refractory species. Photoionization alone is unable to destroy the tough iron-based grains, while these are easily sputtered by shocks. The [Fe II]/[P II] ratio is high ( 20) in fast shock-excited regions and low ( 2) in normal photoionized regions (Oliva et al., 2001). For Mrk 78 this line ratio is 1.82 in the nuclear region, indicating that photoionization by a soft X-ray continuum is the most likely mechanism responsible for the observed nuclear spectrum.
The Extended [Fe II] Emission and Its Relationship to Radio Emission
As pointed out by Rodríguez-Ardila et al. (2004), the [Fe II]1.644/Pa line ratio is a good discriminator to discern between a stellar or non-stellar origin for the [Fe II] emission, although it is not helpful in distinguishing between processes in the latter case. In addition, shocks may efficiently destroy dust grains and release iron into the gas phase, leading to an enhancement of the [Fe II] emission. An excellent way to differentiate between the different processes is the comparison of the [Fe II] emission and radio emission morphologies, despite the difficulty in obtaining [Fe II] images. Blietz et al. (1994) showed that the morphology of the [Fe II] emission correlates with that of the radio jet in NGC 1068. The most intense [Fe II] emission appears slightly offset upstream of the radio bow shock (see Fig. 2 in Blietz et al. (1994)). Mrk 78 may be a similar case in which the morphology of the [O III]-emitting gas seems to reflect different processeses in the west and east lobes. The east lobe can be explained as a relatively homogeneous gas structure illuminated by the nuclear radiation source, which is penetrated by the radio emission. In contrast, the west lobe resembles a knotty gas distribution where the interaction with the radio jet has dispersed cloud fragments and swept out gas, producing compression of the gas (Whittle & Wilson, 2004).
4.2.2 The Origin of the H2 Emission
Several molecular hydrogen emission lines are present in the band spectrum of Mrk 78. These lines are clearly detected in the nucleus and in the east lobe (see Figs 4 and 9), although the emission is mostly concentrated in the nuclear region. Reunanen et al. (2003) reported that H2 emission is spatially resolved preferentially in directions perpendicular to the ionization cone, which is in contrast with the results reported by Quillen et al. (1999), where H2 emission coincides with [O III] and H emission.
There are three possible H2 excitation mechanisms in galaxies: i) UV pumping (fluorescence), ii) thermal excitation due to the presence of shocks, and iii) hard X-ray photons, which can penetrate deep into molecular clouds. These three mechanisms produce different spectral features, and the relative emission line intensities can be used to identify the dominant mechanism. In particular the H2 2–1 S(1)/1–0 S(1) line ratio is lower for thermal excitation (0.1–0.2) than for UV fluorescence (0.55), as proposed by Mouri (1994). The value obtained for the nuclear region of Mrk 78 is which is larger than the predictions for pure thermal excitation, but smaller than those for non-thermal UV excitation. However, in the case of dense gas ( cm-3), collisional de-excitation of the H2 molecule modifies the spectrum, approaching the thermal spectrum. Excitation by hard X-ray are ruled out by other authors based on considerations of energetics (Rodríguez-Ardila et al., 2004) and on the detection of the transition H2 2–1 S(3) in several Seyfert galaxies (Davies et al., 2005), which would otherwise be suppressed in the case of X-ray irradiated gas (Davies et al., 2005).
Another way to discriminate between the thermal and fluorescent excitations is through the rotational and vibrational temperatures. In the case of thermal excitation both temperatures should be similar, whereas in the case of fluorescent excitation a high vibrational temperature will be in contrast with a lower rotational temperature. We have determined both temperatures using the expressions given by Reunanen et al. (2002) using the H2 line ratios 2–1 S(1)/1–0 S(1) and 1–0S(0)/1–0S(2). The values obtained for this galaxy are 4405 K and 1557 K, which are in good agreement with those derived by Rodríguez-Ardila et al. (2004) for a number of Seyfert 2 galaxies, such as Mrk 279 and NGC 5728. Hence, the most likely mechanism for the excitation of H2 in Mrk 78 is UV fluorescent in a dense gas. Note, however, that, given the large uncertainties in the line flux measurements, thermal excitation cannot be ruled out.
4.3 Comparison with Photoionization Models
We have used the photoinization code CLOUDY (version C05.07.06), in order to reproduce the line ratios obtained from our spectra (for a detailed description see Ferland (2003)). We computed a grid of models based on photoionization by a power-law continuum and physical conditions in the gas typical of NLR. For the ionizing continuum we used a power-law shape of the form , where is the spectral index in the range above 10 µm. At energies below 10 µm the spectral index is . We assume a plane–parallel geometry, metallicity equal 0.3 solar, and grains with properties similar to those of the Orion Nebula, which corresponds to the best-fitting models according to Alonso-Herrero et al. (1997). Three different values of hydrogen density were explored: = 104, 105, and 106 cm An input to the code is the ionization parameter , defined by .
Line ratio diagrams are shown in Figs 11 and 12 for the following combination of lines: He II1.012/Pa versus [S III]0.953/Pa and [Si VI]1.963/Pa versus [Fe II]1.644/Pa. Dashed lines represent the computed line ratios for the three hydrogen densities employed, beginning with an ionization parameter of and decreasing it with a step of 0.5, towards the bottom of these plots.
Values of these line ratios from Table 3, corresponding to the nucleus, the west and the east lobes (red and blue components for the latter), are overplotted for comparison with our simulations made with CLOUDY. It can be seen that data from our spectra are compatible with photoionization models for all regions considered within values of log in the range to , except for the [Fe II]/Pa line ratio. By looking at the diagram in Fig. 11, the best fit for the nucleus and the east lobe–blue component is obtained when However, for the west lobe and east lobe–red component, the best fit is obtained when In all cases the H density is close to which approaches the critical density for the [S III] line. From Fig. 12, it is easy to see that the [Si VI]/Pa line ratio is very sensitive to the value of the ionization parameter, becoming saturated at values . At higher values of the ionization parameter, the [Si VII] transition will become more important. The nuclear emission can thus be explained with values whereas in the east lobe this value decreases to and in the west lobe to The differences between the best-fitting values of from the different line ratios may be reconciled by lowering the spectral index of the power law, i.e., hardening the ionizing continuum, or using combination of clouds with different optical depths. In order to explain the [Fe II]/Pa ratio, models may have to include effects due to interaction with the radio emission, such as increasing the iron abundance after grain sputtering.
We therefore conclude that the measured line ratios from the spectra of Mrk 78 are compatible with photoinization by an AGN-like continuum.


5 Conclusions
We have presented and analyzed the NIR line spectrum of the nucleus and extended NLR of the Seyfert 2 galaxy Mrk 78. The following results were found:
-
•
The nuclear spectrum and the extended NLR spectrum are produced by photoionization by a hard UV–X-ray continuum, as indicated by the presence of the [Si VI] and [P II] lines. This fact is in good agreement with the presence of a hidden active nucleus in Mrk 78.
-
•
The nuclear emission in the band has numerous stellar absorption features. According to the relative equivalent widths, the stellar population is dominated by K–M giants in this wavelength range. The nuclear stellar emission is diluted by a non-stellar component by a factor % in the band and % in the band.
-
•
An enhancement of the [Fe II] emission is observed outside the nucleus, in particular at to the west. This effect is interpreted in terms of the interaction with the radio emission.
-
•
Several transitions of the H2 molecule are detected in the band. The dominant excitation mechanism could not be determined unambiguously, although we favor UV fluorescence in a dense gas.
References
- Acosta-Pulido (2000) Acosta Pulido, J. A. 2000, ASPC, 216, 663
- Acosta-Pulido et al. (2003) Acosta Pulido, J. A., et al. 2003, INGN, 7, 15
- Alonso-Herrero et al. (1997) Alonso-Herrero, A., Rieke, M. J., Rieke, G. H., & Ruiz, M. 1997, ApJ, 482, 747
- Bautista & Pradhan (1998) Bautista, M. A., & Pradhan, A. K. 1998, ApJ, 492, 650
- Bertelli et al. (1994) Bertelli, G., Bressan, A., Chiosi, C., Fagotto, F., & Nasi, E. 1994, A&A, 106,275
- Blietz et al. (1994) Blietz, M., et al. 1994, ApJ, 421, 92
- Capetti et al. (1994) Capetti, A., Macchetto, F., Sparks, W. B., & Boksenberg, A. 1994, ApJ, 421, 87
- Cardelli et al. (1989) Cardelli, J. A., Clayton, G. C., & Mathis, J. S. 1989, ApJ, 345, 245
- Cecil et al. (2002) Cecil, G., Dopita, M. A., Groves, B., Wilson, A. S., Ferruit, P., Pécontal, E., & Binette, L. 2002, ApJ, 568, 627
- Cecil et al. (2000) Cecil, G., et al. 2000, ApJ, 536, 675
- Clements (1981) Clements, E. 1981, MNRAS, 197,829
- Cutri et al. (2003) Cutri, R. M., et al. 2003, VizieR On-line Data Catalog: II/246. Originally published in: University of Massachusetts and Infrared Processing and Analysis Center (IPAC/California Institute of Technology)
- Dallier et al. (1996) Dallier, R., Boisson, C., & Joly, M. 1996, A&A, 116, 239
- Davies et al. (2005) Davies, R. I., Sternberg, A., Lehnert, M. D., & Tacconi-Garman, L. E. 2005, ApJ, 633, 105
- Doyon et al. (1994) Doyon, R., Joseph, R. D., & Wright, G. S. 1994, ApJ, 421, 101
- Draine (1989) Draine, B. T. 1989, isa, book, 93D
- Draine & Woods (1990) Draine, B. T., & Woods, D. T. 1990, ApJ, 363, 464
- Ferland (2003) Ferland, G. J. 2003, ARA&A, 41, 517
- Ferruit et al. (1999) Ferruit, P., Wilson, A. S., Falcke, H., Simpson, C., Pécontal, E., & Durret, F. 1999, MNRAS, 309, 1
- Ferruit (2002) Ferruit, P. 2002, Emission Line from Jet Flows, ed. W. J. Henney, W. Steffen, A. C. Raga, & L. Binette (Rev. Mexicana Astron. Astrofis. Ser. Conf. 13)(México, D.F.: Inst. Astron. Univ. Nac. Autónoma México), 183
- Förster Schreiber (2000) Förster Schreiber, N. M. 2000, AJ, 120, 2089
- Goodrich et al. (1994) Goodrich, R. W., Veilleux, S., & Hill, G. J. 1994, ApJ, 422, 521
- Hummer & Storey (1987) Hummer, D. G., & Storey, P. J. 1987, MNRAS, 224, 801
- Ivanov et al. (2004) Ivanov, V. D., Rieke, M. J., Engelbracht, C. W., Alonso-Herrero, A., Rieke, G. H., & Luhman, K. L. 2004, ApJS, 151, 387
- Ivanov et al. (2000) Ivanov, V. D., Rieke, G. H., Groppi, E., Alonso-Herrero, A., Rieke, M. J., & Engelbracht, C. W. 2000, ApJ, 545, 190
- Larkin et al. (1998) Larkin, J. E., Armus, L., Knop, R. A., Soifer, B. T., & Matthews, K. 1998, ApJS, 114, 59
- Levenson et al. (2001) Levenson, N. A., Weaver, K. A., & Heckman, T. M. 2001, ApJS, 133, 269
- Manchado et al. (2004) Manchado, A., et al. 2004, in Proc. of the SPIE, 5492, 1094M
- Marconi et al. (1994) Marconi, A., Moorwood, A.F.M., Salvati, M., & Oliva, E. 1994, A&A, 291, 18
- Michel & Huchra (1988) Michel, A., & Huchra, J. 1988, PASP, 100, 1423
- Mouri (1994) Mouri, H. 1994, ApJ, 427, 777
- Nelson & Whittle (1996) Nelson, C. H., & Whittle, M. 1996, ApJ, 465, 96
- Neugebauer et al. (1979) Neugebauer, G., Oke, J. B., Becklin, E. E., & Mathews, K. 1979, ApJ, 230, 79
- Oliva & Moorwood (1990) Oliva, E., & Moorwood, A. F. M. 1990, ApJ, 348, L5
- Oliva et al. (1995) Oliva, E., Origlia, L., Kotilainen, J. K., & Moorwood, A. F. M. 1995, A&A, 301, 55
- Oliva et al. (2001) Oliva, E., et al. 2001, A&A, 369, L5
- Origlia et al. (1993) Origlia, L., Moorwood A. F. M., & Oliva, E. 1993, A&A, 280, 536
- Origlia & Oliva (2000) Origlia, L., & Oliva, E. 2000, A&A, 357, 61
- Pedlar et al. (1989) Pedlar, A., et al. 1989, MNRAS, 238, 863
- Pier & Krolik (1992) Pier, E. A., & Krolik, J. H. 1992, ApJ, 401,99
- Prieto & Viegas (2000) Prieto, M. A., & Viegas, S. M. 2000, ApJ, 532, 238
- Quillen et al. (1999) Quillen, A. C., Alonso-Herrero, A., Rieke, M. J., Rieke, G. H., Ruiz, M., & Kulkarni, V. 1999, ApJ, 527, 696
- Renzini & Buzzoni (1986) Renzini, A., & Buzzoni, A. 1986, in ”Spectral Evolution of Galaxies”, Chiosi C., Renzini A. (eds), p 195.
- Reunanen et al. (2002) Reunanen, J., Kotilainen, J. K., & Prieto, M. A. 2002, MNRAS, 331, 154
- Reunanen et al. (2003) Reunanen, J.,Kotilainen, J. K., & Prieto, M. A. 2003, MNRAS, 343, 192
- Rhee & Larkin (2005) Rhee, J. H., & Larkin, J. E. 2005, ApJ, 620, 151
- Rodríguez-Ardila et al. (2004) Rodríguez-Ardila, A., Pastoriza, M. G., Viegas, S., Sigut, T. A. A., & Pradhan, A. K. 2004, A&A, 425, 457
- Rodríguez-Ardila et al. (2002) Rodríguez-Ardila, A., Viegas, S., Pastoriza, M. G., & Prato, L. 2002, ApJ, 519, 214
- Schaller et al. (1992) Schaller, G., Schaerer, D., Meynet, G., & Maeder, A. 1992, A&A, 96, 269
- Schlegel et al. (1998) Schlegel, D. J., Finkbeiner, D. P., & Davis, M. 1998, ApJ, 500, 525
- Thatte et al. (1997) Thatte, N., Quirrenbach, A., Genzel, R., Maiolino, R., & Tecza, M. 1997, ApJ, 490, 238
- Tran (1995) Tran, H. D. 1995, ApJ440, 565
- Vacca et al. (2003) Vacca, W. D., Cushing, M. C., & Rayner, J. T. 2003, PASP, 115, 389
- Veilleux et al. (1997) Veilleux, S., Goodrich R. W., Hill, G. J. 1997, ApJ, 477, 631
- Veilleux et al. (2002) Veilleux, S., Cecil, G., Bland–Hawthorn, J., & Shopbell, P.L. 2002, Emission Line from Jet Flows, ed. W. J. Henney, W. Steffen, A. C. Raga, & L. Binette (Rev. Mexicana Astron. Astrofis. Ser. Conf. 13)(México, D.F.: Inst. Astron. Univ. Nac. Autónoma México), 222
- Wallace & Hinkle (1997) Wallace, L., & Hinkle, K. 1997, ApJS, 111, 445
- Whittle (1992) Whittle, M. 1992, ApJ, 387, 109
- Whittle et al. (1988) Whittle, M., Pedlar, A., Meurs, E. J. A., Unger, S. W., Axon, D. J., & Ward, M. J. 1988, ApJ, 326, 125
- Whittle & Wilson (2004) Whittle, M., & Wilson, A. S. 2004, AJ, 127, 606