Multi-object spectroscopy of the field surrounding PKS 2126158: Discovery of a galaxy group
Abstract
The high-redshift radio-loud quasar PKS 2126158 is found to have a large number of red galaxies in close apparent proximity. We use the Gemini Multi-Object Spectrograph (GMOS) on Gemini South to obtain optical spectra for a large fraction of these sources. We show that there is a group of galaxies at , coincident with a metal-line absorption system seen in the quasar’s optical spectrum. The multiplexing capabilities of GMOS also allow us to measure redshifts of many foreground galaxies in the field surrounding the quasar.
The galaxy group has five confirmed members, and a further four fainter galaxies are possibly associated. All confirmed members exhibit early-type galaxy spectra, a rare situation for a Mg ii absorbing system. We discuss the relationship of this group to the absorbing gas, and the possibility of gravitational lensing of the quasar due to the intervening galaxies.
keywords:
quasars: individual: PKS 2126158 – quasars: absorption lines – galaxies: general – gravitational lensing1 Introduction
Quasars located at high redshifts provide excellent probes of the intervening universe. As their light travels through the universe, it is partially absorbed by neutral hydrogen or metals such as magnesium – an effect detectable in the quasars’ optical and UV spectra. These absorption lines provide an effective way of probing the evolution of metal-bearing gas over a large range of redshifts, as the sensitivity to absorption is largely independent of redshift, depending only on the background source’s surface brightness.
The Mg ii absorption systems in particular are most likely associated with foreground galaxies (Bergeron & Boisse, 1991; Steidel et al., 1994; Steidel et al., 2002), based on the velocity structure within the systems, the clustering properties of the absorbers, and the presence of metals that have most likely been produced locally. When identified, most of these galaxies appear to be spirals (e.g. Steidel et al., 2002), although absorbers have been found that span the range from late-type spirals to galaxies resembling present-day ellipticals (Steidel et al., 1994). The observational challenge then is to correctly identify the absorbing galaxies and build up a picture of the absorbing system. Such identifications allow one to track the evolution of metal-bearing gas and its relationship to galactic environment.
The identification of the object responsible for an absorption system involves finding a galaxy close to the line-of-sight to the quasar that has a redshift matching that of the absorption system. As such galaxies are often faint, to examine many in the vicinity of a given quasar requires relatively large amounts of telescope time, or a large degree of multiplexing. The advent of multi-object spectrographs on large telescopes has enabled more systems and galaxies to be examined, greatly assisting the identification of absorbing systems.
The identification of nearby galaxies close on the sky to a high-redshift quasar also allows us to address the question of gravitational lensing. The high redshifts of these quasars on face value imply very large luminosities, placing them at the high end of the luminosity function, where the slope of the function is steepest. If a small amount of magnification due to gravitational lensing is taking place, the intrinsic luminosity of the quasar will be reduced, changing the shape of the luminosity function. This is particularly important for the highest redshift quasars (such as those at , e.g. Richards et al. (2004)), but also for those around .
In this paper we address these issues by targeting PKS 2126158, a luminous high-redshift quasar that exhibits a number of metal-line absorption systems and has a large number of galaxies close to its line of sight, using the multiplexing capabilities of GMOS on the Gemini South telescope. We use imaging and low-resolution spectroscopy to obtain redshifts for many of the galaxies in the field, focussing on the environment.
We describe this quasar and our observations of it and the surrounding field in Section 2, while the results of the Gemini/GMOS observations are presented in Section 3. The implications of these results for the absorption line systems seen in the quasar’s spectrum are discussed in Section 4, and the possibility of magnification of this quasar due to gravitational lensing is discussed in Section 5. A summary of the results is found in Section 6. Note that throughout this paper we assume a standard CDM cosmology, with , and (Spergel et al., 2003).
2 Target Field and Observations
2.1 The quasar PKS 2126158
The quasar PKS 2126158 is a radio-loud, flat-spectrum quasar at a redshift of . It was first identified by Condon, Hicks & Jauncey (1977) in optical follow-up of flat-spectrum sources from the Parkes 2700 MHz surveys, and at the time its redshift was measured it was only the fifth radio quasar with (Jauncey et al., 1978).
PKS 2126158 is known to be a very bright object at radio (, Wright & Otrupcek (1990)), optical/near-infrared (, Francis, Whiting & Webster (2000)) and X-ray (, (Siebert et al., 1998)) frequencies. These fluxes, combined with its relatively high redshift, mean it is among the most luminous quasars known.
The optical/near-infrared spectrum of PKS 2126158 has a blue power-law shape for wavelengths longer than band (Francis et al., 2000), where the Ly line falls. The flux drops off at shorter wavelengths due to absorption by the intervening gas of the Lyman alpha forest. Absorption systems with strong metal lines are observed at the redshifts indicated in Table 1. The relatively strong Mg ii system at is particularly relevant for this paper, and is discussed in more detail in Section 4.1.
The peculiar concentration of objects in the vicinity of PKS 2126158 was first noticed from -band images taken on 6 June 1993 by Drinkwater et al. (1997) with IRIS (Allen et al., 1993) on the Anglo-Australian Telescope in the course of identification of sources in the Parkes Half-Jansky Flat-spectrum Sample (PHFS). There are sources visible within 30 arcsec of the quasar, principally toward the east and south.
Veron et al. (1990) obtained spectra of the two bright sources to the west (designated therein as C1 and C2, at distances of and arcsec west of the quasar respectively). They were able to measure the redshift of C2 (an emission line galaxy) as , while the spectrum of C1 was inconclusive. This is the only redshift information available from the literature for objects in the vicinity of PKS 2126158.
| Velocity range | Metal lines | |
|---|---|---|
| 0.6631 | Mg ii, Mg i, Ca ii | |
| 2.3313 | C iv, Si ii | |
| 2.3941 | C iv, Si iv, Si ii, Al ii | |
| 2.4597 | C iv, Fe ii | |
| 2.5537 | C iv | |
| 2.6378 | C iv, C ii, Al ii, Al iii, Si ii, Si iii, | |
| Si iv, Mg i, O i, Fe ii | ||
| 2.6788 | C iv, Si iv, C ii, Fe ii, N v | |
| 2.7281 | C iv, Si iv, Si ii, Fe ii | |
| 2.7689 | C iv, Al ii, Si ii, C ii, O i, Si iv, | |
| Al iii, Fe ii | ||
| 2.8195 | C iv, C ii, Si ii, O i | |
| 2.9071 | C iv, Al ii, Si iii, Si iv | |
| 2.9675 | Lyman limit system | |
| 3.2165 | C iv, Si iv, Si ii |
2.2 Gemini Observations
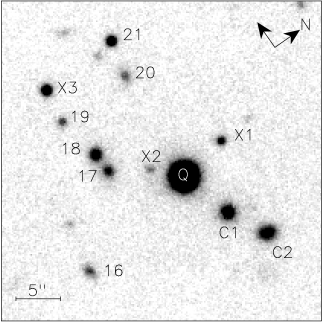
We used the Gemini Multi-Object Spectrograph (GMOS, Hook et al., 2002) on the Gemini South telescope, in Multi-Object Spectroscopy (MOS) mode, to obtain spectra for as many of the nearby objects as possible. Pre-imaging of the field was done with GMOS-South on 2003 July 15. The image, shown in Fig. 1, was constructed from six 300 sec exposures in the filter (Gemini filter i_G0327), and has image quality of 0.7 arcsec (the image was binned on-chip).
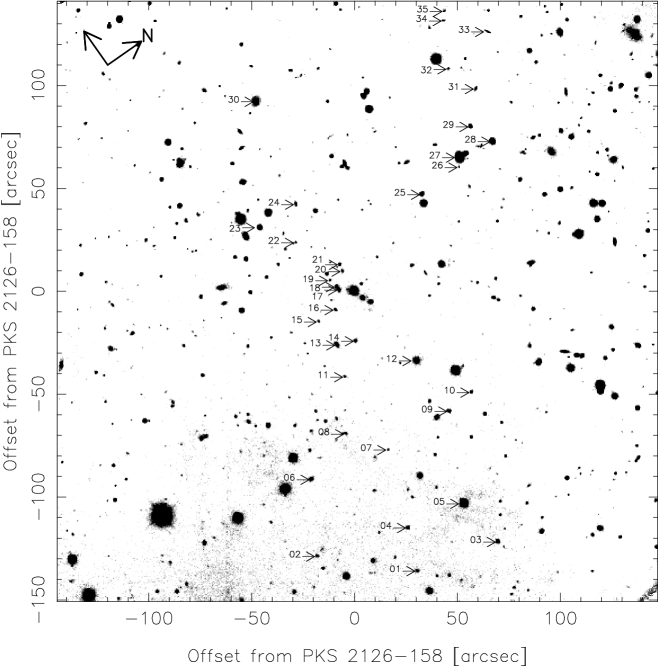
Since GMOS uses multiple slits in its multi-object mode, one cannot have slits overlapping in the dispersion direction (the horizontal direction in Fig. 1), particularly when the target objects are close together on the sky. For this project, this places a limit on the number of sources that can be observed in a single pointing (we had time for just a single mask setting). Fortunately, a judicious choice of position angle (in this case, 215° East of North) can enable a large fraction of the sources of interest to be placed on a slit. The large field of view of GMOS ( arcmin) also enabled a number of potentially interesting sources further from the quasar to be placed under a slit. These were selected either on morphology, or on their location in the field (i.e. whether a slit could be placed over them based on previously allocated slits). The locations of the targeted objects are shown in Fig. 1, while Fig. 2 shows each object in more detail, as well as the location of each slit.
Note that the limiting magnitude of the image is approximately . At this magnitude, an galaxy111We assume (Bell et al., 2003), and calculate K-corrections with template SEDs from Poggianti (1997) is visible out to a redshift of 5. However, at the magnitude of the faintest spectroscopic target (), an galaxy can be seen only out to (although a galaxy survives the K-correction and can be seen out to ).
The field was observed in queue mode on two nights – 2003 September
24 and 25 – with the chosen slit configuration, using the R150 grating
and the GG455 long-pass filter, for a total exposure time of 2
hours. This was divided into sets of
exposures at each of two grating settings, one on each of the
nights. The data was binned on-chip by a factor of 2 in both spatial
and dispersion directions.
The image quality, as measured from alignment images (with the mask in place) taken prior to the spectral observations, was noticeably worse on the second night (0.5 arcsec on night one, 0.95 arcsec on night two). This limited the signal-to-noise achieved in the spectra, and consequently several sources were unable to have redshifts measured (the spectra where redshifts were measured typically had S/N , while these few were significantly less than that).
The data were reduced using standard procedures from the Gemini IRAF package. The spectra were bias-subtracted and flat-fielded using calibration frames from the Gemini GCAL unit. Wavelength calibration using CuAr arc spectra, as well as sky-subtraction, were performed on an individual slit basis, and the spectra were flux-calibrated using observations of the standard star EG131.
3 Results
| Object | RA | Dec | Comments | |||||
|---|---|---|---|---|---|---|---|---|
| [mag] | [mag] | [arcsec] | [arcsec] | [arcsec] | [kpc] | |||
| 35 | 22.46 | -21.33 | 0.8335 | 42.1 | 136.7 | 143.0 | 1090.7 | Emission line at 6830Å, ID as [O ii] |
| 20 | 21.82 | -21.58 | 0.6704 | 10.2 | 4.6 | 11.2 | 78.5 | PEG |
| 24 | 21.48 | -21.92 | 0.6694 | 47.4 | 18.3 | 50.8 | 356.3 | PEG + strong [O ii] |
| 17 | 20.79 | -22.60 | 0.6668 | 6.3 | -3.7 | 7.3 | 51.2 | PEG |
| 03 | 20.91 | -22.48 | 0.6666 | -127.2 | -59.7 | 140.5 | 983.3 | PEG + weak [O ii] |
| 14 | 20.88 | -22.51 | 0.6648 | -14.5 | -19.4 | 24.2 | 169.3 | PEG |
| 19 | 22.08 | -21.30 | 0.6647 | 12.6 | -2.4 | 12.8 | 89.7 | PEG |
| 18 | 20.34 | -23.04 | 0.6643 | 8.2 | -3.2 | 8.8 | 61.2 | PEG |
| 01 | 22.74 | -20.63 | 0.6601 | -103.2 | -93.8 | 139.4 | 971.9 | PEG + weak [O ii] |
| 32 | 22.11 | -20.75 | 0.5415 | 24.4 | 114.8 | 117.3 | 744.4 | [O ii], with weak H and [O iii] |
| 04 | 21.88 | -20.89 | 0.5245 | -87.4 | -79.2 | 118.0 | 736.0 | Strong, extended [O ii] emission |
| 08 | 21.71 | -21.00 | 0.5124 | -36.5 | -59.1 | 69.5 | 428.5 | PEG + [O ii] |
| 09 | 20.43 | -22.28 | 0.5122 | -71.3 | -21.3 | 74.4 | 458.7 | PEG |
| 33 | 21.88 | -20.63 | 0.4761 | 19.3 | 140.6 | 141.9 | 839.9 | [O ii] |
| 16 | 21.60 | -20.90 | 0.4746 | 2.2 | -12.7 | 12.8 | 75.9 | [O ii] |
| 13 | 20.38 | -22.08 | 0.4657 | -8.3 | -26.2 | 27.5 | 160.7 | Starburst (higher-order Balmer lines + [O ii]) |
| 06 | 20.02 | -22.33 | 0.4478 | -35.5 | -86.9 | 93.9 | 536.8 | ELG (H, [O iii], [O ii]) |
| 26 | 23.33 | -18.74 | 0.4045 | -7.4 | 78.7 | 79.0 | 425.3 | ELG (H, [O iii], [O ii]) |
| 07 | 22.75 | -18.51 | 0.2994 | -57.8 | -53.7 | 78.9 | 348.3 | ELG (H, [O iii], [O ii]) |
| 30 | 19.21 | -21.35 | 0.2311 | 92.1 | 48.1 | 103.9 | 379.8 | PEG + weak H & [O iii] |
| 27 | 18.14 | -22.19 | 0.2124 | -4.8 | 82.8 | 82.9 | 284.0 | Barred spiral |
| 12 | 19.15 | -21.15 | 0.2104 | -44.2 | -10.3 | 45.4 | 154.4 | PEG |
| 29 | 19.98 | -20.30 | 0.2086 | -0.4 | 98.0 | 98.0 | 331.1 | PEG + weak AGN? |
| 28 | 17.95 | -20.84 | 0.1160 | -13.3 | 98.2 | 99.1 | 205.8 | PEG |
| 25 | 18.87 | — | 0.0000 | -0.0 | 57.4 | 57.4 | — | Star |
| 23 | 17.98 | — | 0.0000 | 55.3 | -0.9 | 55.3 | — | Star |
| 22 | 22.17 | — | 0.0000 | 36.8 | 3.1 | 36.9 | — | Star |
| 21 | 20.49 | — | 0.0000 | 13.2 | 6.6 | 14.7 | — | Star |
| 05 | 16.44 | — | 0.0000 | -103.1 | -53.9 | 116.3 | — | Star |
| 10 | 20.66 | — | 0.0000 | -74.9 | -7.6 | 75.3 | — | Star |
| 34 | 22.14 | — | — | 39.8 | 132.7 | 138.5 | — | No redshift measured |
| 31 | 21.42 | — | — | 8.0 | 114.5 | 114.8 | — | No redshift measured |
| 15 | 22.29 | — | — | 5.6 | -22.1 | 22.8 | — | No redshift measured |
| 11 | 22.58 | — | — | -20.3 | -36.7 | 41.9 | — | No redshift measured |
| 02 | 21.61 | — | — | -59.2 | -116.0 | 130.2 | — | No redshift measured |
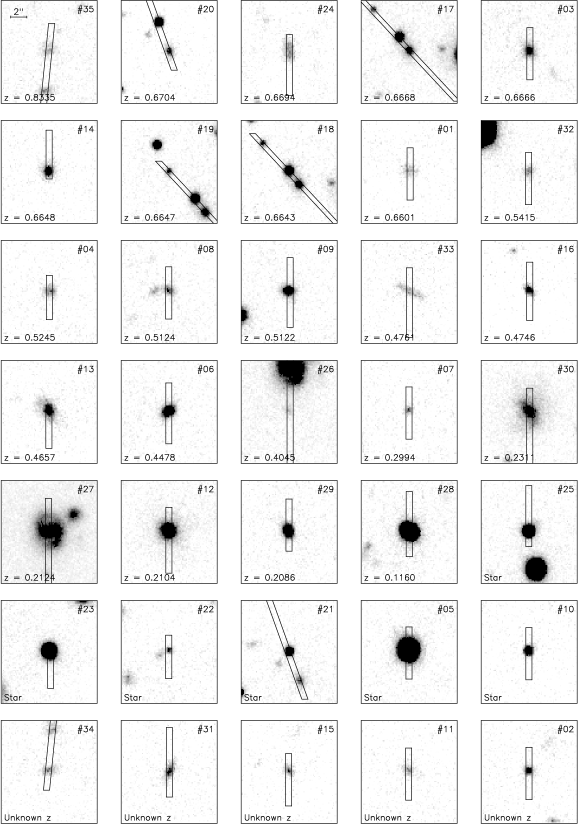
The measured redshifts for galaxies in the field of PKS 2126158 are shown in Table 2. The galaxies are numbered according to their position on the image, and sorted in the table in order of decreasing redshift. The magnitudes shown are measured from the pre-imaging data (i.e. the image shown in Fig 1), calibrated on the Landolt standard fields SA95 and TPhe, using the transformations from Fukugita et al. (1996). We have converted these magnitudes into absolute magnitudes, . The K-corrections were calculated using the template SEDs from Poggianti (1997) and the filter transmission function for filter i_G0302 provided on the Gemini web site.222Note that this transmission function is for the equivalent filter at Gemini North, believed to be similar to the one used at Gemini South. The transmission function for the Gemini South filter was not available at time of writing.
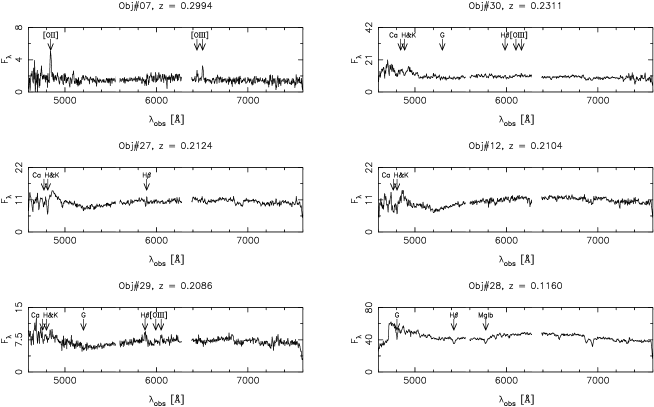
We find 8 galaxies with redshifts in the range , straddling the low redshift metal-line absorption systems seen by D’Odorico et al. (1998). The spectra of these galaxies are shown in Fig. 3.
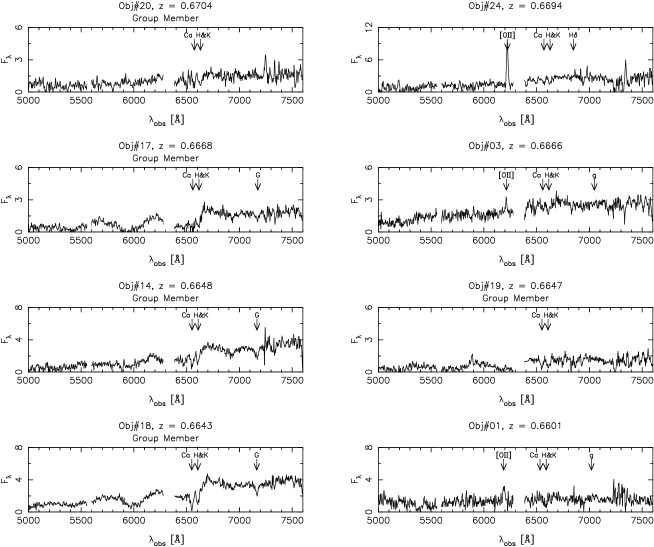

The velocity dispersion of these eight galaxies is , centred on a redshift of . Three of these galaxies, however, are at large spatial spearations from those close to the quasar. If we include just the four closest to the quasar – #17, #18, #19 and #20 – as well as #14, which is just close enough to be considered associated, we get and . This velocity dispersion is characteristic of a group environment, rather than a more dense cluster environment which would show . It is, in fact, a relatively poor group, with only five members brighter than . There are at least four fainter galaxies for which we have not obtained spectra that are also candidates for inclusion in the group (see Sec. 4 for further discussion). The remaining galaxies at (#24, #03 and #01) are part of the same large-scale structure that the group is embedded in, but not necessarily directly associated with the group itself.
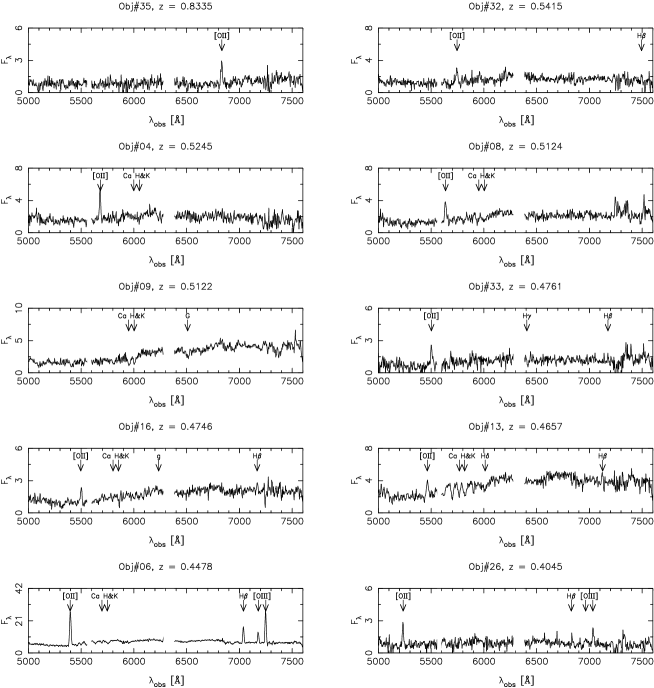
In addition to this structure, we find several other features in redshift-space. There are two other main structures seen in the field, at and (and possibly ), although these are not as tightly grouped on the sky as the main group at . There are a number of field galaxies at other redshifts as well. We are thus seeing several features in the large-scale structure along the line-of-sight to PKS 2126158. The spectra of the remaining galaxies with measured redshifts are shown in Figs. 4 & 5, and the distribution of galaxy redshifts can be seen in Fig 6.
Of the remainder, six objects were identified as stars, and a further five had spectra of too low quality for a redshift measurement. Of these latter objects, two (#11 and #15) have extended morphologies in the GMOS image, and colours redder than all the confirmed group members ( and respectively, cf. for the group members). They are thus either red galaxies in the group (more likely in the case of #15), or background galaxies (and redder due to their greater redshift).
4 Association with absorbing system
4.1 Is one of the identified galaxies the absorber?
As seen in Section 3, we find a concentration of galaxies in the redshift range . This coincides in redshift-space with a metal-line absorption system detected by Giallongo et al. (1993) and D’Odorico et al. (1998). The system consists of four components in velocity, with three species detected – Mg ii and Ca ii, plus Mg i in the two highest column density components. The redshifts of the components are , 0.6628, 0.6634 and 0.6637 (D’Odorico et al., 1998). This system is quite strong: the two strongest Mg ii components (at and ) have column densities of cm-2 and cm-2 respectively (Ryabinkov et al., 2003; D’Odorico et al., 1998). Using the Doppler parameters quoted by D’Odorico et al. (1998), we can convert these to equivalent widths of 0.44Å and 0.41Å respectively (for the Mg ii line in the rest frame).
A key question is whether this system can be associated with the group of galaxies detected in our GMOS observations. The nearest of the galaxies to PKS 2126158 is Galaxy #17, which lies at a distance of 51.2 kpc to the quasar’s line-of-sight (hereinafter QLOS). This places the QLOS in the outer parts of the galaxy’s halo. This separation is comparable to those seen in other absorption systems (see, for example, Steidel et al. (1997)). This galaxy, however, does show a large velocity offset from the absorbing system, with velocity differences with respect to the four components ranging from . Galaxy #18 provides a much closer match to the velocities (), and is only 61.2 kpc from the QLOS. It is also the brightest galaxy in the group, with .
A relationship has been noted by Lanzetta & Bowen (1990) between the equivalent width of the Mg ii absorption system and the impact parameter of the associated galaxy, where . By converting the column density and Doppler parameters of the absorption lines, we can obtain the equivalent widths for the system: the four Mg ii lines from D’Odorico et al. (1998) yield rest-frame values of and 0.13Å (in order of increasing redshift).
Comparing with the Lanzetta & Bowen (1990) relationship, we find that the two stronger systems have values corresponding to kpc, while the two weaker systems correspond to kpc. The galaxies we have observed to be in the group all lie at impact parameters between these two values. There is, however, an object closer than the closest observed galaxy to the QLOS (# 17), which, should it prove to be at the same redshift, may be a counterpart to one of the stronger systems (see Section 4.2 for more discussion on this source).
If we focus just on the confirmed group members, the Lanzetta & Bowen (1990) relationship taken at face value indicates that none of these galaxies are suitable counterparts for the absorption system(s). Recent studies, however, such as that presented in Churchill et al. (2005), indicate that there is much more scatter in the relationship than the Lanzetta & Bowen (1990) relationship would suggest. This calls into doubt its utility in making predictions about the likelihood of potential absorbers. The Churchill et al. (2005) results suggest that the observed galaxies can indeed be considered potential hosts of the absorber, even with their relatively large impact parameters. The identity of the absorber then is still an open question.
4.2 An alternative absorbing galaxy.
There are three objects closer to PKS 2126158 than Galaxy #17. These can be seen in Fig. 7, along with some of the group members. A spectrum of the object west of PKS 2126158 was observed by Veron et al. (1990) (their C1). They were unable to measure its redshift, but its optical and near-infrared colours are similar to their C2 (the next galaxy to the west), which they found to be at . It is therefore likely that this galaxy is foreground to the group at .
The remaining two nearby objects were not able to be observed in our GMOS observations (due to the limitations of slit placement). Object X1 appears to be stellar in morphology, and has colours – not typical of a galaxy at the same redshift as the group. Similarly, the more distant (from the QLOS) object X3 has a stellar morphology, and even bluer colours than X1 (), and thus is likely to be a star.
The closest object to the quasar, X2, has an extended, non-stellar morphology, and redder colours than X1 or X3: , similar to the colours of the galaxies in the group at . It may thus be a galaxy in the same system. This putative galaxy would then lie at a projected distance of from the QLOS, making it a possible candidate as a host of the absorbing system. Its impact parameter provides a good match to the stronger absorption systems, if one uses the relationship of Lanzetta & Bowen (1990). A further point in its favour is its extended, somewhat elongated morphology – suggestive of a disc galaxy, matching the morphology of many Mg ii-absorbing galaxies.
4.3 Intra-group gas as an absorber.
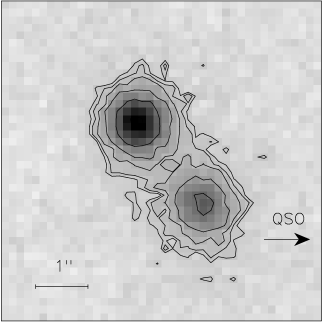
Is the absorbing gas necessarily associated with a galaxy? The fact that we have a group environment means that the velocity dispersion is comparable to the rotational velocities of the individual galaxies. Galaxy interactions are then more likely to strip gas from galaxies and leave it in the intra-group medium. Such interactions could date from the formation epoch of the group, or from more contemporary encounters. An potential example of such an interaction, based on imaging data, is the pair #17 and #18. The velocity difference between the two (), is comparable to the velocity dispersion of the group, and so is feasible for an interaction.
A close-up of this pair of galaxies is shown in Fig. 8. There is evidence for a connection in flux between the two, with the flux in the “bridge” region reaching above the background. There is certainly no spectroscopic sign of any strong interaction taking place, with both galaxies exhibiting simple passive elliptical spectra. However, sensitive narrow-band imaging may be able to detect H emission from ejected gas in the vicinity of the galaxies, and would prove a good test of this interaction hypothesis.
4.4 Summary and Discussion
PKS 2126158 is observed to have a strong Mg ii absorption system at the same redshift as the group of galaxies detected through our GMOS spectroscopy. All the nearby galaxies that have spectroscopy are observed to be ellipticals: each shows a passive elliptical galaxy spectrum, and none shows evidence for on-going star-formation (for instance, through the presence of an [O ii] emission line), which would indicate the presence of large amounts of gas.
Many Mg ii absorbers are identified with spiral galaxies (e.g. Steidel et al., 2002), although this is by no means an exclusive statement. Steidel et al. (1994) found that Mg ii absorption could be found in galaxies resembling present-day ellipticals as well as late-type spirals, Jenkins et al. (2005) found Mg ii absorption associated with two S0 galaxies, and recent studies (Churchill et al., 2005) have found a small fraction of elliptical absorbers. The latter studies also indicate that the absorption is also relatively patchy, and so one (or more) of the galaxies could have isolated areas of absorbing gas that happen to fall across the QLOS, but are not themselves an important overall part of the galaxy. This may be similar to the situation observed by Bowen et al. (1995), who failed to find absorption associated with two elliptical galaxies despite their small impact parameters.
It is possible that there is intra-group gas responsible for the absorption, although there is little direct evidence for this at this stage. The best candidate, however, for the absorber is probably galaxy X2. It is closer to the QLOS, and shows a much less uniform morphology than the identified galaxies. Ultimately, a spectroscopic confirmation of its redshift is the only way to be sure – future observations will hopefully resolve this question.
5 The likelihood of gravitational lensing.
PKS 2126158 is rather luminous at all frequencies from radio to X-ray. We would like to know whether it is intrinsically luminous, or has been magnified through gravitational lensing by some intermediate mass distribution. Strong lensing can be ruled out, as PKS 2126158 is not multiply-imaged – even at VLBI resolution ( mas), it shows a distinct core-jet structure (Stanghellini et al., 2001).
Magnification due to gravitational lensing is still possible without multiple images being detected. There are two contexts in which this can take place: either a single image is produced, or there are indeed multiple images but at either faint levels or unresolved separations. Since VLBI observations place quite strong limits on the existence of optically-unresolved images, for lensing to be taking place we would require the production of a single image only.
However, Keeton, Kuhlen & Haiman (2005) find that this is possible only when the lensing is due to massive cluster-sized haloes (). Our observations show that the largest mass concentration along the line-of-sight is merely a galaxy group. The total luminosity of all galaxies in the group is (assuming an absolute magnitude of the Sun of , and taking into account all possible members, including X2 and the fainter objects in Fig. 7). For reasonable mass-to-light ratios, the group mass will be much less than the threshold given by Keeton et al. (2005). This is supported by the non-detection by Crawford & Fabian (2003) of any extended X-ray emission in Chandra images of PKS 2126158, indicating the lack of hot cluster gas around or in the foreground of the quasar. We can thus rule out the possibility that PKS 2126158 is being magnified by any significant amount. Its large apparent luminosity is then indeed indicative of its intrinsic power.
6 Summary
We have observed the field surrounding PKS 2126158 with Gemini South + GMOS in multi-object spectroscopy mode, measuring the redshifts of most of the nearby galaxies. We find a group of galaxies at , at a similar velocity to a metal-line absorption system seen in the quasar’s spectrum. The group has five confirmed members, and a further four fainter galaxies are seen nearby and are possibly associated. There are a further three galaxies close in redshift but at large separations on the sky – while not part of the group, they are certainly part of the same large-scale structure.
We have also made use of the multiplexing capabilities of GMOS to measure the redshifts of many other galaxies in the field, and we see several distinct features in redshift-space foreground to the group. These observations, in showing the lack of a large cluster in front of PKS 2126158, indicate that the likelihood the quasar is lensed is small.
While the group as a whole appears to be associated with the absorption system, the fact that the redshifts of a number of nearby candidates have not been measured means some doubt remains as to the identity of the absorber. If the absorber is associated with the identified galaxies however, this would be a rare example of an Mg ii absorption system associated with an early-type galaxy.
Acknowledgments
We wish to thank the staff at Gemini South for their help in obtaining the spectroscopic data, particularly acknowledging the help provided by Michael Ledlow, our contact scientist until his tragic passing. MTW acknowledges the assistance provided by a NewSouth Global Fellowship from the University of New South Wales.
This work is based on observations obtained at the Gemini Observatory under Gemini Program GS-2003B-Q-15. The Gemini Observatory is operated by the Association of Universities for Research in Astronomy, Inc., under a cooperative agreement with the NSF on behalf of the Gemini partnership: the National Science Foundation (United States), the Particle Physics and Astronomy Research Council (United Kingdom), the National Research Council (Canada), CONICYT (Chile), the Australian Research Council (Australia), CNPq (Brazil), and CONICET (Argentina).
References
- Allen et al. (1993) Allen D. et al. 1993, PASA, 10, 298
- Bell et al. (2003) Bell E., McIntosh D., Katz N., Weinberg M., 2003, ApJS, 149, 289
- Bergeron & Boisse (1991) Bergeron J., Boisse P., 1991, A&A, 243, 344
- Bowen et al. (1995) Bowen D., Blades J., Pettini M., 1995, ApJ, 448, 634
- Churchill et al. (2005) Churchill C., Kacprzak G., Steidel C., 2005, in IAU Colloq. 199: Probing Galaxies through Quasar Absorption Lines. pp 24–41
- Condon et al. (1977) Condon J., Hicks P., Jauncey D., 1977, AJ, 82, 692
- Crawford & Fabian (2003) Crawford C., Fabian A., 2003, MNRAS, 339, 1163
- D’Odorico et al. (1998) D’Odorico V., Cristiani S., D’Odorico S., Fontana A., Giallongo E., 1998, A&AS, 127, 217
- Drinkwater et al. (1997) Drinkwater M. et al. 1997, MNRAS, 284, 85
- Francis et al. (2000) Francis P., Whiting M., Webster R., 2000, PASA, 17, 56
- Fukugita et al. (1996) Fukugita M., Ichikawa T., Gunn J., Doi M., Shimasaku K., Schneider D., 1996, AJ, 111, 1748
- Giallongo et al. (1993) Giallongo E., Cristiani S., Fontana A., Trevese D., 1993, ApJ, 416, 137
- Hook et al. (2002) Hook I. et al. 2002, Proc. SPIE, 4841, 1645
- Jauncey et al. (1978) Jauncey D., Wright A., Peterson B., Condon J., 1978, ApJ, 223, L1
- Jenkins et al. (2005) Jenkins E., Bowen D., Tripp T., Sembach K., 2005, ApJ, 623, 767
- Keeton et al. (2005) Keeton C., Kuhlen M., Haiman Z., 2005, ApJ, 621, 559
- Lanzetta & Bowen (1990) Lanzetta K., Bowen D., 1990, ApJ, 357, 321
- Poggianti (1997) Poggianti B., 1997, A&AS, 122, 399
- Richards et al. (2004) Richards G. et al. 2004, AJ, 127, 1305
- Ryabinkov et al. (2003) Ryabinkov A., Kaminker A., Varshalovich D., 2003, A&A, 412, 707
- Siebert et al. (1998) Siebert J., Brinkmann W., Drinkwater M., Yuan W., Francis P., Peterson B., Webster R., 1998, MNRAS, 301, 261
- Spergel et al. (2003) Spergel D. et al. 2003, ApJS, 148, 175
- Stanghellini et al. (2001) Stanghellini C., Dallacasa D., O’Dea C., Baum S., Fanti R., Fanti C., 2001, A&A, 377, 377
- Steidel et al. (1997) Steidel C., Dickinson M., Meyer D., Adelberger K., Sembach K., 1997, ApJ, 480, 568
- Steidel et al. (1994) Steidel C., Dickinson M., Persson S., 1994, ApJ, 437, L75
- Steidel et al. (2002) Steidel C., Kollmeier J., Shapley A., Churchill C., Dickinson M., Pettini M., 2002, ApJ, 570, 526
- Veron et al. (1990) Veron P., Veron-Cetty M.-P., Djorgovski S., Magain P., Meylan G., Surdej J., 1990, A&AS, 86, 543
- Wright & Otrupcek (1990) Wright A., Otrupcek R., 1990, The Parkes Catalogue (PKSCAT90). Australia Telescope National Facility, Epping