Probing Star Formation in Interacting Galaxies Using UV and Mid-IR: The Case of Arp 82
Abstract
To help understand the effects of galaxy interactions on star formation, we analyze Spitzer infrared and GALEX ultraviolet images of the interacting galaxy pair Arp 82 (NGC 2535/6), and compare to a numerical simulation of the interaction. We investigate the UV and IR properties of several star forming regions (clumps). Using the FUV/NUV colors of the clumps we constrain the ages. The 8 m and 24 m luminosities are used to estimate the far-infrared luminosities and the star formation rates of the clumps. We investigate possible gradients in the UV and IR colors. See Smith et al. (2006a,b) for global results on our entire interacting sample.
1Department of Physics, Astronomy, and Geology, East Tennessee State University, Box 70652, Johnson City, TN 37614
2Department of Physics and Astronomy, Iowa State University, Ames, IA 50011
3Spitzer Science Center, California Institute of Technology, Pasadena, CA 91125
4Department of Physics, University of Crete, 71003 Heraklion, Greece
1. Introduction
We are investigating whether or not interacting but not yet merging galaxies have heightened star formation properties. In our Spitzer Spirals, Bridges, and Tails interacting galaxy study (Smith et al. 2006a, b), we have compiled a sample of interacting galaxies selected from the Arp Atlas of Peculiar Galaxies (Arp 1966). We have previously presented a detailed study of one of these galaxies, Arp 107, in Smith et al. (2005). In the current proceeding we investigate a second system, the interacting pair Arp 82 (NGC 2535/6) (Hancock et al. 2006). We have obtained UV, visible, and IR images of Arp 82 from GALEX, SARA, and Spitzer telescopes respectively.

2. Discussion
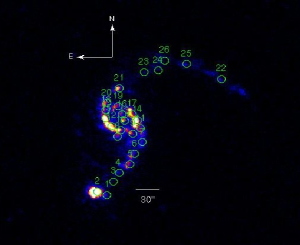
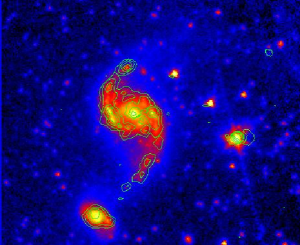
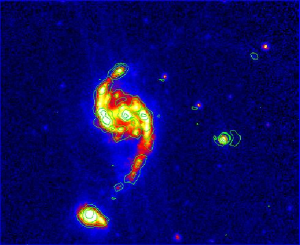
Figure 1 displays various images of Arp 82. The top left is a GALEX far-UV image with the 26 clumps identified. The northern galaxy is NGC 2535 and southern galaxy is NGC 2536. The top right image in Figure 1 is Arp 82 in the Spitzer IRAC 3.6 m band with H contours from the SARA telescope. The bottom left image in Figure 1 is Arp 82 in the Spitzer IRAC 8 m band with SARA H contours. The tail is more prominent in the UV than in the IR while the center is much less prominent. Note that there are FUV and 8 m clumps in the tail region that are not seen in H. The star forming regions at 8 m and in the FUV are more prominent than at 3.6 m.
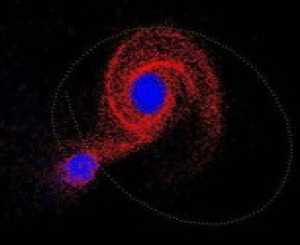
The bottom right image in Figure 1 is a snapshot of a smooth particle hydrodynamics model of the gas in red and old stars in blue. This image shows Arp 82 about 1 Gyr after the initial closest approach. The dotted curve shows the companion’s passage. The orbit is nearly planar. The long duration is needed to allow particles to propagate out to the large distances observed.
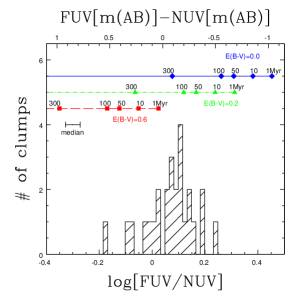
Four individual plots are seen in Figure 2. The top left plots the GALEX FUV/NUV distribution. A Starburst99 (Leitherer et al. 1999) stellar population synthesis model reddened with E(B-V)=0.0(blue), 0.2(green), and 0.6(red) mag according to the Calzetti, Kinney, & Storchi-Bergmann (1994) reddening law is shown at the top of the histogram. Selected ages are marked. The top axis is in magnitudes. Most of the clumps have an E(B-V) between 0.2 and 0.6 mag and ages Myr while a few clumps may be Myr.
We have determined the star formation rate (SFR) for the clumps using two independent methods. First, we estimated them from the L(IR) using the calibration in Kennicutt (1998). The clumps have a total SFRIR of M⊙ yr-1. Second, we estimated the SFR from the Lν(FUV) using the UV SFR calibration in Kennicutt (1998). The total SFRUV of the clumps is M⊙ yr-1, in good agreement with the SFRIR. No reddening correction has been applied to the Lν(FUV).
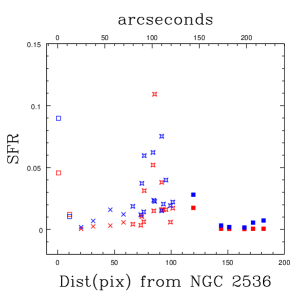
The top right plot in Figure 2 shows the star formation rate (SFR) versus distance from NGC 2536. The red symbols are the SFR determined from L(IR) and the blue symbols are the SFR determined from Lν(FUV). The open boxes represent clumps in NGC 2536, x’s represent clumps in the bridge region, stars represent clumps in the spiral (NGC 2535) region, and filled boxes represent clumps in the tail region. The top axis is in arcseconds.
From this figure it can be seen that the SFR is greatest in the spiral region of NGC 2535 and in NGC 2536, with much less star formation in the bridge and tail regions. It can also be seen that the SFR’s of clumps in the bridge and tail regions have much better agreement than do the SFR’s of clumps in NGC 2536 and the spiral regions. In most cases the SFRUV is greater than the SFRIR. If an extinction correction were applied to the Lν(FUV) the SFRUV would be greater and the agreement with SFRIR would be worse.
The clumps in the bridge and tail regions account for about 7% of the total clump SFRIR, while the 2 clumps in the small companion, NGC 2536, and the 2 largest clumps in the spiral region of NGC 2535 (#13 and #16) make up about 42% of the total clump SFRIR. The SFRIR of the entire Arp 82 system is 1.2 M⊙ yr-1, while the entire system SFRUV is 2.7 M⊙ yr-1. The total clump SFRIR accounts for about 36% of the entire system SFRIR.
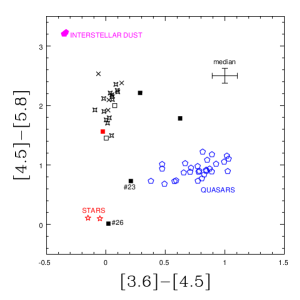
The bottom left graph in Figure 2 plots the IRAC [4.5][5.8] vs [3.6][4.5] colors of the clumps. The data symbols are the same as above. Also included in this figure are the predicted IRAC colors for interstellar dust (Li & Draine 2001), the Sloan Digitized Sky Survey quasars in the Spitzer Wide-Area Infrared Extragalactic Survey (SWIRE) Elais N1 field (Hatziminaoglou et al. 2005), and the colors of M III stars from M. Cohen (2005, private communication) and field stars from Whitney et al. (2004). The quasars have redshifts between 0.5 and 3.65; since their spectral energy distributions are power laws, their infrared colors do not vary much with redshift. From these figures, it can be seen that clumps #23 and #26 have colors consistent with those of quasars and field stars respectively and may not be part of Arp 82.
Most of the clumps have [4.5][5.8] colors between those of the ISM and stars, indicating contributions from both to this color. Clumps #24 and #25, which are in the northern tail, have colors similar to those of ISM (but with large uncertainties). Thus these appear to be very young star formation regions with little underlying old stellar population.
The bottom right graph in Figure 2 plots the IRAC [4.5][5.8] color vs distance from NGC 2536. The data symbols and horizontal axis are the same as above. From this plot it can be seen that clumps in the bridge and tail regions seem to have different relative ages than those in the spiral region. The [4.5][5.8] colors are generally very red (i.e., very ‘starbursty’), except for the two low S/N clumps in the tail, #23 and #26.
Acknowledgments.
This work is based in part on observations made with the Spitzer Space Telescope, which is operated by the Jet Propulsion Laboratory, California Institute of Technology under contract with NASA. GALEX is a NASA Small Explorer mission, developed in cooperation with the Centre National d’Etudes Spatiales of France and the Korean Ministry of Science and Technology. This research was supported by NASA Spitzer grant 1263924, NSF grant AST 00-97616, NASA LTSA grant NAG5-13079, and GALEX grant GALEXGI04-0000-0026. This work has made use of the NASA/IPAC Extragalactic Database (NED), which is operated by the Jet Propulsion Laboratory, California Institute of Technology, under contract with NASA.
References
- Arp (1966) Arp, H. 1966, Atlas of Peculiar Galaxies (Pasadena: Caltech)
- Bushouse, Lamb & Werner (1988) Bushouse, H. A., Lamb, S. A., & Werner, M. W. 1988, ApJ, 335, 74
- Calzetti, Kinney, & Storchi-Bergmann (1994) Calzetti, D., Kinney, A. L., & Storchi-Bergmann, T. 1994, ApJ, 429, 582
- Hancock et al. (2006) Hancock, M. et al. 2006 in preparation
- Hatziminaoglou et al. (2005) Hatziminaoglou, E., et al. 2005, AJ, 129, 1198
- Kennicutt (1998) Kennicutt, R. C. 1998, ARA&A, 36, 189
- Leitherer et al. (1999) Leitherer, C.,et al. 1999, ApJS, 123, 3
- Li & Draine (2001) Li, A. & Draine, B. 2001, ApJ, 554, 778
- Smith et al. (2006a) Smith, B. J., et al. 2006a, this proceedings
- Smith et al. (2006b) Smith, B. J. et al. 2006b, in preparation
- Smith et al. (2005) Smith, B. J. et al. 2005, ApJ, 130, 2117
- Whitney et al. (2004) Whitney, B. A., et al. 2004, ApJS, 154, 315