X-ray emission from the blazar AO 0235+16: the XMM-Newton and Chandra point of view††thanks: Based on observations obtained with XMM-Newton, an ESA science mission with instruments and contributions directly funded by ESA Member States and NASA, and with the NASA Chandra X-Ray Observatory
In this paper we analyse five observations of the BL Lac object AO 0235+16 performed with the Chandra and XMM-Newton satellites during the years 2000–2005. In the February 2002 observation the source is found in a bright state and presents a steep X-ray spectrum, while in all the other epochs it is faint and the spectrum is hard. The soft X-ray spectrum appears to be strongly absorbed, likely by the intervening system at , which also absorbs the optical–UV radiation. We find that models that consider spectral curvature are superior to single power law ones in fitting the X-ray spectrum. In particular, we favour a double power law model, which agrees with the assumption of a superposition of two different components in the X-ray domain. Both in the Chandra and in one of the XMM-Newton observations, a tentative detection of the redshifted Fe K emission line may suggest its origin from the inner part of an accretion disc. Thermal emission from this accretion disc might explain the UV–soft-X-ray bump that appears in the spectral energy distributions, when the X-ray spectra are complemented with the optical–UV data from the Optical Monitor onboard XMM-Newton. More likely, the bump can be interpreted in terms of an additional synchrotron component emitted from an inner region of the jet with respect to that where the lower-energy emission comes from. An inspection of the X-ray light curves reveals that intraday variability occurs only when the source is in a bright state.
Key Words.:
galaxies: active – galaxies: BL Lacertae objects: general – galaxies: BL Lacertae objects: individual: AO 0235+16 – galaxies: jets – galaxies: quasars: general1 Introduction
The BL Lac object AO 0235+16 () is known to be an intriguing source, exhibiting a number of extreme properties. It has shown large amplitude variability on long time scales (months–years) and noticeable intraday variability (IDV) over a wide range of the electromagnetic spectrum, from the radio to the optical band (Takalo et al. tak92 (1992); Heidt & Wagner hei96 (1996); Noble & Miller nob96 (1996); Romero et al. rom97 (1997); Kraus et al. kra99 (1999); Romero et al. rom00 (2000); Raiteri et al. rai01 (2001), rai05 (2005)). These observations support the idea that the radiation from this object is strongly beamed towards us, with Doppler factors reaching up to (Fujisawa et al. fuj99 (1999); Frey et al. fre00 (2000); Jorstad et al. jor01 (2001); Kraus et al. kra03 (2003)).
The interpretation of optical variability is made difficult by the presence of a complex environment (Yanny et al. yan89 (1989); Burbidge et al. bur96 (1996); Nilsson et al. nil96 (1996)). A couple of objects at redshift are very close to the line of sight: one is an AGN (named ELISA by Raiteri et al. rai05 (2005)) located 2 arcsec south of the source, affecting its optical–UV photometry. This object is probably interacting with the other close object, a galaxy lying 1.3 arcsec east of AO 0235+16, and this intervening system strongly absorbs the IR-to-soft-X-ray radiation of the blazar. Absorption lines due to this damped Ly (DLA) intervening system are seen in the optical and UV spectra of AO 0235+16. In particular, a fit to the Ly absorption line profile of the Hubble Space Telescope (HST) spectrum taken in February 1998 led to an estimate of the hydrogen column density at , which is according to Turnshek et al. (tur03 (2003)), and according to Junkkarinen et al. (jun04 (2004)).
Moreover, objects in the same intervening system could act as microlenses for the source emission, so that an interpretation of at least some episodes of variability in terms of extrinsic processes cannot be ruled out (Stickel et al. sti88 (1988); Takalo et al. tak98 (1998); Webb et al. web00 (2000); but see also the critical discussion by Kayser kay88 (1988)).
AO 0235+16 has recently been the target of a huge multiwavelength observing effort led by the Whole Earth Blazar Telescope111http://www.to.astro.it/blazars/webt/ (WEBT; e.g. Villata et al. vil00 (2000), vil02 (2002), 2004a , 2004b ) in the observing seasons 2003–2004 and 2004–2005. Three XMM-Newton pointings were awarded to get information on the high-energy emission of the source. The results of the radio to optical monitoring during the first season of the campaign, together with an analysis of the XMM-Newton pointing of January 2004, have already been published by Raiteri et al. (rai05 (2005)). Here we present the results of the XMM-Newton observations performed in August 2004 and January 2005, during the second observing season of the WEBT campaign. The other multiwavelength data collected by the WEBT in this period will be published elsewhere (Raiteri et al. rai06 (2006)). We also analyse an archival XMM-Newton pointing performed in February 2002 and re-analyse the Chandra data taken in August 2000 (Turnshek et al. tur03 (2003)) and those from the XMM-Newton pointing of January 2004. The aim is to better understand both the X-ray properties of this enigmatic source through a homogeneous analysis of the most recent data and their relationship with the lower-energy emission. In particular, we investigate the existence of a spectral curvature in the X-ray energy range as well as the presence of a bump in the UV–soft-X-ray region of the SED.
This paper is organized as follows: in Section 2 we review past observations of AO 0235+16 by X-ray satellites. A detailed analysis of the X-ray data acquired by Chandra in August 2000 and by XMM-Newton in 2002–2005 is performed in Section 3, where the possibility that the fluorescent Fe K line was detected in some of the above spectra is also discussed. In Section 4 the X-ray spectra are complemented by the optical and UV data from the Optical Monitor onboard XMM-Newton and the resulting UV–soft-X-ray bump is discussed in Section 5. The X-ray light curves corresponding to the above pointings are presented in Section 6. Conclusions are drawn in Section 7.
2 Previous X-ray observations by other satellites
| Satellite | Observation | Energy range | Referencea | |||
| date | (keV) | () | () | |||
| Einstein | 1979–1981 | 0.1–3.5 | 3.25 | 1.51 | (1) | |
| EXOSAT | Aug. 1, 1984 | 0.1–10 | 1.75 | 1.44 | (2) | |
| ROSAT | Jul. 21 – Aug. 15, 1993 | 0.1–2.1 | 0.76, 3.8 | 2.67 | 1.24 | (3) |
| ROSAT | Jul. 26, 1993 | 0.1–2.0 | 2.46 | 2.59 | 1.15 | (4) |
| ROSAT | Aug. 15, 1993 | 0.1–2.0 | 2.61 | 2.54 | 0.41 | (4) |
| ASCA | Feb. 4–19, 1994 | 0.5–10 | 0.76, 4.6 | 1.96 | 0.3 | (3) |
| RXTE | Nov. 3–6, 1997 | 2–60 | - | 1.41 | (0.14)b | (5) |
| ASCA | Feb. 11–12, 1998 | 0.5–10 | 0.76, 4.6 | 1.72 | 0.278 | (6) |
| BeppoSAX | Jan. 28, 1999 | 0.1–10 | 2.8 | 1.96 | 0.20 | (7) |
| a (1) Worral & Wilkes (wor90 (1990)); (2) Ghosh & Soundararajaperumal (gho95 (1995)); (3) Madejski et al. (mad96 (1996)); | ||||||
| (4) Comastri et al. (com97 (1997)); (5) Webb et al. (web00 (2000)); (6) Junkkarinen et al. (jun04 (2004)); (7) Padovani et al. (pad04 (2004)) | ||||||
| b | ||||||
In this section we briefly review the results derived from past X-ray observations of AO 0235+16. They are summarized in Table LABEL:past in terms of the hydrogen column density adopted to model the X-ray absorption, the photon index 222The photon index is related to the energy index through , recalling that the specific flux at frequency is , and the unabsorbed 1 keV flux density.
Worral & Wilkes (wor90 (1990)) analysed the data taken by the Einstein Observatory imaging proportional counter (IPC) in 1979–1981. They fit the data with a power law with free Galactic absorption and noticed that an value larger than the typical one for Galactic absorption was required to obtain a good fit.
EXOSAT observed the source in 1983–1986. Data taken during the pointing of August 1, 1984 were analysed by Ghosh & Soundararajaperumal (gho95 (1995)) in terms of a simple power law plus absorption; the highly uncertain value of was compatible with the Galactic one.
Madejski et al. (mad96 (1996)) presented data taken by ROSAT in summer 1993 and data obtained by ASCA in February 1994. They first fit the X-ray spectrum with a power law plus free absorption model, and this led to an extra-absorption. Then, a model with fixed Galactic absorption plus free absorption at was adopted. The ROSAT data showed AO 0235+16 in a bright and active state, revealing flux variations up to % on a 3 day timescale. On the contrary, no short-term variability was detected by ASCA, which observed the source in a much fainter state. The comparison between the ROSAT and ASCA results revealed spectral variability on the long term, which was interpreted by Madejski et al. (mad96 (1996)) as a dominance of the steep tail of the synchrotron component when the source is bright, and a prevalence of the fainter and harder Compton component when it is faint. The authors ruled out the possibility that a significant Fe K line was present at either or , with 90% confidence limits on the line equivalent width of eV and eV, respectively.
Because of the flux variability detected in the ROSAT data, Comastri et al. (com97 (1997)) analysed the ROSAT observations of summer 1993 by separating those with low count rates from those with high count rates. Indeed, they reported a factor difference in the flux, but a more or less constant spectral index.
The source was observed by RXTE in November 1997, during the rising phase of a big radio–optical outburst (Webb et al. web00 (2000); Raiteri et al. rai01 (2001)). Webb et al. (web00 (2000)) analysed the X-ray data with a power law model and reported a very low X-ray flux (see Table LABEL:past). It was suggested that the X-ray response to the low-energy flux increase may be delayed or insignificant.
ASCA pointed again at the source on February 11, 1998; the results were published by Junkkarinen et al. (jun04 (2004)). The spectrum was harder with respect to the previous ASCA pointing, 4 years earlier, and the flux in the 2–10 keV energy range was 3.4 times higher.
Data acquired by BeppoSAX on January 28, 1999 were reported by Padovani et al. (pad04 (2004)). They found extra-absorption and both spectral index and flux consistent with the values derived by Madejski et al. (mad96 (1996)) for the ASCA data. The problem of a possible contribution to the X-ray flux by the southern AGN was also discussed, leading to the conclusion that it should be roughly a factor 10 smaller than that observed for AO 0235+16.
We notice that Table LABEL:past can help to trace both the flux and spectral X-ray variability of the source, but it is not exhaustive, since in most of the above mentioned papers more than one model was applied and discussed. Yet, it is not possible to find a common model for all cases, and the comparison among results from different observations suffers from inhomogeneous data analysis. It is to avoid such a difficulty that in this paper we have analysed or re-analysed the last five X-ray observations using the same data treatment333A uniform re-analysis of the archival ASCA and BeppoSAX data is given in Kadler (kad05b (2005)).
3 XMM-Newton and Chandra X-ray spectra
In this section we present the X-ray spectra of AO 0235+16 taken by XMM-Newton in August 2, 2004 and January 28, 2005, during the second observing season of the WEBT campaign on this source. The results will be compared with those obtained by re-analysing the XMM-Newton observation performed in January 18–19, 2004, during the first season of the WEBT campaign (Raiteri et al. rai05 (2005)), and with those derived from the analysis of archival XMM-Newton spectra taken in February 10, 2002. Moreover, we also re-analyse the data of a Chandra pointing on August 20–21, 2000, which have been already presented by Turnshek et al. (tur03 (2003)). Table LABEL:counts reports the date, the UT of start and end as well as the duration of the exposure for each pointing and for each instrument.
| Detector | Start | End | Duration |
| (UT) | (UT) | (s) | |
| Chandra: August 2000 | |||
| PI: D. A. Turnshek | |||
| ACIS-S | Aug. 20, 23:39:52 | Aug. 21, 08:43:05 | 30625 |
| XMM-Newton: February 2002 | |||
| PI: M. Watson | |||
| MOS1 | Feb. 10, 04:27:48 | Feb. 10, 09:46:33 | 19125 |
| MOS2 | Feb. 10, 04:27:47 | Feb. 10, 09:46:33 | 19126 |
| pn | Feb. 10, 05:01:03 | Feb. 10, 09:41:50 | 16847 |
| XMM-Newton: January 2004 | |||
| PI: C. M. Raiteri | |||
| MOS1 | Jan. 18, 19:07:18 | Jan. 19, 03:25:01 | 29863 |
| MOS2 | Jan. 18, 19:07:18 | Jan. 19, 03:25:06 | 29868 |
| pn | Jan. 18, 19:12:28 | Jan. 19, 03:26:59 | 29671 |
| XMM-Newton: August 2004 | |||
| PI: C. M. Raiteri | |||
| MOS1 | Aug. 02, 00:42:16 | Aug. 02, 03:56:35 | 11659 |
| MOS2 | Aug. 02, 00:42:14 | Aug. 02, 03:56:40 | 11666 |
| pn | Aug. 02, 00:47:24 | Aug. 02, 03:58:35 | 11471 |
| XMM-Newton: January 2005 | |||
| PI C. M. Raiteri | |||
| MOS1 | Jan. 28, 14:43:36 | Jan. 28, 19:17:57 | 16461 |
| MOS2 | Jan. 28, 14:43:40 | Jan. 28, 19:18:03 | 16463 |
| pn | Jan. 28, 14:48:46 | Jan. 28, 19:19:56 | 16270 |
3.1 Data reduction
Chandra observed AO 0235+16 on August 20–21, 2000 with ACIS-S. The image, which has a space resolution of 0.492 arcsec/px, does not show any emission 2 arcsec south of the source, thus ruling out an appreciable contribution from the southern AGN, named ELISA.
Data were reduced with the CIAO package version 3.0.2. We extracted the source spectrum from a circular region of 3 arcsec size around the source and the background spectrum in a surrounding annulus of radii 5 and 10 arcsec. Only the energy channels from 0.4 to 8.0 keV were considered.
The European Photon Imaging Camera (EPIC) onboard XMM-Newton has three detectors: MOS1, MOS2, and pn; they all point at the same object at the same time. All XMM-Newton observations analysed in this paper but the one of February 10, 2002, were performed in small-frame, medium-filter configuration in order to avoid possible problems of pile-up444Photon pile-up occurs when more than one X-ray photon arrives in one camera pixel or in adjacent pixels before it is read out; it can affect both the source point spread function and the spectral response of the instrument., out-of-time events, and degradation.
The data were reduced with the Science Analysis System (SAS) software version 6.0 555When extracting the spectrum of both the source and the background, the strings “FLAG==0” and “PATTERN=4” were included in the selection expression for the evselect task of the SAS software for all the three EPIC detectors to provide conservative event selection criteria.. Source spectra were extracted from a circular region centered on the source; the aperture radius was 30–35 arcsec in all cases but for the February 2002 observations, where it was 100 arcsec. Background spectra were derived from source-free regions on the same CCD of the source. We considered only channels with energy greater than 0.2–0.3 keV and lower than 10–12 keV, depending on the instrument (MOS having stricter limits than pn) and data quality.
In the February 10, 2002 observation the source was detected in a high X-ray state. As the observation was performed using a full-frame, thin-filter configuration, we also checked the possible presence of pile-up with the SAS task epatplot. We found a small excess of double events in the –5 keV energy range in the pn observation, which was removed by extracting the source spectrum in an annulus with an inner radius of 5 arcsec. However, the pn spectrum appears somewhat distorted below keV, hence for the spectral analysis of this observation we used the data from MOS1 and MOS2 only.
After this preliminary data reduction with the specific packages, each source spectrum was associated with its response matrix file, ancillary response file, and background spectrum, as well as binned in order to have a minimum of 25 counts in each bin. This was accomplished with the task grppha of the FTOOL package. These “grouped” spectra were then analysed with the Xspec package, version 11.3.0. For each epoch, only the reliable energy channels were selected, discarding measurements affected by large uncertainties. For all the XMM-Newton observations, data from the different EPIC detectors are fitted simultaneously, i.e. the same model is applied to the MOS1, MOS2, and pn spectra to increase the statistics.
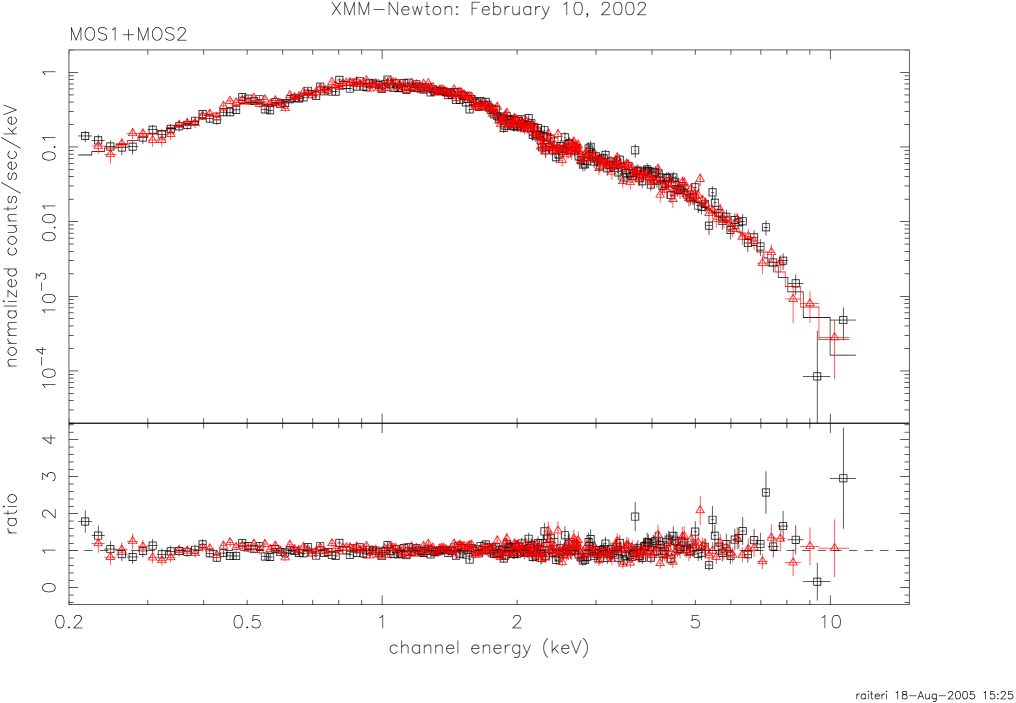
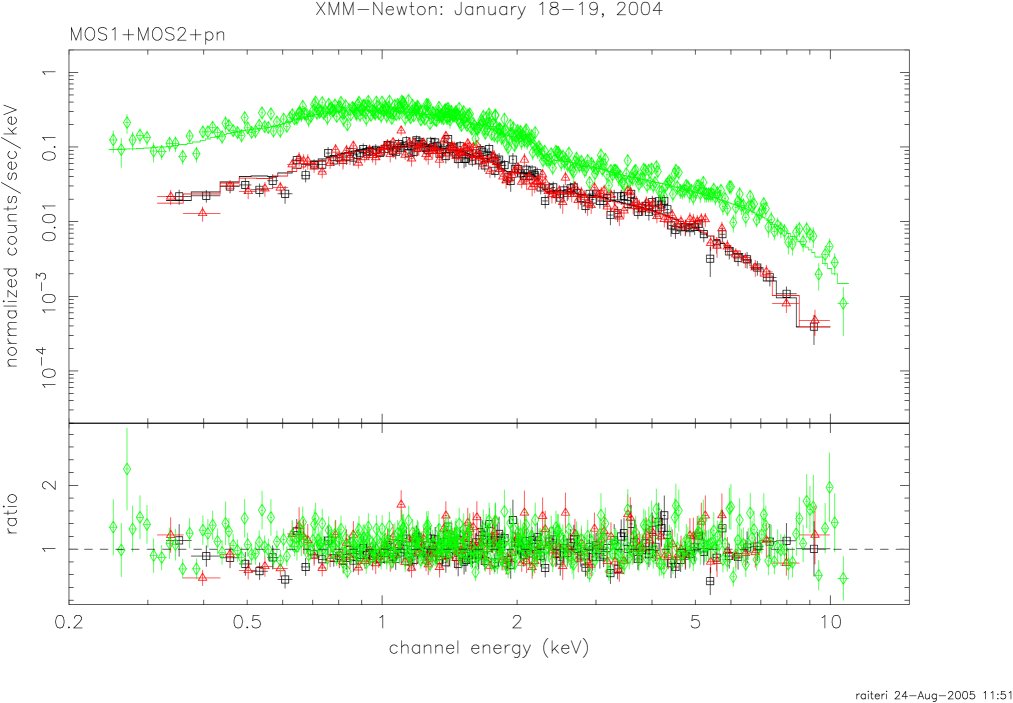
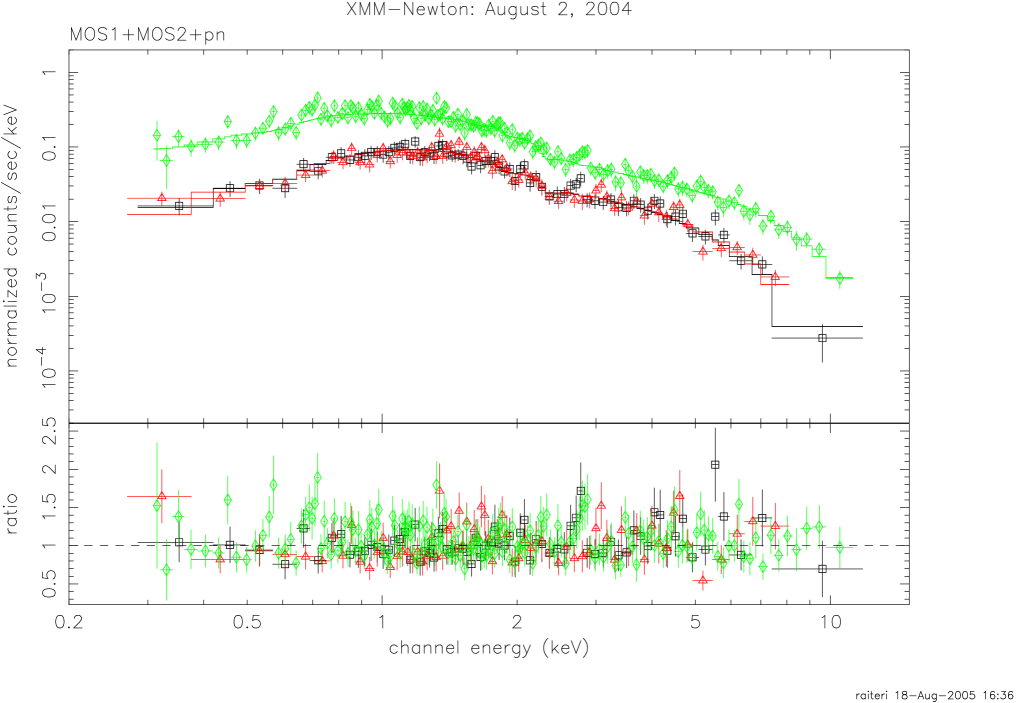
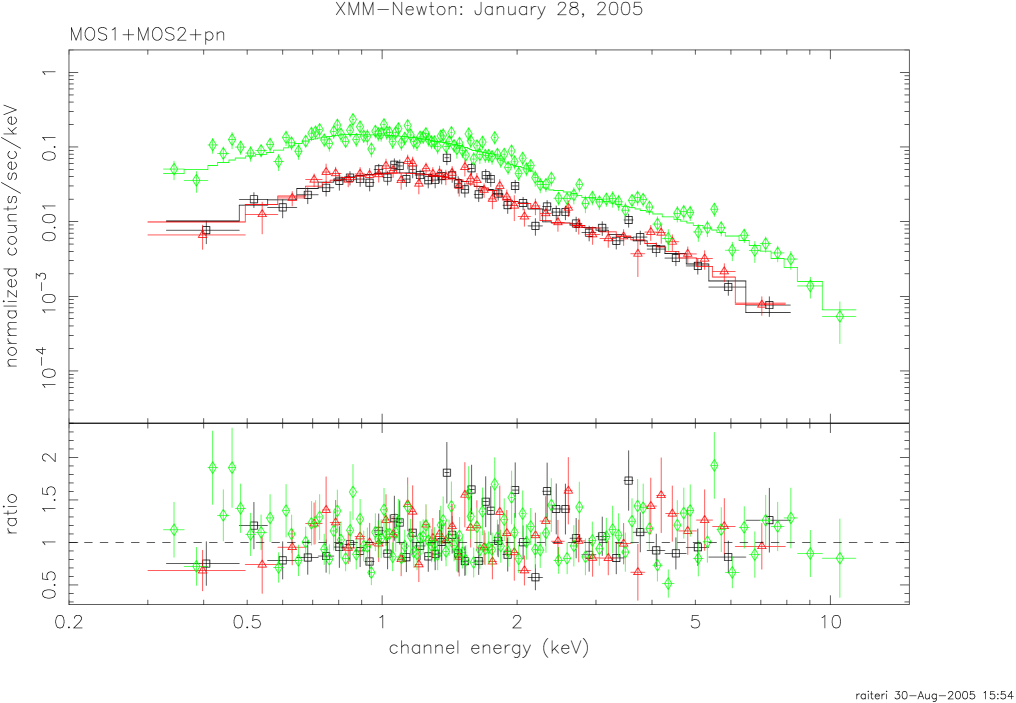
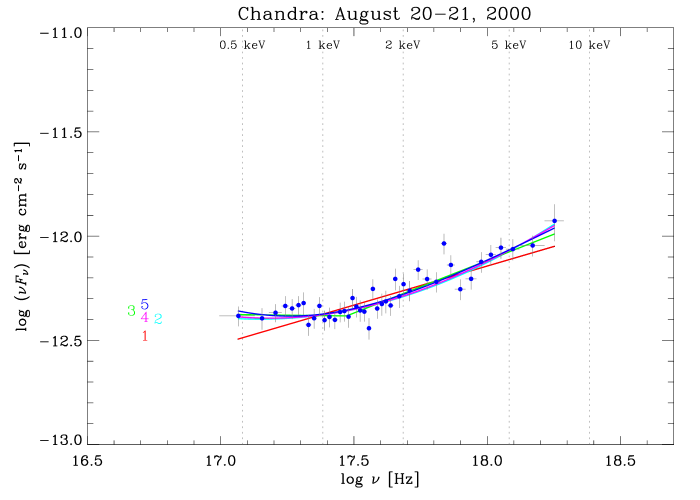
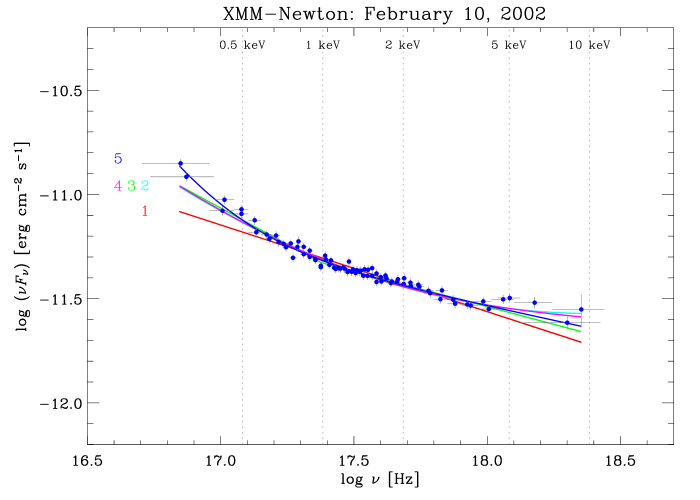
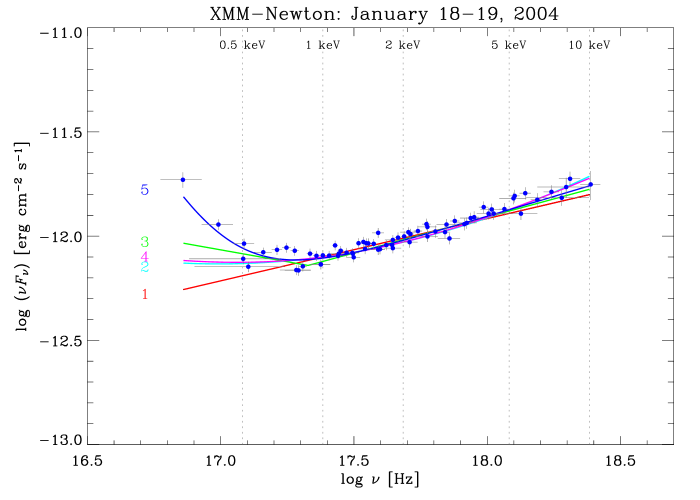
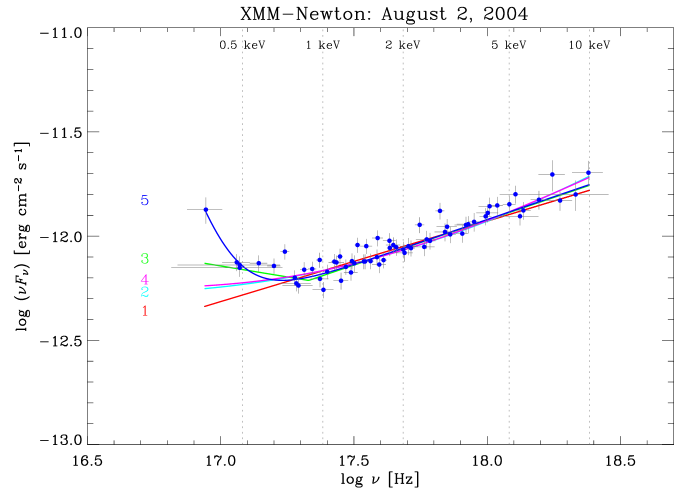
The resulting spectra are shown in Figs. 1–5, fitted by a double power law with Galactic absorption plus extra-absorption by the intervening system at (see next section). The ratio of the data to the model fit is shown in the bottom panels.

In Figs. 2–5 the MOS1 and MOS2 spectra are plotted with black squares and red triangles, respectively, while the pn one is shown with green diamonds.
3.2 Results
We start by considering
-
•
Model 1: a single power law
with fixed Galactic photo-electric absorption, and extra-absorption attributed to the intervening DLA system at . We adopted the value for the Galactic hydrogen column, from the Leiden-Argentine-Bonn Survey666http://www.astro.uni-bonn.de/webrai/german/tools _labsurvey.php (Kalberla et al. kal05 (2005)), which is the most sensitive Milky Way H i survey to date, with the most extensive coverage both spatially and kinematically. Both the Galactic and the absorber are first assumed to have solar abundance ratios, as was done in the past data reductions which led to the results summarized in Table LABEL:past.
Table LABEL:pow shows the results for the Chandra and XMM-Newton pointings analysed in the present work (first line). The fit is good for all cases, but the best-fit value of the system is nearly half the value derived by fitting the Ly absorption line in the HST spectrum of February 1998, which is according to Turnshek et al. (tur03 (2003)), and according to Junkkarinen et al. (jun04 (2004)). Notice that the value derived from the Ly absorption line accounts for neutral hydrogen absorption only, and it is thus a lower limit to the value derived with Xspec, which instead takes into account all the possible absorptions of all elements in molecular, neutral, or ionized form. Moreover, the Galactic gas is metal-poor with respect to solar, and a metal-poor chemical composition appears more suitable also to describe the absorber. We thus re-analyse our datasets by using the Wilms et al. (wil00 (2000)) model for both the interstellar medium and the absorber. This model includes, besides revised abundances for the interstellar medium, updated photoionization cross-sections, as well as a treatment of interstellar grains and molecules. For each observation in Table LABEL:pow, the results of the corresponding analysis are shown in the second row. As one can see, there are little differences in the spectral indices and fluxes with respect to the previous case, but the value of increases, as expected, since now we have less absorbing metals. However, it is still well below the value of derived by Turnshek et al. (tur03 (2003)) and Junkkarinen et al. (jun04 (2004))777When we try more complicated models introducing some spectral curvature, the values increase a bit more, but the uncertainties of the parameters are large..
We then fix the parameter . As a consequence, the single power law model gives a worse fit (see third rows in Table LABEL:pow), especially for the XMM-Newton spectra of February 2002. Thus, we investigate the reliability of other models implying some spectral curvature. We consider
- •
-
•
Model 3: a broken power law for , for
- •
-
•
Model 5: a double power law
all of them with the same two absorption components of Model 1, with fixed values and with the Wilms et al. (wil00 (2000)) model for the photo-electric absorption. The results of these fits are shown in Tables LABEL:parabola–LABEL:double. The last column reports the F-test probability of the model with respect to the Model 1 case with (third rows in Table LABEL:pow). The lower the probability, the better the new model is with respect to the previous one. As one can see from the statistics, all these models fit the data better than a single power law. However, there is not a unique, best-fit model for all the available data.
We notice that this spectral curvature is expected from the superposition of the high-energy tail of the synchrotron (or thermal, see Sect. 6) component on the (higher-energy) inverse-Compton branch, both components possibly implying power-law spectral shapes in this limited energy range. Moreover, in the specific case of AO 0235+16 the curvature should be more dramatic, since previous works have highlighted the existence of a UV–soft-X-ray bump in the SED, indicating that the soft X-ray spectrum must turn up very abruptly towards the UV spectral region (Junkkarinen et al. jun04 (2004); Raiteri et al. rai05 (2005)). From this point of view, Model 5, being the sum of two power laws, appears to be the most suitable model to describe the source spectrum.
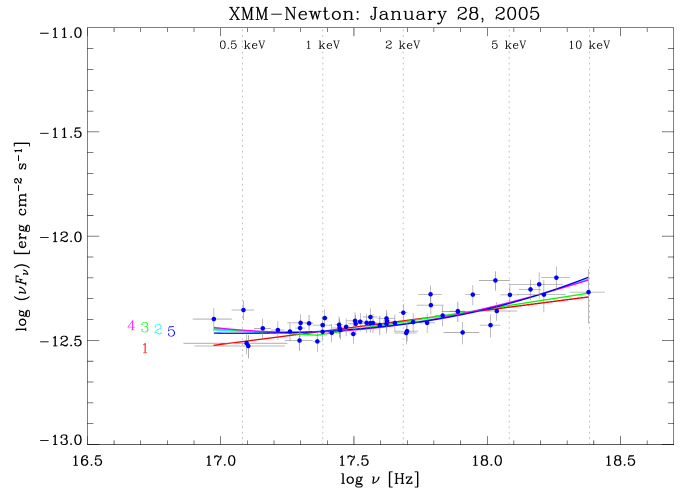
The results of our study are also presented in Figs. 6–10, where the model spectra are shown for each observation. Different model fits are plotted in different colours: Model 1 (single power law) is represented in red, Model 2 (logarithmic parabola) in cyan, Model 3 (broken power law) in green, Model 4 (curved) in pink, and Model 5 (double power law) in blue. Unfolded and unabsorbed data obtained by applying the double power law model are also plotted, after some binning; we have to warn that had we chosen another model to unfold the data, the points would have shown accordingly.
| Satellite | Observation | (2–10 keV) | ||||
|---|---|---|---|---|---|---|
| date | () | () | ( erg cm-2 s-1) | |||
| Chandra | Aug. 2000 | 1.25 | 0.83 (108) | |||
| 1.28 | 0.80 (108) | |||||
| 5.0, fixed | 1.19 | 0.92 (109) | ||||
| XMM | Feb. 2002 | 4.47 | 1.08 (483) | |||
| 4.54 | 1.06 (483) | |||||
| 5.0, fixed | 4.26 | 1.21 (484) | ||||
| XMM | Jan. 2004 | 2.06 | 1.02 (704) | |||
| 2.07 | 1.02 (704) | |||||
| 5.0, fixed | 1.99 | 1.08 (705) | ||||
| XMM | Aug. 2004 | 2.03 | 0.92 (320) | |||
| 2.04 | 0.93 (320) | |||||
| 5.0, fixed | 1.96 | 0.98 (321) | ||||
| XMM | Jan. 2005 | 0.73 | 1.05 (208) | |||
| 0.73 | 1.05 (208) | |||||
| 5.0, fixed | 0.71 | 1.06 (209) |
| Satellite | Observation | (2–10 keV) | F-test | |||||
|---|---|---|---|---|---|---|---|---|
| date | () | () | ( erg cm-2 s-1) | prob. | ||||
| Chandra | Aug. 2000 | 5.0, fixed | 1.82 | 0.38 | 0.17 | 1.36 | 0.79 (108) | |
| XMM | Feb. 2002 | 5.0, fixed | 2.51 | 0.25 | 2.01 | 4.71 | 1.07 (483) | |
| XMM | Jan. 2004 | 5.0, fixed | 1.83 | 0.22 | 0.33 | 2.10 | 1.03 (704) | |
| XMM | Aug. 2004 | 5.0, fixed | 1.73 | 0.18 | 0.28 | 2.04 | 0.96 (320) | |
| XMM | Jan. 2005 | 5.0, fixed | 1.94 | 0.19 | 0.14 | 0.75 | 1.04 (208) |
| Satellite | Observation | (2–10 keV) | F-test | ||||||
|---|---|---|---|---|---|---|---|---|---|
| date | () | (keV) | () | ( erg cm-2 s-1) | prob. | ||||
| Chandra | Aug. 2000 | 5.0, fixed | 2.02 | 1.50 | 1.23 | 0.17 | 1.30 | 0.76 (107) | |
| XMM | Feb. 2002 | 5.0, fixed | 2.70 | 2.34 | 0.98 | 1.94 | 4.51 | 1.06 (482) | |
| XMM | Jan. 2004 | 5.0, fixed | 2.23 | 1.65 | 0.88 | 0.31 | 2.04 | 1.02 (703) | |
| XMM | Aug. 2004 | 5.0, fixed | 2.21 | 1.57 | 0.88 | 0.27 | 2.00 | 0.93 (319) | |
| XMM | Jan. 2005 | 5.0, fixed | 2.08 | 1.80 | 0.95 | 0.14 | 0.72 | 1.06 (207) | 0.223 |
| Satellite | Observation | (2–10 keV) | F-test | ||||||
|---|---|---|---|---|---|---|---|---|---|
| date | () | (keV) | () | ( erg cm-2 s-1) | prob. | ||||
| Chandra | Aug. 2000 | 5.0, fixed | 2.59 | 1.09 | 0.99 | 0.17 | 1.35 | 0.79 (107) | |
| XMM | Feb. 2002 | 5.0, fixed | 3.00 | 2.02 | 1.00 | 2.01 | 4.68 | 1.07 (482) | |
| XMM | Jan. 2004 | 5.0, fixed | 2.30 | 1.39 | 0.98 | 0.33 | 2.10 | 1.03 (703) | |
| XMM | Aug. 2004 | 5.0, fixed | 2.14 | 1.36 | 0.95 | 0.28 | 2.04 | 0.96 (319) | |
| XMM | Jan. 2005 | 5.0, fixed | 2.38 | 1.53 | 1.00 | 0.14 | 0.75 | 1.05 (207) |
| Satellite | Observation | (2–10 keV) | F-test | |||||
|---|---|---|---|---|---|---|---|---|
| Date | () | () | ( erg cm-2 s-1) | prob. | ||||
| Chandra | Aug. 2000 | 5.0, fixed | 2.86 | 1.33 | 0.17 | 1.34 | 0.79 (107) | |
| XMM | Feb. 2002 | 5.0, fixed | 4.18 | 2.27 | 1.99 | 4.58 | 1.06 (482) | |
| XMM | Jan. 2004 | 5.0, fixed | 4.39 | 1.62 | 0.32 | 2.07 | 1.02 (703) | |
| XMM | Aug. 2004 | 5.0, fixed | 6.11 | 1.56 | 0.27 | 2.02 | 0.92 (319) | |
| XMM | Jan. 2005 | 5.0, fixed | 1.14 | 2.08 | 0.14 | 0.75 | 1.04 (207) |
3.3 Comparison with other works
By comparing the results of Table LABEL:pow with those of Table LABEL:past we notice that the two ASCA pointings of February 1994 and 1998 detected the source at flux levels comparable to those observed by XMM-Newton in January and August 2004 (). The ASCA data were analyzed by Madejski et al. (mad96 (1996)) and Junkkarinen et al. (jun04 (2004)) with prescriptions for absorption similar to ours, hence the results can easily be compared, highlighting how the source can exhibit noticeable spectral variations (from to ) at the same brightness level.
A previous analysis of the August 2000 Chandra observation was published by Turnshek et al. (tur03 (2003)). The interest of these authors was to study the metallicity of the intervening DLA system at . They fit the Chandra spectrum with a power law in the 2–8 keV energy range, where absorption is expected not to affect the continuum flux, in order to fix both the slope and normalization of the X-ray spectrum. A best-fit photon index was found. They adopted a Galactic H i column density of after Hartmann & Burton (har97 (1997)) and a value of for the absorber, which was derived from a fit of the Ly absorption line in the February 1998 HST spectrum. Then they tried different prescriptions for the metal content of both the Galaxy and DLA system, finding a range of possible metallicity for this latter of 10–40% of the solar one. The results of Turnshek et al. (tur03 (2003)) are in fair agreement with those we found by applying a similar model (single power law with , see Table LABEL:pow).
Foschini et al. (fos06 (2006)) analysed the data of the XMM-Newton observation of February 2002. When fitting a single power law with Galactic absorption in the 1–10 keV energy range, they obtained , roughly consistent with the results reported in Table LABEL:pow.
3.4 Iron lines
The detection of K iron fluorescent emission lines in AGN X-ray spectra is a very important and unique tool to study the immediate vicinity of the supermassive black hole which most likely is the central engine of the AGN itself (see e.g. the review papers by Fabian et al. fab00 (2000) and Reynolds & Nowak rey03 (2003)). Up to now, K iron fluorescent lines have been detected in several Seyfert galaxies (see the above reviews and references therein) and in some radio galaxies (e.g. Eracleous et al. era00 (2000)). As far as we are aware, among blazars, only 3C 273 has shown this line in its X-ray spectrum (e.g. Yaqoob & Serlemitsos yaq00 (2000)), and it has been never seen in BL Lac objects, except for the possible case of S5 0716+71 (Kadler et al. kad05a (2005)). If BL Lac objects have an accretion disc surrounded by a hot corona and if this disc is cold enough to allow the emission of Fe K fluorescent line, then this line could be hidden by the beamed X-ray continuum of the jet (of synchrotron or inverse-Compton nature), just like the softer (IR-to-UV) emission lines are swamped by the corresponding jet continuum. Alternatively, the disc in BL Lacs, if any, could be hot, or optically thin, or highly ionized, thus not producing the K feature.
AO 0235+16 has been classified as a BL Lac object. However, it has shown both narrow and broad emission lines in its optical spectrum (Cohen et al. coh87 (1987); Nilsson et al. nil96 (1996); Raiteri et al. rai06 (2006)), in particular a prominent Mg ii broad line. These features are obviously better seen when the optical continuum from the jet is lower. The four X-ray spectra taken with Chandra in 2000 and with XMM-Newton in 2004–2005 show the source in a very faint X-ray state. In both the Chandra and the August 2004 XMM-Newton spectra (see Figs. 1 and 4) a possible emission feature is present around 2.8 keV (and a more marginal one around 3.1 keV). By adding a Gaussian line of 0.1 keV width in the energy interval 2.7–3.2 keV to Model 1 (case with ), the best fit is reached when the line is at 2.8 keV and implies some improvement of : for the Chandra observation, and 2.25 in the case of the August 2004 XMM-Newton one. The corresponding equivalent widths are eV and eV, respectively, but with large uncertainties. Consequently, we can only say that a line may be present in these two observations, with EW less than eV and eV, respectively. This possible emission line in the source frame would have an energy of about 5.4 keV, a bit far from the rest-frame energy of 6.40 keV of the cold Fe K fluorescent line. However, it is well known that, if the iron lines are produced in the inner accretion disc, they are affected from both Doppler and gravitational relativistic effects. Indeed, although they are intrinsically narrow, they can be broadened and skewed by the large orbital velocities of the accreting material, and redshifted by the strong gravitation field of the black hole. In fact, iron lines have been detected peaking at energies from 6–7 keV down to well below 6 keV in the source frame, also with a variety of shapes and widths (see the review by Fabian et al. fab00 (2000) and references therein). Even in the same source, the detected line can show dramatic changes in flux, profile, and redshift with time, as in the emblematic case of the Seyfert 1 galaxy MCG -30-15 (e.g. Iwasawa et al. iwa96 (1996)).
4 Ultraviolet to X-ray spectral energy distribution
Besides the X-ray detectors, the XMM-Newton satellite also carries an Optical Monitor (OM), which allows to obtain photometric data in the optical , , and ultraviolet UV, UV, UV bands simultaneously with the X-ray observations. Optical and UV grisms are also available.
The optical and ultraviolet emission from AO 0235+16 is contaminated by the emission of ELISA, the AGN which is located only about 2 arcsec southward of the source. The ELISA contribution becomes more important as long as AO 0235+16 gets fainter, and as long as higher frequencies are considered (see discussion in Raiteri et al. rai05 (2005)). The XMM-Newton source magnitudes listed in the OM pipeline products are obtained by performing aperture photometry with a 12 pixel (about 5.7 arcsec) aperture radius, so that they include the contribution of ELISA. In order to measure the magnitude of AO 0235+16 avoiding the southern AGN contamination, we analysed the OM images by following the same procedure adopted in Raiteri et al. (rai05 (2005)), i.e. by using the IRAF routine phot with an aperture radius of 2 pixels. We performed differential photometry with respect to Stars 1, 2, 3 (Smith et al. smi85 (1985)), and 6 (Fiorucci et al. fio98 (1998)), using for these stars the standard magnitudes listed in the pipeline products. The source magnitude was derived by averaging the four values obtained with respect to the reference stars. Table 8 reports the inferred optical–UV magnitudes of AO 0235+16 during the XMM-Newton pointings.
| Date | UV | UV | |||
|---|---|---|---|---|---|
| Feb. 10, 2002 | 17.78 (0.06) | ||||
| Jan. 18–19, 2004a | 19.22 (0.07) | 20.09 (0.07) | 20.12 (0.10) | 19.95 (0.11) | 19.68 (0.22) |
| Aug. 02, 2004 | 19.60 (0.08) | 19.97 (0.13) | 19.80 (0.27) | ||
| Jan. 28, 2005 | 20.24 (0.11) | 20.24 (0.13) | 19.90 (0.20) | ||
| a from Raiteri et al. (rai05 (2005)) | |||||
The ultraviolet to X-ray spectral energy distributions are shown in Fig. 11. The OM magnitudes of Table 8 have been dereddened according to Junkkarinen et al. (jun04 (2004)), using the extinction values listed in Table 5, Col. 5 of Raiteri et al. (rai05 (2005)). Then the OM fluxes have been obtained with respect to Vega. Notice that in Fig. 11 we have lowered the UV flux by 10% to take into account the fact that at this frequency the Junkkarinen et al. (jun04 (2004)) prescriptions overestimate the extinction. The X-ray spectra are shown according to Model 5 (double power law), the spectrum thickness representing the standard deviation of the data from the model fit, which is for the Chandra pointing of August 2000, and , and 0.065 for the XMM-Newton pointings of February 2002, January 2004, August 2004, and January 2005, respectively.
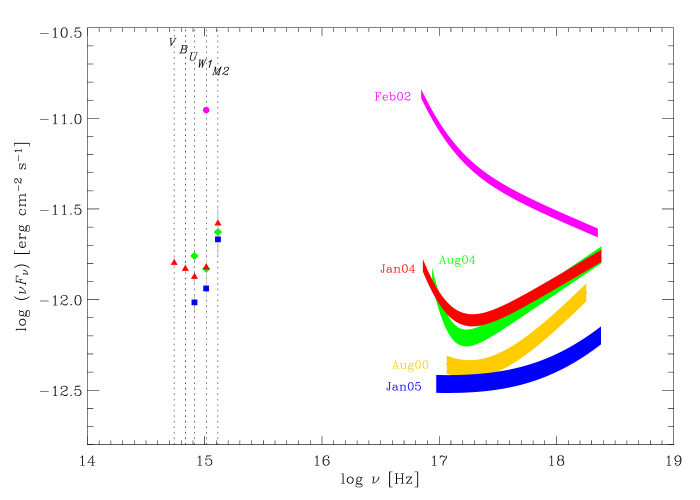
One can see how the optical–UV state is higher when the X-ray state is higher. Moreover, the January and August 2004 data show how the steep optical spectrum has a minimum in the –UV frequency range and then the spectrum becomes hard in the UV band, which is also confirmed by the January 2005 data. In other words, the OM data indicate that, besides the expected synchrotron peak likely falling in the infrared band, the SED also presents a UV–soft-X-ray bump.
The existence of a UV–soft-X-ray bump further justifies the search for a curvature in the X-ray spectrum, and the preference given to the double power law model.
5 Interpretation of the UV–soft-X-ray bump
The existence of an SED extra-component in the UV–soft-X-ray energy range has already been noticed by Junkkarinen et al. (jun04 (2004)) when analysing the February 1998 ASCA spectrum together with a contemporaneous optical–UV HST spectrum, and by Raiteri et al. (rai05 (2005)), when considering the January 2004 XMM-Newton data in conjunction with simultaneous optical data acquired at the 2.56 m Nordic Optical Telescope in the ambit of the WEBT campaign. Even if Junkkarinen et al. (jun04 (2004)) warned that it could arise from a different behaviour of extinction in the DLA intervening system with respect to the predicted one, we think that the XMM-Newton UV and X-ray observations indicate that the existence of a real bump must be considered.
This bump recalls the “big blue bump” found in the SEDs of many AGNs, and which is usually ascribed to thermal emission from the accretion disc feeding the supermassive black hole, even if accretion disc models generally predict a lower flux in the bump tails (see e.g. Krolik kro99 (1999), and Blaes et al. bla01 (2001) for the specific case of the blazar 3C 273). It is thus interesting to see whether a disc model could explain the bump we see in the SED of AO 0235+16. By looking at Fig. 11 one can infer that this bump would likely peak at , which implies a peak luminosity if we assume a flat cosmology with and , leading to a source distance . The peak frequency would likely be in the range –16, which in the source rest frame translates into – Hz. According to the non-LTE disc models computed by Hubeny et al. (hub00 (2000)) the above requirements can be met only in case of a rather massive central black hole () and a high mass accretion rate ().
The lack of optical–UV spectral information during the XMM-Newton pointing of February 2002 does not allow to state that the UV–soft-X-ray bump is a strongly variable component. In any case, a variable bump could be obtained in the accretion disc scenario with changes of the model parameters, for instance the accretion rate. A more detailed comparison between the observed SEDs and the accretion disc models is beyond the aim of the present paper; for the moment we can say that we cannot rule out that the UV–soft-X-ray bump we observe in the AO 0235+16 SEDs is due to thermal emission from an accretion disc. The Fe K emission line tentatively detected in the X-ray spectra would be a signature of this accretion disc.
But other scenarios are also possible. In a recent paper Ostorero et al. (ost04 (2004)) showed how a bump in the UV–soft-X-ray region can be obtained in the ambit of a rotating helical jet model (Villata & Raiteri vil99 (1999)), by admitting a synchrotron contribution to the soft X-ray radiation. This contribution would come from the first part of the inner emitting jet, while the major synchrotron emission at the lower frequencies comes from just outside. This is a possible picture for the explanation of the UV–soft-X-ray bump suggested by the XMM-Newton observations. We could add that, since the “observed” bump seems to be more pronounced than that predicted by Ostorero et al. (ost04 (2004)), in the framework of the helical jet model the two synchrotron components in the SED would come from regions separated by a sudden variation of opacity. A similar interpretation was suggested by Raiteri & Villata (rai03 (2003)) to explain the SED discontinuity of Mkn 501.
Furthermore, the existence of an additional SED component besides the classical synchrotron and inverse-Compton ones has recently been postulated for BL Lacertae. Indeed, when constructing the SED of BL Lac during the BeppoSAX observation of October–November 2000 with radio data and optical data taken by the WEBT collaboration (Villata et al. vil02 (2002)), Ravasio et al. (rav03 (2003)) found a misalignment of the soft X-ray spectrum with respect to the extrapolation of the optical one. Even if according to Böttcher & Reimer (boe04 (2004)) this misalignment may be due to the time averaging performed, it is interesting here to briefly recall the four different hypotheses discussed by Ravasio et al. (rav03 (2003)) to explain this feature: 1) a higher than Galactic dust-to-gas ratio towards the source (in the BL Lac case there is no intervening system); 2) the detection of bulk Compton emission, i.e. radiation produced by inverse-Compton scattering of UV photons from the disc and the broad-line region off “cold” electrons; 3) the presence of two synchrotron emitting regions at different distances from the nucleus; 4) the detection of a Klein-Nishina effect on the synchrotron spectrum.
A problem in modelling the absorption towards the source, similarly to explanation number 1) for BL Lac, cannot be strictly ruled out also for AO 0235+16 (see Junkkarinen et al. jun04 (2004)). Explanation 2), which requires rather ad-hoc conditions, seems unlikely for AO 0235+16, for which the very high bulk Lorentz factor would push the inverse-Compton emission at too high energies. Explanation 3) is similar to the one we favour, while explanation 4), which is further discussed by Moderski et al. (mod05 (2005)), is also a possible alternative interpretation.
6 X-ray light curves
As mentioned in the Introduction, AO 0235+16 has shown IDV at various frequencies. During each of the satellite pointings presented in this paper, we searched for possible rapid variations of the X-ray flux.
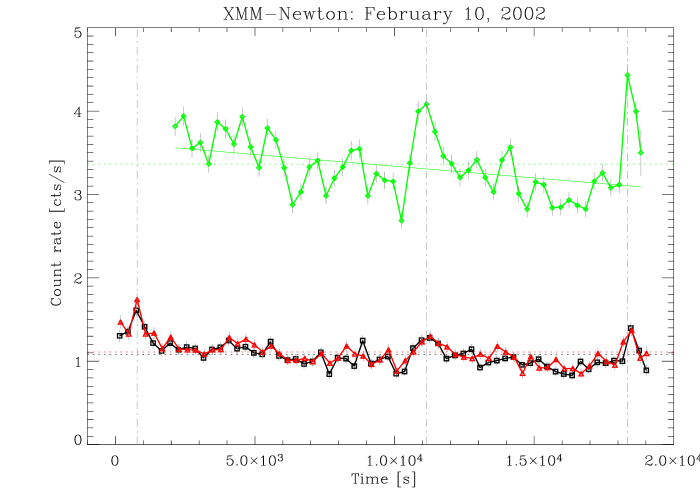
Light curves of the source were extracted from the same regions where source spectra were taken, and preliminarily binned in 1 s intervals. Only bins belonging to the good time intervals selected during the filtering of high background periods were maintained and a second binning of 300 s was performed in order to increase the signal to noise ratio. These binned light curves are shown in Figs. 12–16. For the XMM-Newton observations black squares, red triangles, and green diamonds refer to the MOS1, MOS2, and pn data, respectively. Dotted lines indicate the average values, with the same colours used for the corresponding light curves.
In order to investigate the existence of a long-term trend and, at the same time, the presence of fast variations, we verify the goodness of a linear fit. In Table LABEL:lc we report, for each observation and each instrument, the mean count rate of the binned light curve, its standard deviation , the parameters of a linear fit , the corresponding goodness-of-fit, and the probability that the computed fit would have a value of or greater. If this probability is greater than 0.1, the fit is believable. In the last column we also show the mean fractional variation, which is a common parameter to characterize variability (Peterson pet01 (2001)): , where is the mean square uncertainty of the count rates.
| Detector | Prob. | ||||||
| (cts/s) | (cts/s) | ||||||
| Chandra: August 20–21, 2000 | |||||||
| ACIS-S | 0.14 | 0.02 | 0.14 | 1.00 | 0.49 | 0.00 | |
| XMM-Newton: February 10, 2002 | |||||||
| MOS1 | 1.08 | 0.15 | 1.20 | 4.26 | 0.00 | 0.13 | |
| MOS2 | 1.11 | 0.15 | 1.23 | 4.11 | 0.00 | 0.13 | |
| pn | 3.36 | 0.38 | 3.62 | 10.52 | 0.00 | 0.11 | |
| XMM-Newton: January 18–19, 2004 | |||||||
| MOS1 | 0.19 | 0.02 | 0.18 | 0.82 | 0.89 | 0.00 | |
| MOS2 | 0.20 | 0.03 | 0.20 | 1.01 | 0.46 | 0.00 | |
| pn | 0.47 | 0.05 | 0.46 | 1.15 | 0.16 | 0.03 | |
| XMM-Newton: August 2, 2004 | |||||||
| MOS1 | 0.19 | 0.03 | 0.18 | 1.01 | 0.46 | 0.04 | |
| MOS2 | 0.19 | 0.03 | 0.19 | 0.98 | 0.51 | 0.00 | |
| pn | 0.49 | 0.04 | 0.50 | 0.89 | 0.66 | 0.00 | |
| XMM-Newton: January 28, 2005 | |||||||
| MOS1 | 0.09 | 0.02 | 0.08 | 1.05 | 0.38 | 0.04 | |
| MOS2 | 0.09 | 0.02 | 0.09 | 1.23 | 0.13 | 0.07 | |
| pn | 0.22 | 0.02 | 0.21 | 0.67 | 0.97 | 0.00 | |
Figure 13 shows the light curves derived from the XMM-Newton observation of February 10, 2002. As one can see, at least three episodes of remarkable variability can be recognized in the light curves at the beginning (only MOS detectors), at about half exposure (especially in the pn detector, at about s), and at the end of the exposure. They imply variations of about 45% in the count rates on time scales min. The variability is confirmed by the high values of and null probability reported in Table LABEL:lc. Notice also the decreasing trend highlighted by the linear fit calculated on the pn data (solid green line in the figure). These results imply that there are both long-term and fast count rate changes. The pn light curve of this XMM-Newton observation has been analyzed within several energy bands between 0.3 keV and 12 keV by Kadler (kad05b (2005)). No time lags between the soft and hard energy bands could be detected down to a limit of 200 s. However, a small but significant spectral steepening with increasing flux is found from the extraction of separate spectra for the low and high states of the source emission.
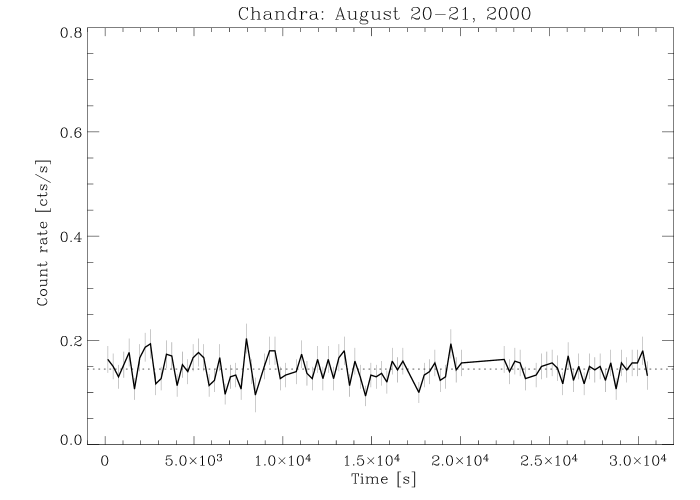
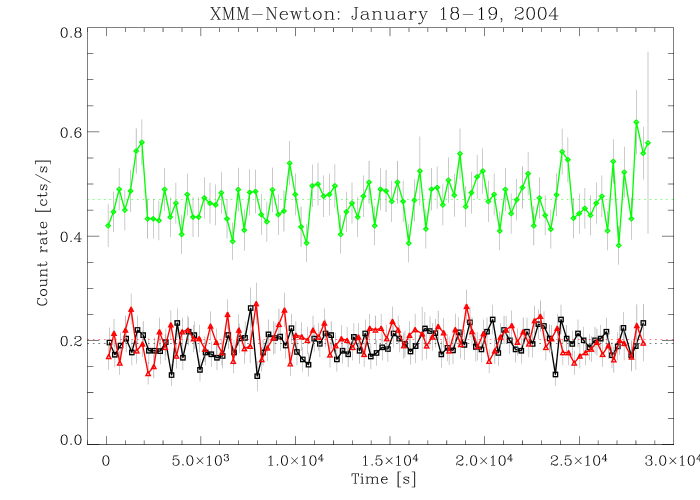
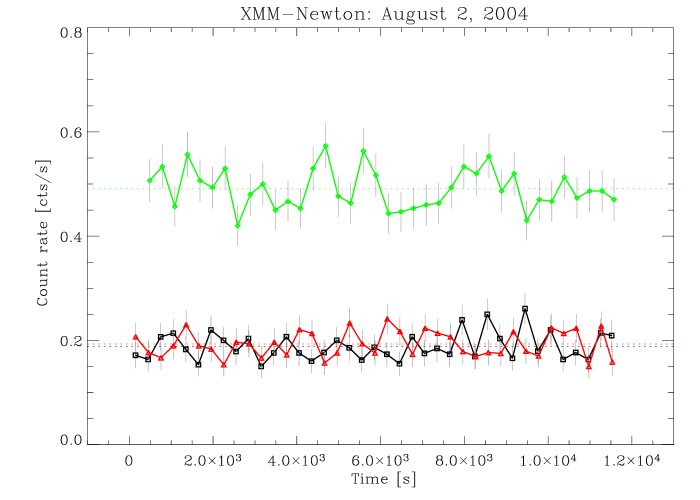
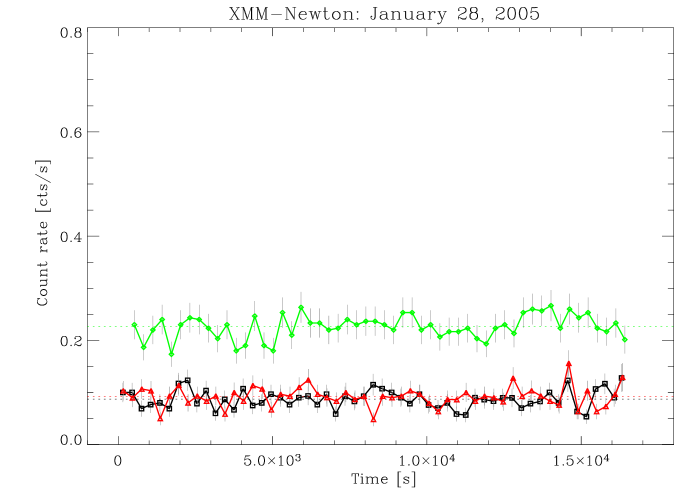
On the contrary, no significant variability has been found when analysing the X-ray light curves of the other pointings, which found the source in a much fainter state. This is already visible in Figs. 12 and 14–16, since it is not possible to recognize variations which are detected by all instruments. A confirmation comes from the statistical analysis whose results are shown in Table LABEL:lc: the best-fit line is essentially a constant coincident with the average value, indicating that there are no long-term trends. Moreover, both the low values and the probability much greater than 0.1 indicate that this constant value is a good description of the data. The picture is further confirmed by the mean fractional variation: only in the case of the February 2002 observations is greater than 10%.
7 Conclusions
We have analysed the data obtained during four XMM-Newton and one Chandra pointings of the blazar AO 0235+16 in the years 2000–2005. This analysis has carefully taken into account the contribution to both emission and absorption from the complex environment at redshift .
We have fitted the X-ray spectra with different models (single power law, logarithmic parabola, broken power law, curved model, double power law) and have found that those implying curvature seem to give a better description of the source spectra. The double power law implies pronounced spectral curvature at soft X-rays. Such curvature is not implausible, and favoured in this paper, with regard to the expected overlapping of the synchrotron (or thermal) and inverse-Compton branches of the SED in the energy range discussed here (0.3–10 keV).
We have speculated about the possible existence of a Fe K emission feature at keV in both the Chandra and August 2004 XMM-Newton spectra. If this tentative detection is real, it may suggest strong gravitational redshift effects from the inner accretion disc.
The optical–UV data from the Optical Monitor onboard XMM-Newton allow one to reconstruct the optical to X-ray SED with simultaneous data. The optical–UV brightness level is higher when the X-ray one is higher. The SED reveals a UV–soft-X-ray bump, which was previously noticed by Junkkarinen et al. (jun04 (2004)) and Raiteri et al. (rai05 (2005)). If this bump is intrinsic to the source, one possible mechanism producing this extra-component may be synchrotron emission from an inner region of the jet with respect to the region where the lower-energy synchrotron component comes from. However, thermal emission from an accretion disc, similar to the “big blue bump” observed in many AGNs, cannot be ruled out. Investigating whether this extra-component is a common feature of the blazar class and discovering the mechanism which is responsible for it are two intriguing issues which certainly deserve further multiwavelength observing efforts.
We have detected remarkable short-term variability in the X-ray light curves derived from the XMM-Newton observation of February 10, 2002, when the source was in a bright state. We noticed three episodes where the count rate changed by about 45% on a time scale of about 40 min. On the contrary, no significant variability was evident in the X-ray light curves corresponding to the other observing epochs analysed in this paper.
Acknowledgements.
C. M. R. is grateful to L. Foschini and A. Capetti for useful discussions and to B. Balmaverde for a help with CIAO. M. K. was supported for this research by the International Max Planck Research School for Radio and Infrared Astronomy, funded by the Max-Planck-Gesellschaft. This work was partly supported by the European Community’s Human Potential Programme under contract HPRN-CT-2002-00321 (ENIGMA) and by the Italian MIUR under grant Cofin 2003/2003027534_002.References
- (1) Blaes, O., Hubeny, I., Agol, E., Krolik, J.H. 2001, ApJ, 563, 560
- (2) Böttcher, M., Reimer, A. 2004, ApJ, 609, 576
- (3) Burbidge, E. M., Beaver, E. A., Cohen, R. D., et al. 1996, AJ 112, 2533
- (4) Cohen, R. D., Smith, H. E., Junkkarinen, V. T., Burbidge, E. M. 1987, ApJ, 318, 577
- (5) Comastri, A., Fossati, G., Ghisellini, G., Molendi, S. 1997, ApJ, 480, 534
- (6) Dickey, J. M., Lockman, F. J. 1990, ARA&A, 28, 215
- (7) Elvis, M., Lockman, F. J., Wilkes, B. 1989, AJ 97, 777
- (8) Eracleous, M., Sambruna, R., Mushotzky, R. F. 2000, ApJ, 537, 654
- (9) Fabian, A. C., Iwasawa, K., Reynolds, C. S., Young, A. J. 2000, PASP, 112, 1145
- (10) Fiorucci, M., Tosti, G., Rizzi, N. 1998, PASP, 110, 105
- (11) Fossati, G., Celotti, A., Chiaberge, M., et al. 2000, ApJ, 541, 166
- (12) Foschini, L., Ghisellini, G., Raiteri, C.M., et al. 2006, A&A, in press
- (13) Frey, S., Gurvits, L. I., Altschuler, D. R., et al. 2000, PASJ, 52, 975
- (14) Fujisawa, K., Kobayashi, H., Wajima, K., et al. 1999, PASJ, 51, 537
- (15) Ghosh, K. K., & Soundararajaperumal, S. 1995 ApJSS, 100, 37
- (16) Giommi, P., Capalbi, M., Fiocchi, M., et al. 2002, in Blazar Astrophysics with BeppoSAX and Other Observatories, ed. P. Giommi, E. Massaro & G. Palumbo (Frascati: ASI/ESA), 63
- (17) Hartmann, D., & Burton, W. B. 1997, Atlas of Galactic Neutral Hydrogen (Cambridge: Cambridge Univ. Press)
- (18) Heidt J., Wagner S.J., 1996, A&A 305, 42
- (19) Hubeny, I., Agol, E., Blaes, O., Krolik, J.H. 2000, ApJ, 533, 710
- (20) Iwasawa, K., Fabian, A. C., Reynolds, C. S., et al. 1996, MNRAS, 282, 1038
- (21) Jorstad, S. G., Marscher, A. P., Mattox, J. R., et al. 2001, ApJS, 134, 181
- (22) Junkkarinen, V. T., Cohen, R. D., Beaver, E. A., et al. 2004, ApJ, 614, 658
- (23) Kadler, M., Kerp, J., Krichbaum, T.P. 2005, A&A, submitted
- (24) Kadler, M. 2005, PhD thesis, Max-Planck-Institut für Radioastronomie, Bonn
- (25) Kalberla, P.M.W., Burton, W.B., Hartmann, Dap, et al. 2005, A&A, 440, 775
- (26) Kayser, R. 1988, A&A, 206, L8
- (27) Kraus, A., Quirrenbach, A., Lobanov, A .P., et al. 1999, A&A 344, 807
- (28) Kraus, A., Krichbaum, T. P., Wegner, R., et al. 2003, A&A 401, 161
- (29) Krolik, J.H. 1999, Active Galactic Nuclei: From the Central Black Hole to the Galactic Environment (Princeton: Princeton Univ. Press)
- (30) Landau, R., Golisch, B., Jones, T. J., et al. 1986, ApJ, 308, 78L
- (31) Madejski G., Takahashi T., Tashiro M., et al. 1996, ApJ, 459, 156
- (32) Moderksi, R., Sikora, M., Coppi, P. S., Aharonian, F.A. 2005, MNRAS, 363, 954
- (33) Nilsson, K., Charles, P. A., Pursimo, T., et al. 1996, A&A, 314, 754
- (34) Noble J.C., Miller H.R., 1996, PASPC 110, 30
- (35) Ostorero, L., Villata, M., Raiteri, C. M. 2004, A&A, 419, 913
- (36) Padovani, P., Costamante, L., Giommi, P., et al. 2004, MNRAS, 347, 1282
- (37) Perlman, E. S., Madejski, G., Georganopoulos, M., et al. 2005, ApJ, 625, 727
- (38) Peterson, B. M., 2001, in Advanced Lectures on the Starburst-AGN Connection, Eds.: I. Aretxaga, D. Kunth, & R. M jica, World Scientific, Singapore, p.3
- (39) Raiteri, C. M., Villata, M., Aller, H. D., et al. 2001, A&A, 377, 396
- (40) Raiteri, C. M., & Villata, M. 2003, Proc. of the First ENIGMA Meeting, held at Mayschoss, Germany, May 11-14, 2003, Eds.: M. Hauser, U. Bach, & S. Britzen, Max-Planck-Institut für Radioastronomie, Bonn, p. 326.
- (41) Raiteri, C. M., Villata, M., Ibrahimov, M. A., et al. 2005, A&A, 438, 39
- (42) Raiteri, C. M., Villata, M., et al. 2006, A&A, in preparation
- (43) Ravasio, M., Tagliaferri, G., Ghisellini, G., et al. 2003, A&A, 408, 479
- (44) Reynolds, C. S., & Nowak, M. A. 2003, Physics Reports, 377, 389
- (45) Romero G.E., Combi J.A., Benaglia P., et al., 1997, A&A 326, 77
- (46) Romero G.E., Cellone S.A., Combi J.A., 2000, A&A 360, L47
- (47) Smith, P. S., Balonek, T. J., Heckert, P. A., Elston, R., Schmidt, G. D. 1985, AJ, 90, 1184
- (48) Stickel, M., Fried, J. W., Kühr, H. 1988, A&A, 198, L13
- (49) Takalo L.O., Kidger M.R., de Diego J.A., et al., 1992, AJ 104, 40
- (50) Takalo, L. O., Sillanpää, A., Valtaoja, E., et al. 1998, A&ASS 129, 577
- (51) Tavecchio, F., Maraschi, L., Pian, E., et al. 2001, ApJ, 554, 725
- (52) Turnshek, D. A., Rao, S. M., Ptak, A. F., et al. 2003, ApJ, 590, 730
- (53) Villata, M., & Raiteri, C. M. 1999, A&A, 347, 30
- (54) Villata, M., Mattox, J. R., Massaro, E., et al. 2000, A&A, 363, 108
- (55) Villata, M., Raiteri, C. M., Kurtanidze, O. M., et al. 2002, A&A, 390, 407
- (56) Villata, M., Raiteri, C. M., Kurtanidze, O. M., et al. 2004a, A&A, 421, 103
- (57) Villata, M., Raiteri, C. M., Aller, H. D., et al. 2004b, A&A, 424, 497
- (58) Webb, J. R., Howard, E., Benítez, E., et al. 2000, AJ, 120, 41
- (59) Wilms, J., Allen, A., McCray, R. 2000, ApJ, 542, 914
- (60) Worrall, D. M., & Wilkes, B. J. 1990, ApJ, 360, 396
- (61) Yanny, B., York, D. G., Gallagher, J. S. 1989, ApJ 338, 735
- (62) Yaqoob, T., & Serlemitsos, P. 2000, ApJ, 544, L95