Constraining the GRB Collimation with a Survey for Orphan Afterglows
Gamma-ray bursts are believed to be produced in highly-relativistic collimated outflows. Support for this comes among others from the association of the times of detected breaks in the decay of afterglow light curves with the collimation angle of the jets. An alternative approach to estimate a limit on the collimation angle uses GRB afterglows without detected prompt-emission counterparts. Here we report on the analysis of a dedicated survey for the search of these orphan afterglows using the Wide Field Imager at the 2.2 m MPI/ESO telescope at La Silla, Chile. We monitored 12 deg2 in up to 25 nights typically spaced by one to two nights with a limiting magnitude of =23. Four previously unknown optical transients were discovered and three of these associated with a flare star, a cataclysmic variable and a dwarf nova. The fourth source shows indications for an extragalactic origin but the sparse sampling of the light curve prevents a reliable classification. We discuss the results in the context of the collimation of GRBs.
Key Words.:
gamma rays: bursts; surveys; Stars: variables: general1 Introduction
There is now conspicuous observational and theoretical evidence that the radiation of cosmic gamma-ray bursts (GRBs) is produced in highly relativistic collimated outflows. A jet geometry was originally invoked as a solution for the “energy crisis” by reducing the total energy output of a GRB by a factor of /4, where is the solid angle into which gamma-rays are emitted (e.g., Rhoads 1997; Fruchter et al. 1999). Evidence for the collimation was provided by the theoretically predicted (e.g., Sari 1999; Gruzinow 1999; Ghisellini & Lazzati 1999) and observed polarization evolution of optical afterglows (e.g., Covino et al. 1999; Wijers et al. 1999; Greiner et al. 2003).
Prominent signatures of the jet geometry were identified already earlier in the broad-band breaks observed in the optical and radio afterglow light curves of several long duration GRBs (e.g., Stanek et al. 1999; Harrison et al. 1999). The opening angles, which have been inferred from these “jet breaks” for a number of afterglows, vary from 1∘ to more than 25∘, with a strong concentration near 4∘ (Frail et al. 2001).
A consequence of the collimation is that the prompt -ray emission will be detected if the viewing angle of the observer is equal to or smaller than the opening angle of the jet, . This implies that only for a fraction of all bursts in the Universe -ray photons will reach the Earth. The total GRB rate will be higher than the observed rate by a factor of roughly in case of a universal jet structure, where is the bulk Lorentz factor of the ejecta. For a quasi-universal Gaussian-type jet, the rate will be generally smaller. Nevertheless, GRBs which are not pointed directly at the observer can in principle be discovered through their afterglow radiation at longer wavelengths.
In the standard internal-external fireball model (e.g. Rees & Meszaros 1992, 1994) the afterglow is produced when the initially highly relativistic ejecta plows into the ambient medium. The afterglow emission is radiated into a solid angle of 1/, along the line of motion. When the jet decelerates, increases until it reaches 4. Therefore, so-called “off-axis” orphan afterglows can be detected for bursts which are beamed outside of the field of view of the observer (e.g., Rhoads 1997; Perna & Loeb 1998; Dalal et al. 2002). The light curves of these off-axis orphan afterglows will initally be faint, brightening up to a viewing angle dependent maximum and become similar to regular GRB afterglows after the jet break later on (Rhoads 1999; Nakar & Piran 2003).
It is theoretically reasonable to assume that the optical afterglow might be emitted from a slower moving material (a lower ) than the initial -ray beam. Therefore, so-called “on-axis” orphan afterglows are expected when the narrow -ray emission misses the observer by a small amount but the wider optical emission region falls within the observation cone (Nakar & Piran 2003). These afterglows will exhibit similar light curves as regular afterglows with detected prompt emission.
Observations of orphan afterglows can help to study the initial opening angle of the jets and to place a constraint on the collimation of the optical afterglow emission (Rhoads 1997). Especially on-axis orphans are suitable as they are substantially brighter than off-axis orphans and thus easier to detect in a dedicated survey (Nakar & Piran 2003). Additionally, Dalal et al. (2002) pointed out, assuming an uniform jet with constant jet-break time and luminosity at the break time for an on-axis observer, that for small angles the afterglow effective beaming angle scales with the jet opening angle. Therefore, the number of detectable off-axis orphan afterglows would be independent of the jet opening angle and similar for moderately wide jets (20 ∘) and for arbitrarily narrow jets (0.01 ∘). In contrast, Totani & Panaitescu (2002) predict a strong dependence of the orphan rate on the jet opening angle assuming a constant total energy in the afterglow jet.
A small number of surveys dedicated to the search of untriggered optical GRB counterparts were performed over the past years. No candidate event was found in 125 hrs monitoring of a field of 256 deg2 with ROTSE-I to a limiting magnitude of 15.7 (Kehoe et al. 2002). Vanden Berk et al. (2002) searched for color-selected transients within 1500 deg2 of the Sloan Digital Sky Survey (SDSS) down to R=19 and found only one unusual transient which was later identified as a radio-loud AGN exhibiting strong variability (Gal-Yam et al. 2002). The automated RAPTOR wide-field sky monitoring system allows to image 1300 deg2 at a time down to a magnitude of 12.5 (Vestrand et al. 2004). A couple of interesting optical transients were found in the , and -band Deep Lens Survey transient search, within an area of 0.01 deg2 yr with a limiting magnitude of 24. None of those could be positively associated with a GRB afterglow (Becker et al. 2004). Recently, Rykoff et al. (2005) performed a search using the ROTSE-III telescope array without detecting any candidate afterglow events. They placed an upper limit on the rate of fading optical transients with quiescent counterparts dimmer than 20th magnitude of less than 1.9 deg-2 yr-1.
In this paper we present the results of a survey for optical orphan afterglows with a wide-field imaging instrument and will give an estimate of the GRB collimation derived from the detection rate of on-axis orphan afterglows. The paper is structured as follows. In Sect. 2 we describe the observational strategy, instrumentation and selected survey fields as well as the data reduction and transient detection method. The candidate transients are presented in Sect. 3 and the transient detection efficiency in Sect. 4. A discussion of the results in the context of GRB collimation is given in Sect. 5.
2 Observations and Data Reduction
2.1 Strategy, Instrumentation & Survey Fields
A search for GRB afterglows or other transient phenomena in the sky requires a thorough strategy due to the random occurence of the events in space and time. As a continuous monitoring of a large field with a large aperture telescope could only be considered overambitious in many cases, we developed our strategy using the knowledge of the properties of observed optical afterglows at the time when the survey was proposed (1999).
The primary idea was to take multiple deep observations of a number of selected sky fields. The observing scheme was chosen such that the survey would be sensitive enough (23 mag) to provide the detection of a GRB orphan afterglow in at least two epochs together with earlier and later upper limits. To combine the availability of a large aperture telescope together with the observed brightness decay of GRB afterglows, we decided to perform consecutive observations of a given field in every 2nd night. Over this time span, on-axis orphan afterglows will in most cases be brighter than =21. Instead, off-axis orphans are expected to be fainter and will start to dominate below that magnitude (Nakar & Piran 2003).
We obtained imaging data during three periods (May-June, August & September-October) in 1999 and monitored 7 different sky fields in up to 25 nights each. Each field is composed of 2 to 8 separate sub-fields and a total of 38 sub-fields were selected. This corresponds to an area of 12 square degrees being imaged throughout the campaign. A list of all fields together with the number of sub-fields and the maximum number of observing nights is provided in Table 1. Note that due to changes of the observing conditions during a night not always a complete monitoring of a given field could be accomplished.
A total of 39 nights were scheduled using the Wide Field Imager (WFI) at the MPI/ESO 2.2 m telescope in La Silla, Chile. Due to weather constraints only 31 nights could at least partly be used for observations. Unfortunately, the lost nights caused unfavorable interruptions of the otherwise gap-less observing schedule of each period and lead to a significantly decreased detection sensitivity for orphan afterglows.
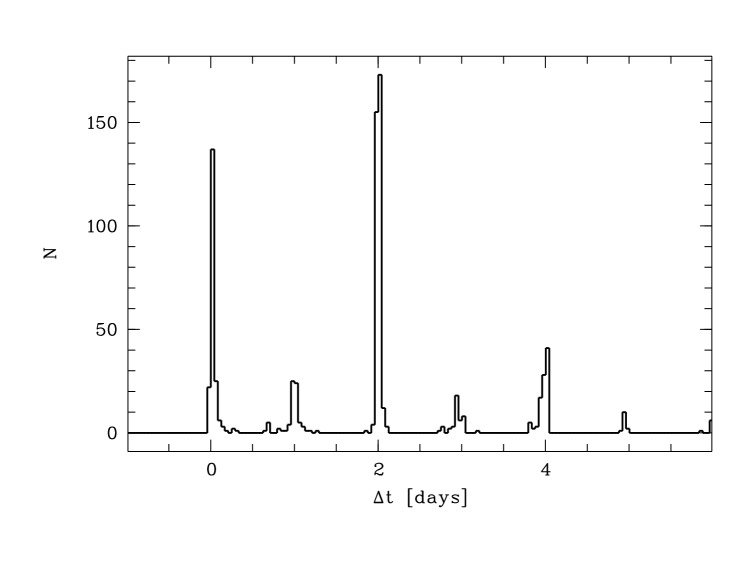
The distribution of the time delay between two consecutive observations of a given sub-field is shown in Figure 1. While the majority of the survey could be observed with the proposed gap of two days between consecutive observations, 15 % suffered from larger gaps due to inappropriate weather conditions. In addition to the regular 2-day schedule a small number of nights were included in which multiple observations of selected fields (F1, F3 & F5) were performed within one night. This would allow to identify and distinguish possible short-term variable sources (e.g. CVs) in these fields.
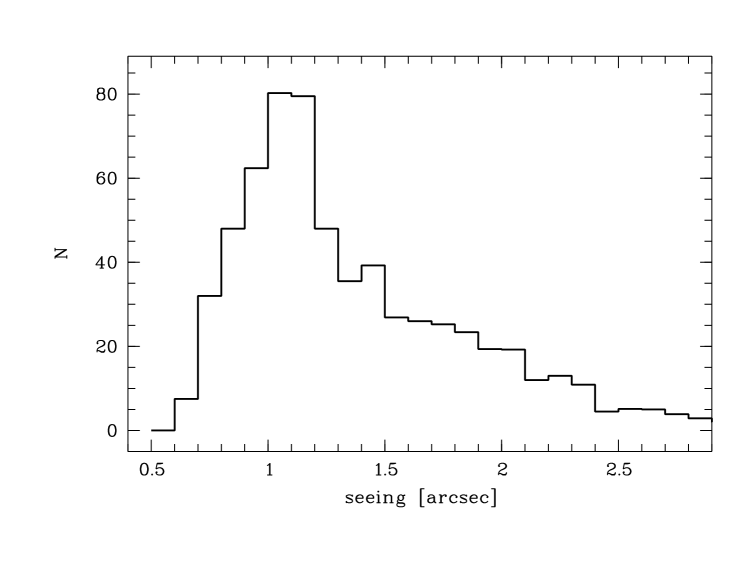
The photometry was taken with WFI mainly in the -band together with a small number of pointings performed using the and -band filters. The typical exposure time was 420 s per pointing. The instrument consists of a mosaic of 42 CCDs each 20464128 pixel in size which, together with the plate scale of 0.238 arcsec/pixel, provided a sky coverage of per image. A gap of 2 arcsec exists between neighboring CCDs of the imager. Throughout the data acquisition the observing conditions varied strongly (see Figure 2). The majority of the data were taken at a seeing of 1” but a small fraction of the observations suffered from significantly worse seeing. Due to the low limiting magnitude and the loss of all but the brightest sources we neglected date taken under seeing conditions above 24 (10 pixel FWHM). This corresponds to an additional loss of 10 % of the campaign data.
The selection of the fields was more or less random with respect to the search for orphan afterglows with the exception of the field F6. This field is centered on Selected Areas 113 and includes a number of Landoldt standard stars which allow an absolute photometric calibration of the survey (Landoldt 1992; see below). F6, together with a second field (F4), is also covered by the SDSS111 http://www.sdss.org/. This provided us with the opportunity to identify possible transient sources in these fields down to 22 mag using the SDSS multi-band informations. Particular care was taken to avoid stars brighter then 12th magnitude which would not only saturate the detector but also leave effected pixels less sensitive for subsequent images. Furthermore, high ecliptic lattitudes were favored to maximize the Moon distance, and thus make the fields observable over a large fraction of an observing period. Finally, significant foreground extinction was avoided during the field selection.
| Field | RA(2000) | Dec(2000) | sub-fields | # of nights |
|---|---|---|---|---|
| F1 | 01h32m | –43∘12′ | 4 | 15 |
| F2 | 03h33m | –27∘37′ | 4 | 12 |
| F3 | 13h28m | –21∘40′ | 8 | 11 |
| F4 | 16h20m | +04∘00′ | 8 | 12 |
| F5 | 21h26m | –43∘22′ | 8 | 23 |
| F6 | 21h41m | +00∘30′ | 2 | 25 |
| F7 | 21h52m | –27∘32′ | 4 | 21 |
2.2 Data Reduction
Nearly 700 images were obtained throughout the survey comprising 130 GB of raw data. For the automatic reduction and analysis of this large amount of data a Perl-based pipeline was developed which uses a number of well tested astronomical software packages. The basic image reduction was performed using IRAF222IRAF is distributed by the National Optical Astronomy Observatories, which are operated by the Association of Universities for Research in Astronomy, Inc., under cooperative agreement with the National Science Foundation./MSCRED. For each night of observations a common bias frame was produced and subtracted from the science images. Flat field correction was performed using daily super-sky-flats produced from all science observations of a given night without significant illumination by the Moon or other bright sources.
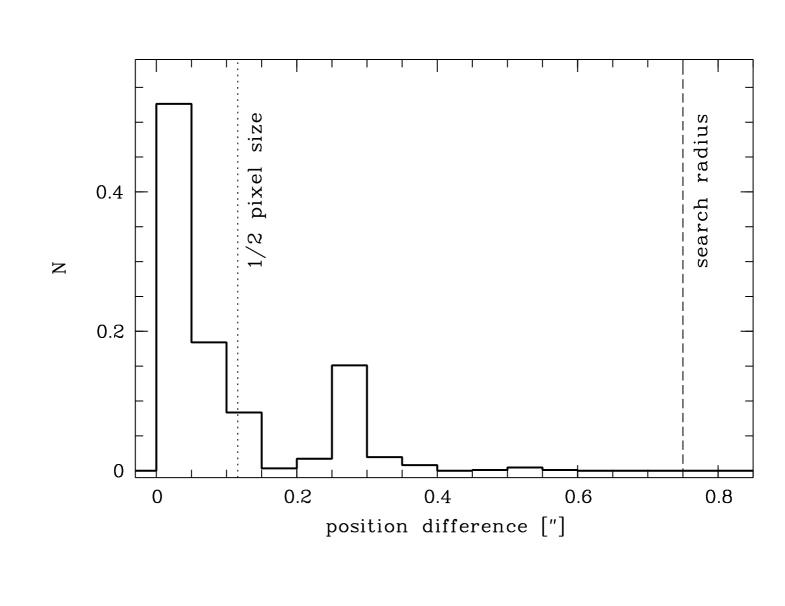
The astrometric solutions were obtained separately for each of the 8 CCDs with the WIFIX/ASTROMETRIX333http://www.na.astro.it/radovich/wifix.htm package by comparing the positions of detected sources with those compiled in the USNO-A2.0 catalog (Monet et al. 1998). The resulting astrometric precision is indicated in Figure 3 where the difference in the position of isolated sources detected in a sub-field of F6 in multiple observations is shown. About 80 % of the sources lie within 1/2 detector pixel (0119) compared to a reference observation taken on May 31, 1999. More than 99 % of the sources are detected within a circle of 04 radius. Note that the double peaked shape of the distribution in Figure 3 is artificial, resulting from the numerical rounding of the pixel coordinates in the source detection algorithm.
The source detection in the images was performed in each of the 8 WFI CCDs separately. We used the IRAF/DAOPHOT package to measure the source flux inside a Gaussian-shaped point-spread-function. The search for transient sources does not gain significant benefit from an absolut photometric calibration which would be connected with an unavoidable additional systematic zero-point uncertainty. Instead, we obtained the variability information using the technique of differential photometry. We selected an ensemble of at least 20 local, non-saturated, non-variable reference stars for each sub-field. By deriving the median brightness offset of these stars with respect to the brightness of the same stars obtained in a reference image of a given sub-field (typically the one with the smallest seeing), the photometric offset between the two observations could be estimated. This was successively done for all observations of a given sub-field and thus provided a common photometric zero-point for all pointings of the respective sub-field.
Absolut photometric calibration was obtained based on observations in one photometric night (October 12, 1999) of the field SA113 (our F6). This field contains a number of Landoldt standard stars with well tabulated optical photometry (Landoldt 1992)555The tabulated Cousin -band magnitudes were transformed to the WFI -band filter system using the colour and extinction terms given at 444http://www.ls.eso.org/lasilla/Telescopes/2p2T/E2p2M/WFI/zeropoints/.. As all photometric standard stars were saturated in the regular 420 s image taken for our survey, we obtained a shorter exposure (20 s) during the same night. In this 20 s frame six non-saturated standard stars were contained and the photometric zero point for this image was obtained (systematic uncertainty of =0.1 mag). This allowed to produce a sample of secondary standard stars in the field down to a limiting magnitude of 21 corresponding to a 5 detection.
The field F6 was observed in nearly all nights of the survey. This allowed to obtain accurate photometric calibration for the other six fields based on the zero points derived from the secondary standards in F6 in a common night. For each field one photometric night was chosen and the photometric calibration of all further observations were calibrated with respect to this night. The photometry in all fields was additionally corrected for Galactic foreground extinction (=0.02–0.25) (Schlegel et al. 1998).
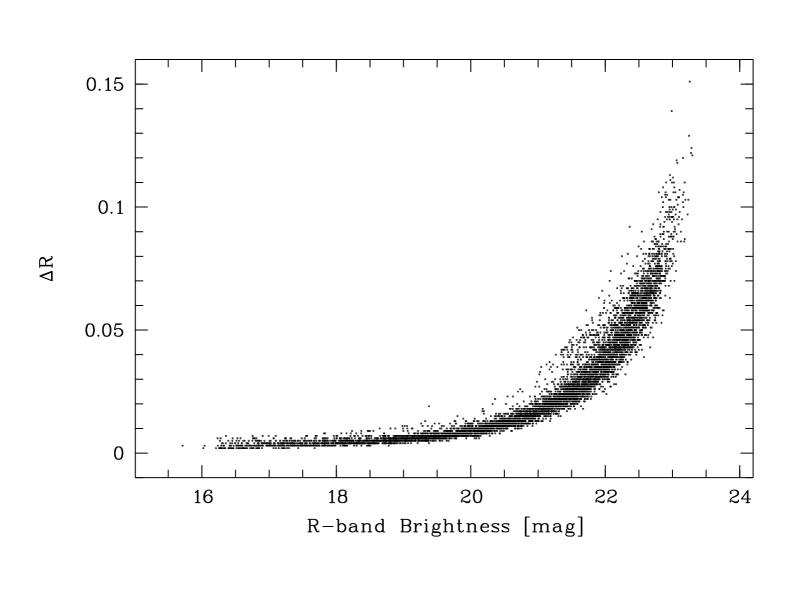
Figure 4 shows the resulting photometric quality for an example field (F4) obtained under good seeing conditions (08). The uncertainties represent the detection uncertainties in the instrumental magnitude system and do not include the uncertainties resulting from the absolute photometric calibration (0.1 mag). A limiting magnitude of 23 at 10 was reached in this observation. As discussed above, the observing conditions varied strongly throughout the survey. Thus, the achieved limiting magnitude ranged between 19 and 23, depending on the seeing and Moon illumination. Sources brighter than 16 were saturated in a good night.
2.3 Transient Detection Method
For each of the seven fields a master table including the coordinates and magnitudes of all detected sources in all observations was produced. Herein, we assigned detections within a distance of 075 to a detection obtained in a reference image together and consider this as one source.
Light curves were obtained for all detected sources and candidate transient objects were selected based on the deviation of their light curve from their mean light curve. For all candidates with single detections or 0.75 mag (12000), light curve plots as well as thumbnail images of all pointings were produced. These were examined by eye in order to remove spurious transients arising from nearby bright stars, extended objects, stray light effects at the edge of the FoV, bad focus or detections which were consistent with faint stars at the limiting magnitude of the individual pointings. The strategy of the survey was aimed to catch a possible orphan afterglow in at least two consecutive observations. Therefore, we considered only sources with at minimum two detections for further investigations. A number of fast moving objects (e.g. air planes, terrestrial satellites) could be identified by the trace in the images which they left during the 420 s exposure. Solar system objects (e.g. asteroids) are especially abundant in the survey fields located close to the ecliptic plane (F3, F6 & F7). These sources appear either as one-time detections or show significant motion between subsequent observations and could be identified accordingly. Of the 12000 candidates only four remained and were double checked with the positions of known sources compiled in the SIMBAD666http://simbad.u-strasbg.fr/, NED777http://nedwww.ipac.caltech.edu/ and NSV888http://heasarc.gsfc.nasa.gov/W3Browse/all/gcvsnsvars.html databases and if possible correlated with the SDSS 4th release and the DSS999http://archive.stsci.edu/cgi-bin/dss_form.
3 Results
3.1 Candidate Transients
Throughout the survey four new transient sources with detections in at least two images were found. Based on the shape of the light curve and amplitude we identified one candidate cataclysmic variable, one dwarf nova, one flare star and one candidate extragalactic transient superimposed on an underlying faint object. For the latter an orphan afterglow nature is considered plausible. Below we give a brief description of each of these four transient sources (see also Table 2).
| Name | Brightness [mag] | Putative | |
|---|---|---|---|
| min | max | classification | |
| J132653.8-212702 | 20.30.1 | 19.50.1 | CV, eclip. binary |
| J132813.7-214237 | 21.30.1 | 19.90.1 | extragalactic |
| J161953.3+031909 | 19.90.1 | 17.50.1 | dwarf nova |
| J215406.6-274226 | 22.50.2 | 20.00.1 | flare star |
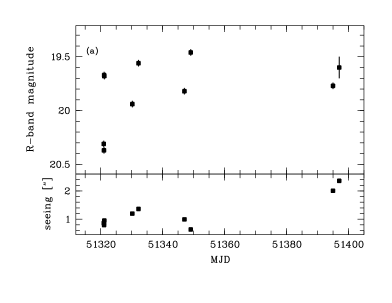
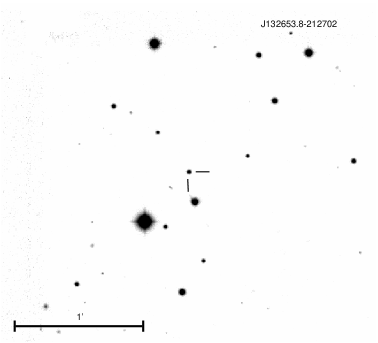
3.1.1 J132653.8-212702
The source was initially detected in F3 during the first night of observations on May 22, 1999 (MJD 51321.0045). The field was observed four times during that night and the source exhibited a significant brightness increase from =20.4 to =19.7 within 80 min (Fig. 5a). It was observed again on May 31/June 2, June 17/19 and August 4/6 and showed a flaring of =0.2–0.4 mag during each of these epochs. No X-ray or optical counterpart was detected in the ROSAT All-Sky survey (taken 1990). No entry was found in SIMBAD or NED. The rapid variability excludes slowly varying objects and is consistent with a cataclysmic variable and/or eclipsing binary. No orbital period could be obtained due to the sparse sampling of the light curve. The confirmation of the nature of this source requires further monitoring of the variability or simultaenous observations in multiple colours.
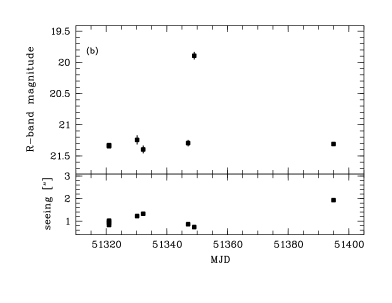
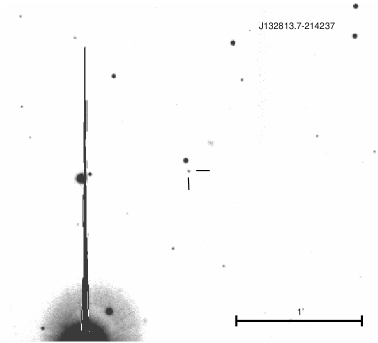
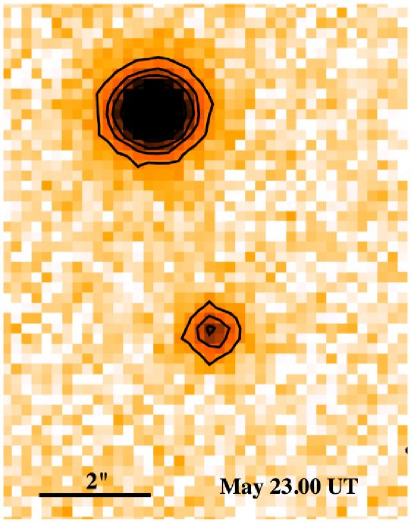
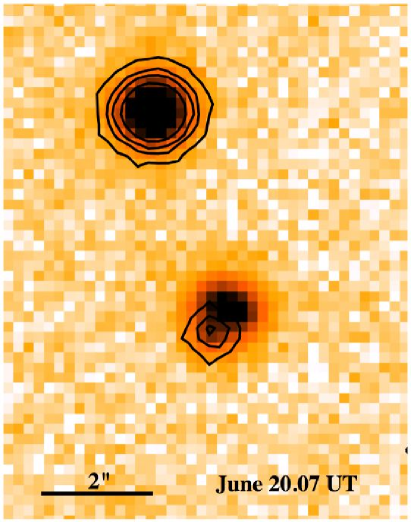
3.1.2 J132813.7-214237
The source was detected on June 20.07 UT 1999 (MJD 51349.0430) at its maximum brightness of =19.9 (Fig. 5b). Unfortunately, the observing period finished after the observation of the outburst and the next -band pointing was performed more than six weeks later on August 04. Thus, a decay of the source could not be monitored. A faint (=21.3) persistent point source was found at the position of the transient in images taken before and after the outburst. The ROSAT All-sky survey did not show a source at the position of J132813.7-214237 at 3 flux upper limit of 5.510-13 erg cm-2 s-1. Similarly, no counterpart was found in the SIMBAD and NED databases. The object is visible near the limiting magnitude of the DSS in the and -band and not detected in the DSS -band. A detailed analysis revealed that the transient source was offset by 08 from the position of the persistent counterpart (Fig. 7). This might suggest an extragalactic origin of the transient assuming the persistent counterpart can be associated with a candidate host galaxy. Nevertheless, this vague assumption based on the available observational data requires a confirmation by an accurate distance measurement.
The lacking observational coverage of the decay light curve of J132813.7-214237 leaves the identification of the origin of the source an open question. Assuming the extraggalactic nature of the faint persistent source, the flaring source could, for instance, be associated with a supernova explosion occuring in this galaxy. The brightening of 1.5 mag in 2 days is very steep compared to observed supernovae though (Leibundgut et al. 1991). Another explanation is that of a foreground flare star close to the line of sight towards the persistent background source. Furthermore, J132813.7-214237 might be a potential orphan afterglow. In order to test this hypothesis we searched for triggered GRBs which occurred during the time between the preceding observation (June 18.05 UT) and the outburst. We found 5 cataloged101010http://grbcat.gsfc.nasa.gov/grbcat/grbcat.html GRBs during this period (BATSE #7609 & 7610 and IPN #2066, 2067 & 2069; K.Hurley, private communication). None of those has a position consistent with J132813.7-214237 which allows to exclude an association with a triggered GRB. Regardless, J132813.7-214237 can also be due to an untriggered or orphan afterglow and is the best such candidate found during our survey.
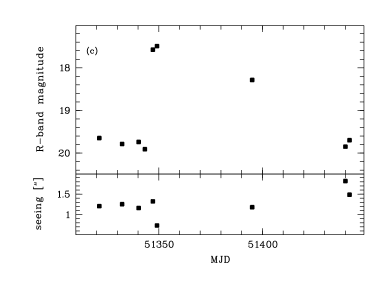
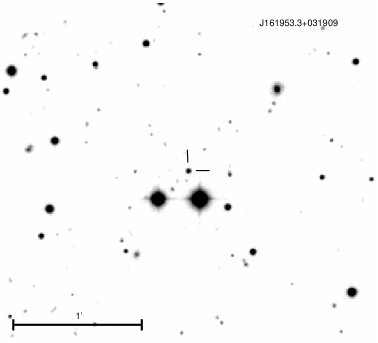
3.1.3 J161953.3+031909
This candidate was detected as a constant source (=19.9) during the first four observations of the field F4 in May and June 1999 and exhibited a sudden brightening by =2.4 mag between the pointings on June 14.29 UT (MJD 51343.2950 ) and June 17.14 UT (Fig. 5c). The following observation on June 19.15 UT showed the source unchanged and later observations indicate a subsequent decay over 50–90 days back to the quiescent brightness. The optical light curve suggests the classification of J161953.3+031909 as a dwarf nova. This is strengthened by the detection of a faint X-ray source in the ROSAT all-sky survey. During an exposure of 320 sec on August 12/13, 1990 a total of 9 source photons were detected, corresponding to a mean vignetting-corrected count rate of 0.033 cts s-1 (this is below the significance threshold of the all-sky survey catalog, so this source is not contained in the 1RXS catalog of Voges et al. 1999). Adopting a thermal bremsstrahlung model with 1 keV temperature and half of the Galactic foreground absorption, an unabsorbed flux in the 0.1-2.4 keV band of (7.01.0)10-13 erg cm-2 s-1 (or (92)10-13 erg cm-2 s-1 bolometric) is derived. Using the quiescent optical brightness, this implies a ratio of LX/Lopt = 0.6, consistent with SU UMa stars (Verbunt et al 1997). With an X-ray luminosity of 1.11032 [D/1 kpc] erg s-1, the implied distance is of order a few hundred parsec. No entry was found in the SIMBAD and NED databases.
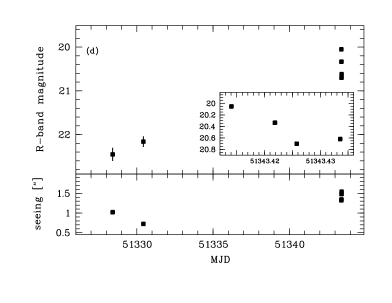
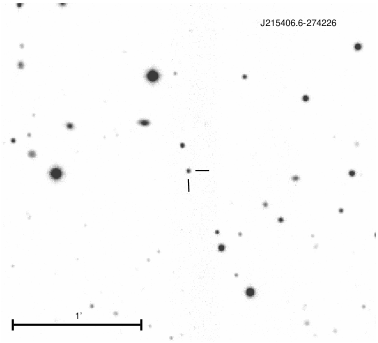
3.1.4 J215406.6-274226
This source was initially detected in two epochs of the field F7 as a faint object with =22.5 (Fig. 5d). On June 14.41 UT 1999 (MJD 51343.4150) it was found =1.9 mag brighter than previously measured. Fortunately, during this night four images of the field were taken and the rapid fading of J215406.6-274226 by =0.7 mag in around 20 min, corresponding to a decay with t-1, was discovered (inset of Fig. 5d). Unfortunately, the further fading could not be monitored as the position of the source fell into the gap between two CCDs for the following twelve pointings. While the rapid decay would be consistent with the observations of early GRB afterglows, also a flare star offers a possible explanation. Given the range of absolute magnitudes for nearby M-dwarfs of =12–16 (Reid et al. 1995) the observed quiescent brightness would place J215406.6-274226 at a distance of 0.2–1.2 kpc. No X-ray or optical counterpart was detected in the ROSAT All-Sky survey and SIMBAD or NED, respectively. No source is detected in the DSS and -band images but a faint source (7) is visible in the DSS -band. The quiescent counterpart could not be resolved and further observational effort is required for a more solid classification of the object.
4 Efficiency for Orphan Afterglow Detection
The detection efficiency for on-axis optical afterglows was estimated using a set of Monte-Carlo simulations folded with the observing schedule of the survey. We simulated afterglows with random sky coordinates, light curve parameters and explosion times distributed over the periods in which observations were taken. For all afterglows with positions inside one of the monitored fields, the expected magnitudes of the afterglows in the first and second observation of the field after the burst were calculated.
The afterglow light curves were described by a broken power law and parametrized by the pre-break slope, , break time, , post-break slope, and initial -band magnitude, . Here, the initial magnitude corresponds to the observer frame -band brightness with which an afterglow is created in the simulations. We used the parameter ranges of 38 observed optical afterglow light curves summarized in Zeh et al. (2005). A relatively flat decay plus a steeper flux decrease after the jet break is typically observed for optical afterglows associated with detected long-duration GRBs and is also expected for on-axis orphans as well as “regular” afterglows of untriggered bursts. As described earlier, off-axis orphans will show a different behavior. They are expected to be fainter than on-axis orphans at early times and follow the post-break decay of on-axis afterglows after an initial phase of re-brightening. It appears safe to assume that on-axis afterglows will be the majority at a limiting magnitude of =19–21 and off-axis orphans will dominate only at lower magnitudes (Nakar & Piran 2003). As the survey strategy foresees to consider only sources as candidate orphans with at least two detections spaced by two nights, off-axis orphans with maximum brightness of 21 will in most cases be to faint to be identified. While bright off-axis orphans could in principle have been detected in the survey, we do not include them in the simulations and focus solely on untriggered and on-axis orphans.
The expected number of detected afterglows in the survey depends on the choices for , , and . The ranges for the slopes and break time were obtained from observed light curves (Zeh et al. 2005). Accordingly, we used Gaussian distributions for –1.8–0.4 and –2.8–1.4 and an uniform distribution for ranging from 0.4–4 days. The most influencing parameter for the outcome of the simulations is the initial magnitude of a candidate afterglow. Rapid optical follow-up observations of BATSE bursts with LOTIS and ROTSE-I (Park et al. 1999; Akerlof et al. 2000; Kehoe et al. 2001) and recent Swift/UVOT detections indicated that the preponderance of early afterglows does not get brighter than 14. Furthermore, HETE-2 follow-up and UVOT observations showed that around 50 % of the afterglows might be brighter than 18.5 for 30 minutes after the burst (e.g., Lamb et al. 2004).
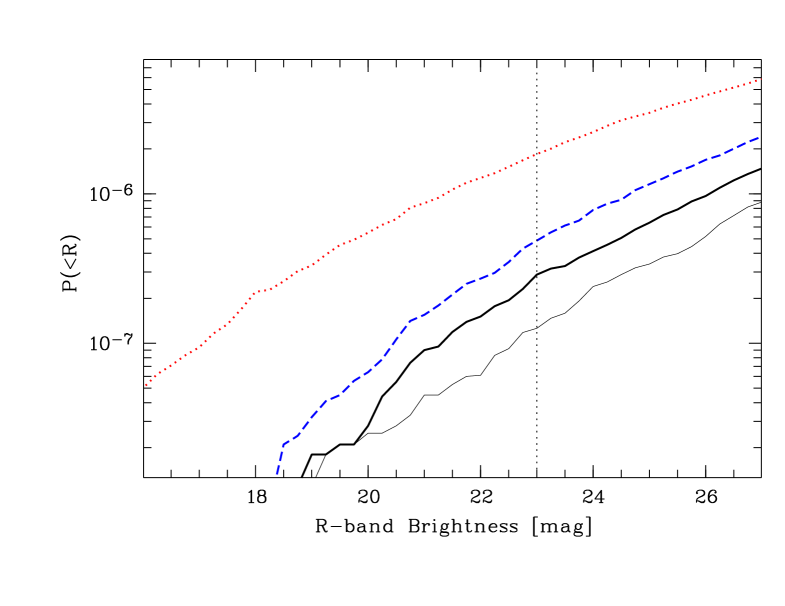
In order to test the influence of the limits of on the expected number of afterglows in the survey, we performed two simulations with 106 bursts per year and full sky, each. The initial magnitudes were uniformly distributed between 920 and 1323, respectively. In addition, a distribution proportional to 0.2 in the range of 1323 was simulated. The latter corresponds to the observations of afterglows presented in Zeh et al. (2005) and is expected to reproduce the reality more closely than an uniform distribution. Each simulation was repeated 103 times and the mean detection rates at a given -band magnitude were obtained.
The results of the simulations are presented in Figure 8. Here we show the normalized (devided by the total number of simulated events) probability for a first-time detection of a simulated afterglow brighter than a given magnitude. The normalized probability represents the chance to detect the afterglow in a simulation with one single event over the year and full sky. The expectation for a second observation of a candidate afterglow for the model with non-uniform distribution of is included as well. Naturally, the probability to detect an afterglow increases with the depth of the survey. More transients are expected to be detected above a certain magnitude for afterglow models with brighter . Due to the lower number of bright afterglows and the increasing probability with diminishing initial brightness, the non-uniform distribution gives the lowest expectation rates. At the limiting magnitude of the survey of 23 the probability to detect a specific randomly selected afterglow in at least one observation is approximately 310-7. The detection rate of events in at least two consecutive observations is lower by a factor of 3. In the more optimistic models, the probability for a single detection reaches up to 210-6.
5 Discussion
The Monte Carlo simulations described in the previous section provide us with the number of afterglows (per year and full sky), , which correspond to the probability of identifying one event in two consecutive observations of the survey. For the three tested afterglow parameterizations we find values between =1.5106 and =1107.
Throughout the survey, four unidentified optical transients were discovered and one of these sources shows indications for an extragalactic origin (see Sect. 3.1.2). Nevertheless, the flaring of the source was only detected in a single observation and thus the fading could not be monitored. An unambiguous identification of the transient with a GRB afterglow is therefore not possible which leaves us with the result of having no clear orphan or untriggered afterglow detected in the data. Therefore, obtained from the simulations can be interpreted as an upper limit on the true number of on-axis afterglows per year and full sky. For one or more on-axis orphans would have been expected in the data.
As advertised earlier, on-axis orphan afterglows can be used to place a constraint on the collimation of the optical afterglow emitting region relative to the collimation of the -ray emitting jet. The collimation factor, , corresponds to the ratio of the true rates of on-axis optical afterglows, , and long-duration GRBs which produce observable optical afterglows, , pointed at the Earth. With , an upper limit for the collimation can be derived from /. Obtaining is not trivial as several uncertain factors influence the number of GRBs for which afterglows are in principle detectable. In a simplified model can be written as
| (1) |
where is the observed rate of long-duration GRBs with a specific -ray instrument corrected for sky coverage, Earth-blockage and instrument down-time corrects for events outside the instrument’s energy range, is the correction factor for optically dim or dark afterglows of long-duration bursts (e.g., intrinsically faint, absorbed, high-) and corrects for possible afterglows associated with short bursts. Using the full sky GRB rate measured with BATSE of 666 yr-1 (Paciesas et al. 1999) and correcting for the ratio of long to short bursts (2:1; Kouveliotou et al. 1993), we obtain 444. The HETE-2 population of high energy bursts revealed a composition of X-ray flashes (Heise et al. 2001), X-ray rich bursts and “normal” GRBs in equal parts (Lamb et al. 2005). X-ray flashes and X-ray rich bursts show similar afterglows as observed for GRBs but have softer prompt emission spectra. As BATSE was less sensitive at lower energies than HETE-2 a fraction of these events might have been missed. This could require a correction factor as large as =2.
In general, not for all rapidly followed GRBs an associated optical transient can be found. Some detected afterglows were faint already early on and would have fallen below the limiting magnitude reached in our survey. The fraction of these events was found to be of the order of 10 % (e.g., Lamb et al. 2004; Jakobsson et al. 2004; Rol et al. 2005) which provides 0.9. Only recently the first optical transients of short-duration GRBs were found (Price et al. 2005; Gal-Yam et al. 2005). Theory and observations hint that these afterglows are significantly fainter than the counterparts of long-duration bursts. Therefore, we neglect the influence of short burst afterglows and apply =1 (as we also subtracted them from the burst rate of BATSE).
Using the assumptions discussed above together with =1107 we derive 800 and 12500 accordingly. This rather conservative upper limit is significantly higher than the beaming correction derived by Guetta et al. (2005) and Frail et al. (2001) of 7525 and 500, respectively. The -ray beaming factor corresponds to the ratio of the overall rate of GRBs to the detected burst rate and should be an upper limit for (corresponding to the case of isotropic afterglow radiation).
The high upper limit on shows that the effective coverage of the performed observations were not sufficient to provide a strong constraint for the collimation. An approximately 25 times larger portion of the sky (325 deg2) would have been required to reduce to less than 500, assuming no orphan afterglow detection. We performed a further Monte Carlo simulation in order to estimate the properties for an “ideal” survey assuming a schedule of one observation per field every two nights over 150 nights with a limiting magnitude of =23. We find that 500 (75, 10) would be reached with such a configuration and a 50 deg2 (300 deg2, 2500 deg2) field. Although ambituous, a program like this is in the range of the near-future instrumentation (e.g., VLT Survey Telescope, Visible & Infrared Survey Telescope for Astronomy) which encourages to perform a comprehensive search for untriggered GRBs in the near future. In addition, spectroscopic follow-up observations of candidate orphans would be important to distinguish between afterglows and other optical transients.
The non-detection of an afterglow also provides a limit on the rate of other explosive events with similar fading behaviour. This includes events with minor or quashed high energy emission like failed GRBs (Huang et al. 2002) or so-called “dirty fireballs” (Dermer et al. 1999).
6 Conclusion
We presented the data reduction, analysis and results of an -band survey dedicated to slowly variable optical transients. The survey strategy was designed specifically to search for afterglows of untriggered gamma-ray bursts. 12 deg2 were monitored in up to 25 nights down to a limiting magnitude of =23. Throughout the survey, four previously unknown transients were discovered. Based on the limited photometric data only putative classifications of the candidates could be obtained so far. The observations of three of the transients suggest them to be a cataclysmic variable, a flare star and a dwarf nova, respectively.
The fourth transient appeared in a single image as a bright source slightly offset with respect to an underlying quiesent object. The decay of the source could not be followed due to the lack of observations, thus the orgin of the transient is unresolved. However, the spatial association with the persistent source suggests an extragalatic origin. The steep brightness increase of 1.5 mag in 2 days appears a-typical for a supernova and thus makes the detected flaring source the best candidate for an orphan afterglow in our survey.
Simulations of the transient detection efficiency of the survey showed that the effective sky coverage was not sufficient to obtain a strong constraint on the collimation of the optically emitting GRB outflow from the non-detection of suitable counterparts. Nevertheless, we found that a similar programs like the one described in this paper are feasible to be performed in the near future. Limits on the collimation ratio of the X-ray to gamma-ray emitting regions were already obtained in the past and strong ratios (8) were ruled out (Grindlay 1999; Greiner et al. 2000). Tighter constraints on the optical emitting region will become available soon as well with the use of large dedicated surveys.
Acknowledgments. We thank the many observers who have assisted in the completion of this survey, including M. Braun, D. Clowe, J. Eislöffel, J. Fried, P. Heraudeau, R. Klessen, T. Kranz, I. Lehmann, R. Schmidt, C. Wolf, D. Woods and the helpful night assistants at La Silla. We thank Mario Radovich (INAF - Osservatorio Astronomico di Capodimonte) for making the WIFIX image reduction and astrometry package publicly available. We thank the anonymous referee for useful comments. The WFI is a joint project between the European Southern Observatory, the Max-Planck-Institut für Astronomie in Heidelberg (Germany) and the Osservatorio Astronomico di Capodimonte in Naples (Italy).
References
- (1) Akerlof, C., Balsano, R., Barthelmy, S., et al. 2000, ApJ, 532, L25
- (2) Becker, A.C., Wittman, D.M., Boeshaar, P.C., et al. 2004, ApJ, 611, 418
- (3) Covino, S., Lazzati, D., Ghisellini, G., et al. 1999, A&A, 348, L1
- (4) Dalal N., Griest, K., & Pruet, J., 2002, ApJ, 564, 209
- (5) Dermer, C.D., Chiang, J., & Böttcher, M. 1999, ApJ, 513, 656
- (6) Frail, D.A., Kulkarni, S.R., Sari, R. et al. 2001, ApJ, 562 ,L55
- (7) Fruchter, A., Thorsett, S.E., Metzger, M.R., et al. 1999, ApJ, 519, L13
- (8) Gal-Yam, A., Ofek, E.O., Filippenko, A.V., Chornock, R., & Li, W., 2002, PASP, 114, 587
- (9) Gal-Yam, A., Cenko, S.B., Berger, E., Krzeminski, W., & Lee, B., 2005, GCN, 3681
- (10) Ghisellini, G., & Lazzati, D., 1999, MNRAS, 309, L7
- (11) Greiner, J., Hartmann, D., Voges, W., et al. 2000, A&A 353, 998
- (12) Greiner, J., Klose, S., Reinsch, K., et al. 2003, Nature, 426, 157
- (13) Grindlay, J.E., 1999, ApJ 510, 710
- (14) Gruzinov, A., 1999, ApJ, 525, L29
- (15) Guetta, D., Piran, T., Waxman, E., 2005, ApJ, 619, 412
- (16) Harrison, F. A., Bloom, J.S., Frail, D.A., et al. 1999, ApJ, 523, L121
- (17) Heise, J., in’t Zand, J, Kippen, R.M., & Woods P.M., 2001, in Gamma-Ray Bursts in the Afterglow Era, ed. E. Costa, F. Frontera, & J. Hjorth (Berlin: Springer), 16
- (18) Huang, Y.F., Dai, Z.G., & Lu, T., 2002, MNRAS, 332, 735
- (19) Jakobsson, P., Hjorth, J., Fynbo, J.P.U., et al. 2004, ApJ, 617, L21
- (20) Kehoe, R., Akerlof, C., Balsano, R., et al. 2002, ApJ, 577, L159
- (21) Kouveliotou, C., Meegan, C.A., Fishman, G.J., et al. 1993, ApJ, 413, L101
- (22) Lamb, D.Q., Ricker, G.R., Atteia, J.-L, et al. 2004, New Astronomy Review, 48, 423
- (23) Lamb, D.Q., Donaghy, T.Q., & Graziani, C., 2005, ApJ, 620, 355
- (24) Landolt, A.U., 1992, AJ, 104, 340
- (25) Leibundgut, B., Tammann, G.A., Cadonau, R., & Cerrito, D., 1991, A&AS, 89, 537
- (26) Li, L. & Paczynski, B. 1998, ApJ, 507, L59
- (27) Monet, D.B.A., Canzian, B., Dahn, C., et al. 1998, VizieR Online Data Catalog, 1252
- (28) Nakar, E., & Piran, T., 2003, New Astr. 8, 141
- (29) Paciesas, W.S., Meegan, C.A., Pendleton, G.N., et al. 1999, ApJSS, 122, 465
- (30) Park, H.S., Porrata, R.A., Williams, G.G, et al. 1999, A&AS, 138, 577
- (31) Perna, R., & Loeb, A., 1998, ApJ, 509, L85
- (32) Price, P.A., Jensen, B.L., Jargensen, U.G., et al. 2005, GCN, 3612
- (33) Rees, M.J. & Meszaros, P., 1992, MNRAS, 258, 41
- (34) Rees, M.J. & Meszaros, P., 1994, ApJL, 430, 93
- (35) Reid, I.N., Hawley, S.L., & Gizis, J.E., 1995, AJ, 110, 1838
- (36) Rhoads, J., 1997, ApJ, 487, L1
- (37) Rhoads, J., 1999, ApJ, 525, 943
- (38) Rhoads, J., 2003, ApJ, 591, 1097
- (39) Rol, E., Wijers, R.A.M.J., Kouveliotou, C., Kaper, L., & Kaneko, Y., 2005, ApJ, 624, 868
- (40) Rykoff, E., Aharonian, F., Akerlof, C.W., et al. 2005, ApJ, 631, 1032
- (41) Sari, R., 1999, ApJ, 524, L43
- (42) Schlegel, D.J., Finkbeiner D.P., & Davis, M. 1998, ApJ, 500, 525
- (43) Stanek, K.Z., Garnavich, P.M., Kaluzny, J., Pych, W., & Thompson, I., 1999, ApJ 522, L39
- (44) Totani, T., & Panaitescu, A., 2002, ApJ, 576, 120
- (45) Vanden Berk, D.E., Lee, B.C., Wilhite, B.C., et al. 2002, ApJ, 576, 673
- (46) Verbunt, F.; Bunk, W.H.; Ritter, H.; Pfeffermann, E., 1997, A&A, 327, 602
- (47) Vestrand, W.T., Borozdin, K., Casperson, D.J, 2004, AN, 325, 549
- (48) Voges, W.; Aschenbach, B.; Boller, T.; et al. 2000, IAU Circ 7432
- (49) Wijers, R.A.M.J., Vreeswijk, P.M., Galama, T.J., et al. 1999, ApJ, 523, L33
- (50) Zeh, A., Klose, S., Kann, D.A. 2005, ApJ, 637, 889