A SCUBA survey of L1689 – the dog that didn’t bark
Abstract
We present submillimetre data for the L1689 cloud in the Ophiuchi molecular cloud complex. We detect a number of starless and prestellar cores and protostellar envelopes. We also detect a number of filaments for the first time in the submillimetre continuum that are parallel both to each other, and to filaments observed in the neighbouring L1688 cloud. These filaments are also seen in the 13CO observations of L1689. The filaments contain all of the star-formation activity in the cloud. L1689 lies next to the well studied L1688 cloud that contains the Oph-A core. L1688 has a much more active star-formation history than L1689 despite their apparent similarity in 13CO data. Hence we label L1689 as the dog that didn’t bark. We endeavour to explain this apparent anomaly by comparing the total mass of each cloud that is currently in the form of dense material such as prestellar cores. We note firstly that L1688 is more massive than L1689, but we also find that when normalised to the total mass of each cloud, the L1689 cloud has a much lower percentage of mass in dense cores than L1688. We attribute this to the hypothesis of Loren (1989) that the star formation in the Ophiuchi complex is being affected and probably dominated by the external influence of the nearby Upper Scorpius OB association and predominantly by Sco. L1689 is further from Sco and is therefore less active. The influence of Sco appears nonetheless to have created the filaments that we observe in L1689.
keywords:
stars: formation – stars: pre-main-sequence – ISM: clouds – ISM: dust,extinction – ISM individual: L1689, L16881 Introduction
The earliest stages of low-mass (0.2–2M⊙) star formation are becoming reasonably well understood (see e.g. , André et al.2000 for a review). The prestellar core stage (Ward-Thompson et al., 1994) is the phase in which a molecular cloud core has become gravitationally bound. Thereafter gravitational collapse sets in and a central hydrostatic protostar forms, which is known as a Class 0 protostar (, André et al.1993). Once half of the final mass has accreted onto the central object it is known as a Class I protostar (Wilking et al., 1989), and it subsequently evolves through the Class II & III young stellar object (YSO) phases (Lada, 1987). Debate continues over the details of this evolutionary process, and different molecular clouds appear to be evolving according to a different interplay of physical mechanisms. These include magnetic fields, turbulence and feedback from previous episodes of star formation. Submillimetre studies of different star-forming regions are required to help clarify the evolutionary process and determine the effect of these mechanisms.
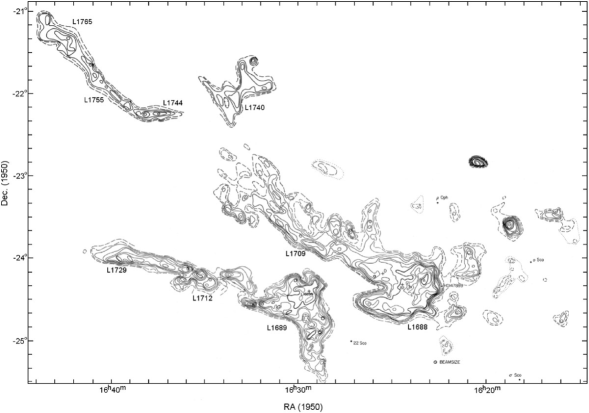
The L1689 molecular cloud is part of the Ophiuchi molecular cloud complex, which is located at a distance of 128 12 pc from the sun (Bertout et al., 1999). It was first detected by Lynds (1962) in a large study of the dark nebulae detected in the Palomar Observatory Sky Survey plates. The Ophiuchi complex was extensively mapped by Loren (1989) using 13CO at a resolution of 2.4 arcmin. The resulting map of the cloud is shown in Fig. 1. The data show that the molecular cloud is composed of a number of sub-clouds, the most massive of which is L1688.
| Map centre | ||||
| Field | RA | Dec. | ||
| Name | (2000) | (2000) | UT Date | |
| R31-49 | 16:31:39.6 | 24:49:43 | 1999-Mar-09 | 0.34 |
| – | – | – | 2000-Apr-09 | 0.26 |
| R31-58 | 16:31:56.7 | 24:58:52 | 1999-Mar-09 | 0.38 |
| – | – | – | 2000-Apr-10 | 0.22 |
| R32-45 | 16:32:11.5 | 24:45:21 | 2000-Apr-09 | 0.22 |
| R32-03 | 16:32:14.1 | 25:03:10 | 1999-Aug-08 | 0.22 |
| – | – | – | 1999-Aug-09 | 0.38 |
| R32-07 | 16:32:22.7 | 25:07:50 | 1999-Apr-08 | 0.22 |
| – | – | – | 2000-Apr-10 | 0.18 |
| R32-37 | 16:32:26.1 | 24:37:20 | 2000-Apr-09 | 0.22 |
| R32-28 | 16:32:27.6 | 24:28:25 | 1999-Mar-09 | 0.30 |
| R32-00 | 16:32:38.8 | 25:00:49 | 2000-Apr-10 | 0.18 |
| R33-22 | 16:33:01.9 | 24:22:17 | 2000-Apr-12 | 0.30 |
| R33-37b | 16:33:02.1 | 24:37:17 | 1999-Aug-09 | 0.26 |
| – | – | – | 2000-Apr-11 | 0.22 |
| R33-32 | 16:33:17.0 | 24:32:16 | 1999-Mar-09 | 0.34 |
| – | – | – | 2000-Apr-10 | 0.18 |
| – | – | – | 2000-Apr-12 | 0.30 |
| R33-46 | 16:33:22.3 | 24:46:16 | 2000-Apr-12 | 0.30 |
| R33-37a | 16:33:38.1 | 24:37:15 | 2000-Apr-11 | 0.22 |
| R34-28 | 16:34:01.9 | 24:28:13 | 1999-Mar-09 | 0.38 |
| – | – | – | 1999-Aug-08 | 0.26 |
| R34-37 | 16:34:14.1 | 24:37:13 | 2000-Apr-11 | 0.22 |
| R34-38 | 16:34:50.2 | 24:38:04 | 1999-Aug-08 | 0.26 |
| – | – | – | 1999-Aug-09 | 0.30 |
| – | – | – | 2000-Apr-11 | 0.22 |
The majority of studies of the Ophiuchi molecular cloud to date have concentrated on the L1688 sub-cloud, also known as the Oph main cloud. A number of filamentary clouds (L1709, L1740, L1744, L1755 and L1765) extend from L1688 in a north easterly direction, and are often called the streamers or the cobwebs of Ophiuchus. To the southeast of L1688 lies L1689, which also has filamentary clouds (L1712 and L1729) extending in roughly the same direction. Loren (1989) measured masses for L1688 and L1689 of 1447 M⊙ and 566 M⊙ respectively, while the components of the streamers have lower masses of 100–300 M⊙ each. The direction of the streamers turns to the south at the positions of both L1688 and L1689, forming a horseshoe shape in the case of L1688 and a boomerang shape in the case of L1689 (see Fig. 1).
Numerous studies of the L1688 cloud have revealed a rich history of star formation. Prompted by the association of early-type stars with the Ophiuchi dark cloud, Grasdalen, Strom, & Strom (1973) surveyed the cloud at 2 m and discovered a large number of embedded young stars. Subsequent observations at a variety of wavelengths (e.g. Wilking & Lada, 1983; Andre, Montmerle, & Feigelson, 1987; Ward-Thompson et al., 1989; Wilking et al., 1989; Greene et al., 1994; Casanova et al., 1995; , Motte et al.1998; Johnstone et al., 2000; , Johnstone et al.2004) have revealed large numbers of objects at every stage of star formation. Indeed, studies of this region have greatly increased our knowledge of the star-formation process as a whole.
In contrast, the L1689 cloud appears to have relatively little star-forming activity, concentrated in a small number of isolated sources such as IRAS 16293-2422 (Loren et al., 1990). As such, we have labelled L1689 ‘the dog that didn’t bark’. In this paper, we endeavour to find out why there is such an apparent discrepancy between the star-formation activity in L1688 and L1689 when they appear so similar in CO maps – see Fig. 1. We report on submillimetre observations of L1689 and compare them with those taken at other wavelengths, in order to understand the similarities and differences between L1688 and L1689.
| Region Centre | 1 noise (Jy/beam) | |||
|---|---|---|---|---|
| Region Name | RA (2000) | Dec. (2000) | 850 m | 450 m |
| L1689-West | 16:31:40 | 24:50:00 | 0.029 | 2.4 |
| L1689-South | 16:32:10 | 25:03:00 | 0.016 | 0.51 |
| L1689-NorthWest | 16:32:30 | 24:35:00 | 0.047 | 3.4 |
| L1689-Centre | 16:33:20 | 24:47:00 | 0.034 | 1.3 |
| L1689-North | 16:33:30 | 24:33:00 | 0.023 | 0.87 |
| L1689-East | 16:34:50 | 24:38:00 | 0.015 | 0.39 |
2 Observations
The observations were carried out using the Submillimetre Common User Bolometer Array (SCUBA) on the James Clerk Maxwell Telescope (JCMT). This instrument takes observations at 450 and 850 m simultaneously through the use of a dichroic beam-splitter. The telescope has a resolution of 8 arcsec at 450m and 14 arcsec at 850 m.
Observations of L1689 were carried out over several nights between 1999 March and 2000 April using the scan-map observing mode as listed in Table 1. A scan-map is made by scanning the array across the sky. The scan direction is 15.5∘ from the axis of the array in order to achieve Nyquist sampling. The array is rastered across the sky to build up a map several arcminutes in extent.
Time-dependent variations in the sky emission were removed by chopping the secondary mirror at 7.8 Hz. Due to a scan-map being larger in size than the chop throw, each source in the map appears as a positive and a negative source. In order to remove this dual-beam function, each region is mapped six times, with chop throws of 30, 44 and 68 arcsec in both RA and Dec (Emerson, 1995). The dual-beam function is removed from each map in Fourier space by dividing each map by the Fourier transform of the dual-beam function, which is a sinusoid. The multiple chop-throws allow for cleaner removal of the dual beam function in Fourier space. The maps are them combined, weighting each map to minimise the noise introduced at the spatial frequencies that correspond to zeroes in the sinusoids. Finally the map is converted back into normal space, where it no longer contains the negative sources (Jenness & Lightfoot, 2000).
The submillimetre zenith opacity at 450 and 850m was determined using the ‘skydip’ method and by comparison with polynomial fits to the 1.3 mm sky opacity data, measured at the Caltech Submillimeter Observatory (Archibald et al., 2002). The average zenith optical depth at 850 m is listed in Table 1 for each observation. The telescope pointing was checked at regular intervals throughout the nights using planets, secondary calibrators and standard pointing sources.
The data were reduced in the normal way using the SCUBA User Reduction Facility (Jenness & Lightfoot, 2000). Calibration was performed using observations of the planet Uranus taken during each shift. We estimate that the absolute calibration uncertainty is 10% at 850m and 30% at 450m, based on the consistency and reproducibility of the calibration from map to map.
3 Results
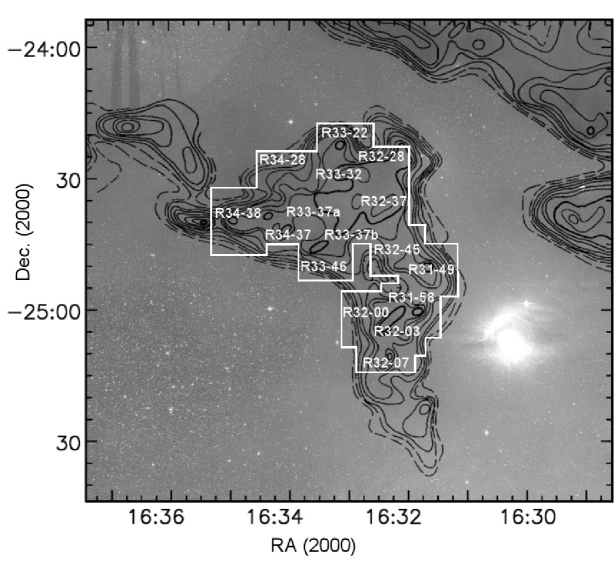
The map of L1689 is made up of a number of scan-maps, each of which is 12 12 arcmin in size. The positions of the scan-maps were chosen to trace the 13CO emission mapped by Loren (1989). This is shown graphically in Fig. 2, where the mapped area is overlaid in white on the black 13CO contours (Loren, 1989). The names and approximate positions of the different scan-map fields are shown in white. The background 0.5 m image is taken from the Digitized Sky Survey (Lasker, 1994), obtained using the SkyView interface (McGlynn & Scollick, 1994). The mapping strategy was to offset each scan-map from the neighbouring maps by approximately half a map-length. This was to avoid potential ‘striping’ caused by the increased noise levels at the scan-map edges. The name of each scan-map is taken from the J2000 coordinates of the scan-map centre. The observation details are summarised in Table 1.
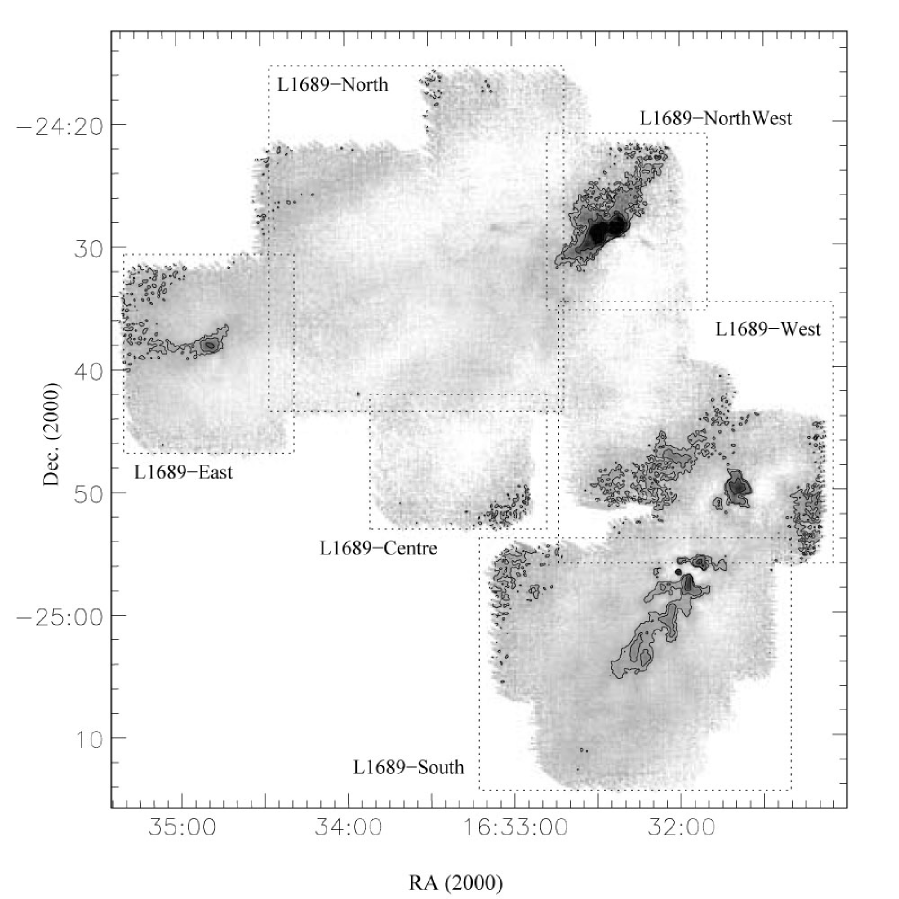
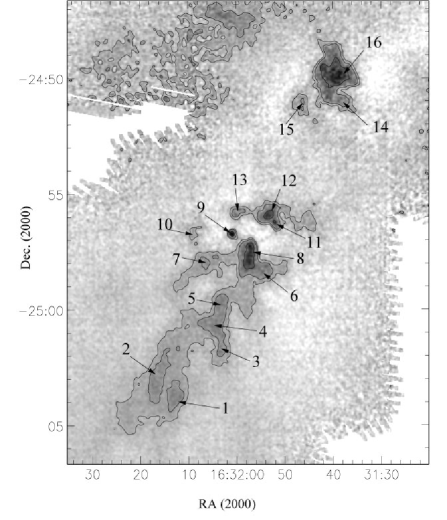
Fig. 3 shows the data for the L1689 cloud at 850m. The area covered is approximately 0.5 deg2, which at a distance of 128 pc is equal to 2.5 pc2. As a result of the different weather conditions at the telescope when the maps were made, and also the varying integration time per point, the noise level varies across the map. We have therefore split the map up into a number of regions, and measured the mean 1 noise level for each region. These are given in Table 2. The extent of the different regions, and our names for them, are illustrated with dashed lines in Fig. 3.
A number of sources are seen in the 850 m map. We have labelled these SMM 121 in order of increasing declination. The sources were identified by eye by selecting regions of flux density greater then 4- above the background level. All the sources are smaller than arcmin. Any structure larger than this scale is deemed to be part of the filamentary structure of the cloud, and is discussed below. The identities of the relatively compact (i.e. arcmin) sources are discussed in the following section. The only source detected at 450 m is the well-studied binary/multiple Class 0 protostar IRAS 16293-2422 (Wootten, 1989; Mundy et al., 1992; Walker, Carlstrom, & Bieging, 1993).
| Aperture | 850 m | 450 m | |||||||
| Source | RA | Dec. | Ext. | Semi-major | Semi-minor | Peak | Int. | Peak | Int. |
| Name | (2000) | (2000) | (arcsec) | (arcsec) | (Jy/beam) | (Jy) | (Jy/beam) | (Jy) | |
| SMM 1 | 16:32:12.5 | -25:03:53 | Y | 32 | 24 | 0.15 | 0.75 | – | |
| SMM 2 | 16:32:16.1 | -25:02:44 | Y | 67 | 29 | 0.14 | 1.6 | – | |
| SMM 3 | 16:32:02.7 | -25:01:48 | Y | 24 | 22 | 0.15 | 0.50 | – | |
| SMM 4 | 16:32:04.1 | -25:00:53 | Y | 38 | 22 | 0.18 | 1.1 | – | |
| SMM 5 | 16:32:03.0 | -24:59:48 | Y | 37 | 22 | 0.15 | 0.67 | – | |
| SMM 6 | 16:31:54.6 | -24:58:22 | Y | 30 | 20 | 0.22 | 0.94 | – | |
| SMM 7 | 16:32:06.3 | -24:58:01 | Y | 41 | 27 | 0.11 | 0.49 | – | |
| SMM 8 | 16:31:57.5 | -24:57:40 | Y | 43 | 25 | 0.30 | 1.4 | – | |
| SMM 9 | 16:32:01.0 | -24:56:44 | N | 13 | 13 | 0.44 | – | – | |
| SMM 10 | 16:32:08.6 | -24:56:41 | Y | 39 | 27 | 0.11 | 0.45 | – | |
| SMM 11 | 16:31:52.2 | -24:56:13 | Y | 17 | 15 | 0.29 | 0.56 | – | |
| SMM 12 | 16:31:53.7 | -24:55:54 | Y | 36 | 21 | 0.32 | 1.4 | – | |
| SMM 13 | 16:32:00.3 | -24:55:53 | Y | 31 | 21 | 0.23 | 0.72 | – | |
| SMM 14 | 16:31:37.5 | -24:51:09 | Y | 36 | 26 | 0.27 | 1.5 | – | |
| SMM 15 | 16:31:46.8 | -24:51:10 | Y | 34 | 27 | 0.20 | 1.2 | – | |
| SMM 16 | 16:31:39.2 | -24:49:48 | Y | 63 | 51 | 0.40 | 7.8 | – | |
| SMM 17 | 16:33:55.7 | -24:42:06 | N | 12 | 11 | 0.21 | – | – | |
| SMM 18 | 16:34:48.4 | -24:38:04 | Y | 43 | 30 | 0.24 | 2.0 | – | |
| SMM 19 | 16:32:29.3 | -24:29:13 | Y | 48 | 33 | 1.64 | 12 | – | |
| SMM 20 | 16:32:23.0 | -24:28:40 | Y | 39 | 28 | 15.9 | 28 | 80 | 180 |
| SMM 21 | 16:33:06.2 | -24:28:38 | Y | 27 | 19 | 0.12 | 0.36 | – | |
Table 3 gives the measured flux density for each source detected in the map. The peak flux density is given in Jy/beam for each source at both 450 and 850 m. 3 upper limits are given for sources that are undetected at 450 m. The integrated flux density is also given for sources that are extended in the 14 arcsec JCMT beam. The semi-major and semi-minor axes of the elliptical apertures used to measure these integrated flux densities are given in columns 5 and 6 of Table 3.
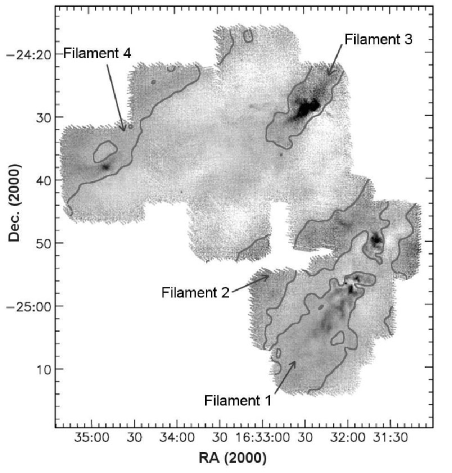
Taking the map as a whole, we see that the cloud appears to be composed of a number of approximately parallel filaments, that run the length of the map. These are highlighted in Fig. 4, where the contours are the data after it has been smoothed to a resolution of 1 arcmin to illustrate the large scale structure. A number of sources associated with these filaments are also detected. The nature of these sources is discussed below.
Filament 1 lies at the southern end of the map, and extends northwest-southeast (NW-SE) through the L1689-West and L1689-South regions. The filament appears to have fragmented into a number of objects, forming more than one object across its width in some cases. The degree of fragmentation appears to be greater at the north of the filament, where the majority of the sources detected in this filament are found. The sources at the southern end of the filament are also seen to be less centrally condensed. Fig. 5 shows this filament in more detail. The 16 sources in the filament have been labelled. Most of these objects are significantly extended in the JCMT beam, and have a fairly complex structure. This filament contains the majority of the sources that are seen in the L1689 molecular cloud.
 |
 |
| (a) | (b) |
Filament 2 runs roughly parallel to Filament 1 but slightly to the north, also in a NW-SE direction. There are no detected sources associated with this filament. The filament has been independently detected on a number of scan-maps. Unfortunately, Filament 2 has not been covered very well by the scan-mapping strategy. There is an area that has not been mapped in the middle of the filament, and most of the area that has been mapped has been covered only once. In addition, the filament has mostly been caught on the edges of the scan-maps, where the noise levels can be of order 1.5 higher. As a result of these factors, the level of noise along the filament is higher than average. We therefore suggest that this filament be re-mapped to confirm our findings.
Filament 3 extends from the L1689-NorthWest region, in a NW-SE direction also roughly parallel to Filament 1. The brightest source in this filament is the IRAS 16293 binary/multiple Class 0 protostar (labelled here SMM 20). There is also a weaker source 90 arcsec (approximately 14000 AU) to the southeast of IRAS 16293, named 16293E (SMM 19). It is interesting to note that the extended emission surrounding IRAS 16293 lies parallel to the axes of the other filaments in the map. The filament is only detected in the northwest of the image, though if the line of the filament is extrapolated, a weak unresolved source (SMM 17) is detected at RA (2000) = 16h33m55.7s, Dec. (2000) = 24∘42′06′′.
Filament 4 extends from the L1689-East region at the east of the map, in a NW-SE direction. Like Filament 2, it skirts along the edge of the map, therefore the noise is higher than average. The only object detected in the filament is the L1689B (Myers & Benson, 1983) prestellar core (Ward-Thompson et al., 1994; , Kirk et al.2005) at RA (2000) = 16h34m48.6s, Dec. (2000) = 24∘38′00′′, that we label here SMM 18. Filament 4 is the least completely mapped of the four filaments, but it is seen in more than one overlapping scan-map. We also note that the envelope of L1689B is elongated parallel with the filament axis.
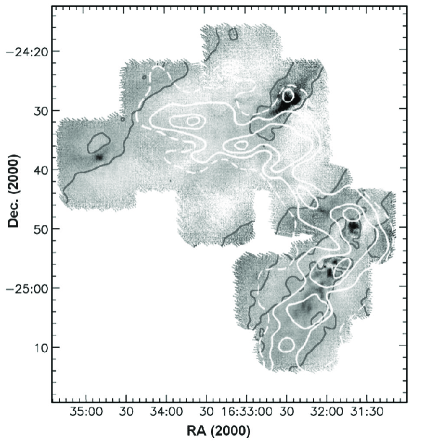
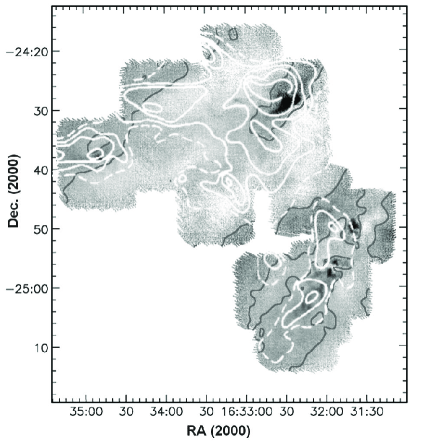
When observed with molecular line tracers, the Ophiuchi cloud is also filamentary in appearance (Loren, 1989). This filamentary structure is not restricted to the streamers that extend to the northeast, but is also seen in the larger L1688 and L1689 sub-clouds (Wilking & Lada, 1983; Loren, 1989).
To illustrate this, Figs 6(a)&(b) show our 850 m data smoothed to highlight the filaments as in Fig. 4. 13CO maps are overlaid as light contours (Loren, 1989). Figs. 6(a)&(b) show the 13CO radial velocity intervals kms-1 and kms-1 respectively. As can be seen, Filament 1 is clearly detected in 13CO at both of these velocity intervals. Filaments 3 and 4 and the northern half of Filament 2 are seen at velocities 3.32 – 3.66 kms-1 (Fig. 6b).
| Source | Class | Temp | Mass | 13CO | Other | ||
|---|---|---|---|---|---|---|---|
| Name | (K) | () | (M⊙) | (M⊙) | region | Names | |
| SMM 1 | Prestellar | 12 | 0.01 | 0.3 | 0.4 | R55 | L1689A4 |
| SMM 2 | Prestellar | 12 | 0.01 | 0.6 | 0.7 | R55 | |
| SMM 3 | Prestellar | 12 | 0.01 | 0.2 | 0.3 | R55 | |
| SMM 4 | Prestellar | 12 | 0.01 | 0.4 | 0.4 | R55 | |
| SMM 5 | Prestellar | 12 | 0.01 | 0.3 | 0.4 | R55 | |
| SMM 6 | Prestellar | 12 | 0.01 | 0.4 | 0.4 | R55 | |
| SMM 7 | Starless | 12 | 0.01 | 0.2 | 0.5 | R55 | |
| SMM 8 | Prestellar | 12 | 0.01 | 0.6 | 0.5 | R55 | L1689SMM4 |
| SMM 9 | I | 30 | 0.02 | 0.02 | – | R55 | IRAS 16289-2450, L1689-IRS62, |
| ISO-2093, L1689S-IRS674 | |||||||
| SMM 10 | Starless | 12 | 0.01 | 0.2 | 0.5 | R55 | |
| SMM 11 | II | 30 | 0.03 | 0.02 | – | R55 | L1689-IRS52, ISO-2043 |
| SMM 12 | Prestellar | 12 | 0.01 | 0.6 | 0.4 | R55 | |
| SMM 13 | Prestellar | 12 | 0.01 | 0.3 | 0.4 | R55 | |
| SMM 14 | Prestellar | 12 | 0.01 | 0.6 | 0.5 | R53 | |
| SMM 15 | Prestellar | 12 | 0.01 | 0.5 | 0.5 | R53 | R531 |
| SMM 16 | Prestellar | 12 | 0.01 | 3.0 | 0.8 | R53 | R531 |
| SMM 17 | II | 30 | 0.03 | 0.01 | – | R65 | RX J1633.9-24428 |
| SMM 18 | Prestellar | 12 | 0.01 | 0.8 | 0.5 | R65 | L1689B9 |
| SMM 19 | 0 | 30 | 0.02 | 0.6 | – | R57 | IRAS 16293-2422E7 |
| SMM 20 | 0⋆ | 30 | 0.02 | 1.3 | – | R57 | IRAS 16293-24226 |
| SMM 21 | Starless | 12 | 0.01 | 0.1 | 0.3 | R57 |
4 Individual Sources
4.1 Identities of the detected sources
In identifying the nature of submillimetre detected sources, there are a number of factors to take into account. To differentiate between a prestellar core and a Class 0 protostar, one can look for a centimetre radio source or a collimated molecular outflow, which would indicate the presence of a central hydrostatic object. Class 0 protostars are distinguished from more evolved classes of protostar by a large ratio of submillimetre to bolometric luminosity, or the presence of a centrally peaked and extended envelope (, André et al.2000). More evolved protostars (Class I and later) can be seen in the infrared. In this section, we discuss the identities of each of the sources, and summarise the source parameters in Table 4.
In order to estimate whether or not the sources are gravitationally bound, we compare their masses to the Bonnor-Ebert critical mass (Bonnor, 1956; Ebert, 1955), where is the radius of the source (taken to be the geometric mean of the semi-major and semi-minor axes given in Table 3), is the isothermal sound speed, and is the gravitational constant.
The source SMM 1 corresponds to the prestellar core L1689A, which has previously been mapped in the submillimetre (, Kirk et al.2005) and also in the far-infrared (, Ward-Thompson et al.2002). This core’s position, close to the leading edge of the L1689 cloud nearest the Upper Scorpius OB association (see Section 5.3), could potentially explain the unusual temperature profile measured in the far-infrared by (Ward-Thompson et al.2002).
The sources SMM 2-5 are all fairly extended cores that are not very centrally peaked. Their masses are comparable with the Bonnor-Ebert critical mass, as given in Table 4. These sources have not been observed previously, with the exception of SMM 5 which was detected in the millimetre (André & Montmerle, 1994), and possibly corresponds to the source VLA 16289, though the nature of this object is unknown. SMM 7 is also extended, though its mass is less than half of its Bonnor-Ebert critical mass. Therefore this source may well not be bound, but a transient object. Hence we label it as starless rather than prestellar in Table 4. This follows the distinction of definitions made by Ward-Thompson et al. (2006), who stated that the difference between a starless core and a prestellar core is that a prestellar core should be consistent with being gravitationally bound.
SMM 8 is the prestellar core L1689SMM, which was mapped by (Kirk et al.2005) using SCUBA in jiggle-map mode. There is no evidence of a protostar at the centre. The core is elongated in a north-south direction, though shows no evidence of fragmenting along its length. Both the morphology and flux density of our data are consistent with the earlier jiggle-map. There is a weaker source (SMM 6) to the south-west of SMM 8, which partially overlaps it.
SMM 9 is the Class I protostar IRAS 16289-2450. It has also been detected at a number of wavelengths from the near-infrared (L1689-IRS6 – Greene et al., 1994), the mid-infrared (ISO-209 – Bontemps et al., 2001) and the millimetre (L1689S-IRS67 – André & Montmerle, 1994). This object is centrally condensed in the submillimetre and no extended emission is detected.
There is an abrupt gap in the filament between SMM 8 and the group of objects to the north (SMM 11, 12 and 13). This could be caused by the gravitational collapse of the filament onto the surrounding cores, or the cavity could have been cleared by outflows from IRAS 16289-2450 (SMM 9), which lies within the cavity.
SMM10 is similar in appearance to its neighbour, SMM 7, and also appears not to be bound. SMM 11 is a Class II protostar which has previously been identified in the near-infrared (L1689-IRS5 – Greene et al., 1994) and mid-infrared (ISO-204 – Bontemps et al., 2001). Approximately 25 arcsec north of this (0.015 pc) lies SMM 12, which has not been previously observed at other wavelengths. This object is assumed to be prestellar in nature. SMM 13 has also not been detected at other wavelengths. Its mass is 70% of the critical Bonnor-Ebert mass, therefore it may not be bound. Again we label this source as starless in Table 4.
SMM 16 lies at the northern end of Filament 1, and is one of the brighter sources in the map. It appears to have some internal structure, though this is poorly resolved in the 14 arcsec beam. This suggests that SMM 16 could be composed of multiple unresolved sources, surrounded by a common envelope. The diameter of the source is approximately 2 arcmin (0.08 pc at a distance of 130 pc). A VLA survey has been conducted of this region (Stine et al., 1988). However, no centimetre sources coincident with SMM 16 were detected. This indicates that the source (or sources) may be prestellar in nature.
Two sources (SMM 14 & 15) are located 1–2 arcmin from the centre of SMM 16. Again there is no evidence of associated protostars (Stine et al., 1988), we therefore assume that these objects are prestellar, based on their Bonnor-Ebert masses. The three sources SMM 14, 15 and 16 are coincident with the starless core R53 which has been observed in absorption in the mid-infrared (Bacmann et al., 2000).
SMM 17 is a very weak isolated unresolved source, which lies 18 arcsec from the Class II YSO RX J1633.9-2442, which was identified through optical spectroscopy follow-up observations to a ROSAT X-ray survey of Ophiuchi (Martin et al., 1998). It is assumed that the submillimetre emission is associated with this source.
SMM 18 is the well studied prestellar core L1689B (e.g. , Kirk et al.2005, and references therein). This was one of the original starless ammonia cores mapped by Myers & Benson (1983) and subsequently determined to be prestellar in nature (Ward-Thompson et al., 1994). Subsequent mapping with the 1.3 mm MPIfR bolometer array at the IRAM 30m telescope confirmed the results of the earlier survey (, André et al.1996), and provided a more detailed picture of the density profile of the core. The morphology of L1689B, as shown in Fig. 3, is elongated in a roughly east-west direction. This is consistent with the 1.3 mm map (, André et al.1996) and also a SCUBA jiggle-map of the core (, Kirk et al.2005). (Ward-Thompson et al.2002) performed a greybody fit to the SED of L1689B between 90 m and 1.3 mm using ISO, JCMT and IRAM data, and found a best-fit temperature of K.
The brightest source in the map is SMM 20, which is the binary/multiple Class 0 protostar IRAS 16293. This object has been well studied at a number of wavelengths (e.g. Wootten, 1989; Mundy et al., 1992; Walker, Carlstrom, & Bieging, 1993; Ceccarelli et al., 1998; Castets et al., 2001; Correia et al., 2004), and is used as a secondary calibrator for submillimetre observations using SCUBA (Sandell, 1994). It appears to be a hierarchical system, with two components (16293A1 & A2) separated by 47 AU, and a third source (16293B) located approximately 800 AU to the northwest (Wootten, 1989). The objects are Class 0 protostars and are the sources of a quadrupolar molecular outflow, though 16293B shows no evidence of current outflow activity (Walker, Carlstrom, & Bieging, 1993). 16293A and B are separated by 5 arcsec and are therefore unresolved in the 14 arcsec JCMT beam. Molecular line studies of species that adsorb to grain surfaces (e.g. Castets et al., 2001; Wakelam et al., 2004) indicate that the envelope of IRAS 16293 is composed of a hot core, approximately 2 arcsec (260 AU) across, at a temperature of K. The core is surrounded by a cooler outer envelope at a temperature of 20 – 30 K.
SMM 19 corresponds to 16293E, which is located approximately 85 arcsec (0.05 pc) to the east of IRAS 16293. Castets et al. (2001) have argued that 16293E is a Class 0 protostar, on the grounds of a detected molecular outflow. Stark et al. (2004) did not detect the outflow from 16293E, and argued that the source is prestellar. This may have been due to a sensitivity effect, so we treat this source as a Class 0.
SMM 21 is a weak source with no previous detections at other wavelengths. Comparison with its Bonnor-Ebert critical mass indicates that it is probably not bound. We label it as a starless core.
4.2 Source Masses
Table 4 summarises the results of the previous section and gives mass estimates for all of the detected sources. The envelope mass is calculated using:
| (1) |
where is the 850 m flux density, is the distance to the source, is the mass opacity of the gas and dust, and is the Planck function at temperature .
For the starless and prestellar cores in this sample, we assume a value for of , as recommended by (Henning et al.1995), and scale this to 850 m using a canonical value of of 1.5 (André & Montmerle, 1994), giving . These values of assume a gas-to-dust ratio of 100 (Hildebrand, 1983). For the denser envelopes around Class 0 and I protostars, it is assumed that the formation of icy mantles will increase the by a factor (André & Montmerle, 1994; , Henning et al.1995). Again, a canonical of 1.5 is used, giving a value of for these classes of object. For the higher density circumstellar disks surrounding Class II YSOs, grain agglomeration will increase still further (, Henning et al.1995). Beckwith et al. (1990) found that the best fits to the submillimetre spectra of T-Tauri stars are given by and . These values correspond to .
The temperature of 12 K calculated for L1689B (, Ward-Thompson et al.2002) was used for all of the prestellar and starless cores. For protostellar envelopes, the volume averaged dust temperature is assumed to be 30 K (André & Montmerle, 1994).
5 Comparison of L1689 with L1688
5.1 Cloud constituents
It is interesting to compare the L1688 and L1689 clouds, as they share the same environment, yet previous studies have indicated that L1688 has a much higher level of star formation (e.g. Loren et al., 1990). Loren (1989) measured the mass of L1688 and L1689 from 13CO maps to be 1447 and 566 M⊙ respectively, differing by a factor of 2.6. The area on the sky of L1688 (measured at the 6 K contour of the 13CO maps — see Fig. 1) is 1.4 times larger than L1689. Assuming that the two clouds have approximately the same aspect ratio (which is a fair assumption, given their similar morphology), the volume of L1688 is 1.7 times that of L1689. The average density of L1688 is therefore approximately 1.5 times larger than that of L1689. As a result of this, we might expect star formation in L1688 to proceed more rapidly than in L1689.
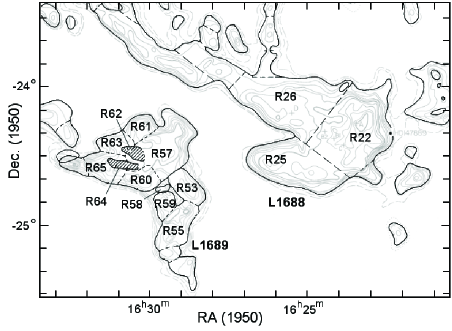
Loren (1989) divided the two clouds into 89 different regions, which have a clear spatial or velocity separation. These regions are used in the following analysis to compare the star-formation activity across the clouds. Fig. 7 shows the region boundaries overlaid on the 13CO contour map. The names of the regions that have been mapped in the submillimetre are marked on Fig. 7 (see below).
Loren et al. (1990) investigated differences in the star-formation rates of the different regions of the Ophiuchi cloud. To do this, they compared the total luminosity () of the young stars associated with each region, with the mass () of the gas, determined using the 13CO measurements (Loren, 1989). They measured values of of for L1688 and for L1689, indicating a much larger star-formation efficiency (SFE) in L1688. This method of estimating the SFE is biased towards high mass stars. Loren et al. (1990) also calculated the ratio , where is the number of young stars associated with each region. This estimate of the SFE is biased towards low mass stars. They again found that of all of the components of Ophiuchi, L1688 has the highest SFE, with a value of of 0.06. However, the value of of 0.05 for L1689 is only slightly lower.
These methods are both probes of the past star-formation activity in the two clouds. In the following section, we look at the mass of the material currently involved in star formation within each region of the two clouds, in order to compare the current star-formation activity.
| Cloud | ||||
| Name | Region | (M⊙) | (M⊙) | |
| L1688 | R22 | 557 | 16.4 | 0.029 |
| R25 | 243 | 0.6 | 0.002 | |
| R26 | 136 | 0.2 | 0.001 | |
| Total | 936 | 17.2 | 0.018 | |
| L1689 | R53 | 40 | 1.3 | 0.033 |
| R55 | 55 | 1.4 | 0.025 | |
| R57 | 133 | 0.1 | 0.0008 | |
| R58 | 1 | 0 | 0 | |
| R59 | 15 | 0 | 0 | |
| R60 | 20 | 0 | 0 | |
| R61 | 7 | 0 | 0 | |
| R62 | 7 | 0 | 0 | |
| R63 | 13 | 0 | 0 | |
| R64 | 4 | 0 | 0 | |
| R65 | 26 | 0.3 | 0.012 | |
| Total | 321 | 0.010 |
5.2 Star-formation efficiency
Johnstone et al. (2000) mapped the densest parts of the L1688 cloud using the SCUBA camera on the JCMT. Together with the data presented here, these make an ideal dataset to compare the current star-formation activity of the two clouds. Johnstone et al. smoothed their map of L1688 by twice the largest chop throw (130 arcsec), and subtracted this from the map. This was done in order to remove all large scale structure, some of which could result from residual atmospheric noise or incorrectly fitted baselines in the data reduction process.
For the purposes of directly comparing the two datasets, we carried out the same step, and subtracted the large scale structure. In the following analysis, all the core masses are calculated assuming a distance to the region of 130 pc, and a dust temperature of 20 K. Again, this is to allow a direct comparison of the two data-sets.
The sensitivities of the two surveys are not significantly different. The SCUBA map of L1688 has a sensitivity of approximately 10 mJy/beam (Johnstone et al., 2000), compared to our map of L1689, which has a sensitivity of 15 – 30 mJy/beam (see Table 2).
The SCUBA map of L1689 presented here covers most of the 13CO regions named by Loren (1989) between R53 and R65 (see Table 5 and Figure 7). The area covered by the SCUBA map of L1688 is approximately coincident with R22. The SCUBA map also covers the portion of R25 that is coincident with -Oph F (see Loren & Wootten, 1986; Loren et al., 1990). Though this region was not completely mapped by Johnstone et al. (2000), a wider area survey of Ophiuchus (, Johnstone et al.2004) has indicated that there is very little star-formation activity in R25 except that contained in -Oph F.
The SCUBA map of L1688 does not include the -Oph D core in R26, therefore data obtained using the IRAM 30m telescope (, Motte et al.1998) were used to extend the following analysis to this region. separated the IRAM data into large and small scale structure using a wavelet analysis. We use the core masses for their small scale ‘clumps’ (see their table 2), which, like the Johnstone et al. (2000) data, have effectively had the larger scale structure removed. For consistency with the other data-sets, we also scale the R26 core masses to a temperature of 20 K and a distance of 130 pc.
Table 5 gives the mass of each cloud region, measured from the 13CO emission (Loren, 1989). The total mass of prestellar and starless cores within each region () is given in column 4. This is calculated from the submillimetre dust emission from the cores in L1688 (, Motte et al.1998; Johnstone et al., 2000) and L1689. The cores that contain protostellar sources have not been included in these values. This is so we can evaluate and compare the potential yield of the next generation of star formation in the two clouds.
Table 5 shows that the current star-formation activity is highly variable across both clouds. R22 has the largest mass of dense cores, with 16 M⊙ compared to M⊙ in each of the regions of L1689. This may be reasonably expected, as the R22 region is significantly more massive than the other regions. In order to compare the fraction of the mass in dense cores in the different regions directly, we divide the mass in cores by the mass of the region, measured from 13CO maps (Loren, 1989). This is given for each region in column 5 of Table 5.
When the two clouds (L1688 and L1689) are considered as a whole, L1688 has a much higher fraction (by a factor of 2) of its mass contained in dense cores, with a value of of 0.018, compared to 0.010 for L1689. Even if we ignore the regions of L1689 that contain no submillimetre cores, and only consider R53, R55, R57 & R65, the total prestellar core mass ratio for L1689 only rises to 0.012. This is still only two-thirds of the value seen in L1688. This indicates that L1688 will probably have a higher star formation efficiency in the next generation of star formation.
However, the values of for the most active regions of the two clouds (i.e. R22 in L1688 and R53 & R55, which make up Filament 1 in L1689) are in fact similar (although the absolute masses are much smaller in R53 and R55). This could be indicating that parts of L1689 may not be as infertile as was previously thought. We note that these three regions are located at the western edges of L1688 and L1689. We consider the significance of this in the following section.
We finally note that the fraction of prestellar material in -Oph A (see Loren & Wootten, 1986; Loren et al., 1990) is an order of magnitude higher than in the rest of R22 (in agreement with , Motte et al.1998). To calculate this, we compared the mass of compact submillimetre condensations in -Oph A (Johnstone et al., 2000) with the mass measured using C18O (see Wilking & Lada, 1983, their table 2 and fig. 4).
To summarise this section, we have found that on average, the L1688 cloud has a much higher fraction of its mass in dense cores than L1689. The western edges of both L1688 (R22) and L1689 (filament 1) have comparable fractions. -Oph A is significantly more efficient at converting its mass into dense cores than any other component of the molecular cloud, and it appears likely that the existing young star cluster will continue to grow in richness. The regions to the east of both clouds have a much lower mass fraction in dense cores.
5.3 Sequential star formation
One possible explanation for the picture painted in the previous section is that the star formation in both of the clouds is being affected by an external influence, such as the by-products of nearby young massive stars. This scenario is known as sequential or triggered star formation, and was first suggested by Elmegreen & Lada (1977).
In this picture, the stars which have already formed, interact with the molecular cloud, triggering further star formation, which propagates through the cloud. This scenario has previously been used to explain the star formation in Oph (e.g. Loren & Wootten, 1986; Loren, 1989). In this case, we believe that the star formation in both L1688 and L1689 is being influenced by members of the Upper Scorpius OB association.
The most massive and luminous nearby component of the Upper Scorpius OB association is Sco. This is a hierarchical multiple containing an O9V star and a B2III star and at least two other B stars (e.g. Pigulski, 1992). Sco lies at a distance of 100 arcmin from L1688 (projected distance 4 pc), and 150 arcmin from L1689 (projected distance 6 pc). It appears to be a prime candidate for the triggering mechanism in both of these clouds.
This hypothesis is consistent with the observation that the majority of the star formation in both clouds is occurring primarily in regions R22, R53 & R55, which make up parallel filaments at the edge of each cloud closest to Sco. These filaments are perpendicular to the line of sight joining each cloud and Sco. In addition, the extensions of both L1688 and L1689 to the north-east lie on a line directly away from Sco (Loren, 1989). In this hypothesis, the eastern regions of the two clouds are shielded from the triggering source by the two filaments. We note that R57 is unusual in that it is located on the western edge of L1689, yet has a very small value of . However, R57 has recently formed the protostellar sources SMM 19 & 20, and if the mass associated with these sources is included, then the fertility of R57 becomes comparable with the regions of Filament 1.
The influence of Sco has clearly had a different effect on the two clouds, as is evidenced by the young proto-cluster that has formed in L1688, and the lack of such a cluster in L1689. We hypothesise that this difference in star-formation activity in the two clouds is simply due to the fact that L1688 is closer to Sco. Hence it suffers a greater effect according to the square of the distance difference.
The sequential star formation in this region can be traced back a number of generations. The Upper Scorpius OB association is adjacent to an older OB association called Upper Centaurus-Lupus. Preibisch & Zinnecker (2001) suggest that the massive stars in Upper Centaurus-Lupus triggered the star formation in Upper Scorpius, just as Upper Scorpius is triggering star formation in Oph. It appears though that this is the end of the line for sequential star formation, as the only massive star to have formed in L1688 or L1689 is the young B3 star S1 (Grasdalen, Strom, & Strom, 1973). It is therefore unlikely that this star will have the energy required to propagate the star formation as effectively through the remainder of the Ophiuchi cloud in the same way.
6 Conclusions
We have mapped the L1689 cloud at submillimetre wavelengths, and detected a number of cores and protostellar envelopes, some of which are reported here for the first time. We have detected filaments in the submillimetre continuum that are also seen in the 13CO observations of the cloud. All of the detected star-formation activity in L1689 is contained within these filaments, the majority being in Filament 1.
We have compared the potential future rate of star formation of L1689 with that of L1688 by looking at the fraction of mass of each cloud that is currently in starless and prestellar cores. We find that when normalised to the total mass of each cloud, the L1688 cloud has on average a much higher percentage of mass in cores. This is consistent with the higher star-formation activity observed in L1688.
We deduce that L1688 and L1689 are both examples of triggered star formation caused by Sco and the reason that the L1689 dog has not barked is that it is less massive than L1688 and is further away from Sco.
Acknowledgements
The authors wish to thank the referee, Doug Johnstone, for comments which improved this manuscript. The authors would also like to thank the staff of the JCMT for assistance with the observations. The JCMT is operated by the Joint Astronomy Centre, Hawaii, on behalf of the UK PPARC, the Netherlands NWO, and the Canadian NRC. DJN acknowledges PPARC for PDRA support.
The Digitized Sky Survey was produced at the Space Telescope Science Institute under U.S. Government grant NAG W-2166. The images of these surveys are based on photographic data obtained using the Oschin Schmidt Telescope on Palomar Mountain and the UK Schmidt Telescope. The plates were processed into the present compressed digital form with the permission of these institutions.
The authors acknowledge the use of NASA’s SkyView facility (http://skyview.gsfc.nasa.gov) located at NASA Goddard Space Flight Center. The authors also gratefully acknowledge R. Loren for permission to use the 13CO maps in Figures 1, 2, 6 and 7.
References
- André & Montmerle (1994) André P., Montmerle T., 1994, ApJ, 420, 837
- Andre, Montmerle, & Feigelson (1987) Andre P., Montmerle T., Feigelson E. D., 1987, AJ, 93, 1182
- (3) André P., Ward-Thompson D., Barsony M., 1993, ApJ, 406, 122
- (4) André P., Ward-Thompson D., Motte F., 1996, A&A, 314, 625
- (5) André P., Ward-Thompson D., Barsony M., 2000, in Mannings V., Boss A., Russell S. S., eds, Protostars and Planets IV. Univ. Arizona Press, p. 59
- Archibald et al. (2002) Archibald E. N., et al., 2002, MNRAS, 336,1
- Bacmann et al. (2000) Bacmann A., André P., Puget J.-L., Abergel A., Bontemps S., Ward-Thompson D., 2000, A&A, 361, 555
- Beckwith et al. (1990) Beckwith S. V. W., Sargent A. I., Chini R. S., Guesten R., 1990, AJ, 99, 924
- Bertout et al. ( 1999) Bertout C., Robichon N., Arenou F., 1999, A&A, 352, 574
- Bonnor (1956) Bonnor W. B., 1956, MNRAS, 116, 351
- Bontemps et al. (2001) Bontemps S., et al., 2001, A&A, 372, 173
- Casanova et al. (1995) Casanova S., Montmerle T., Feigelson E. D., Andre P., 1995, ApJ, 439, 752
- Castets et al. (2001) Castets A., Ceccarelli C., Loinard L., Caux E., Lefloch B., 2001, A&A, 375, 40
- Ceccarelli et al. (1998) Ceccarelli C., et al., 1998, A&A, 331, 372
- Correia et al. ( 2004) Correia J. C., Griffin M., Saraceno P., 2004, A&A, 418, 607
- Ebert (1955) Ebert R., 1955, ZA, 37, 217
- Elmegreen & Lada (1977) Elmegreen B. G., Lada C. J., 1977, ApJ, 214, 725
- Emerson (1995) Emerson D. T., 1995, in ASP Conf. Ser. 75, Multifeed Systems for Radio Telescopes, ed. D. T. Emerson & J. M. Payne (San Francisco: ASP), 309
- Grasdalen, Strom, & Strom (1973) Grasdalen G. L., Strom K. M., Strom S. E., 1973, ApJ, 184, L53
- Greene et al. (1994) Greene T. P., Wilking B. A., André P., Young E. T., Lada C. J., 1994, ApJ, 434, 614
- (21) Henning T., Michel B., Stognienko R., 1995, P&SS, 43, 1333
- Hildebrand (1983) Hildebrand R. H., 1983, QJRAS, 24, 267
- Jenness & Lightfoot (2000) Jenness T., Lightfoot J.F., 2000, Starlink User Note 216, Starlink Project, CCLRC
- Johnstone et al. (2000) Johnstone D., Wilson C. D., Moriarty-Schieven G., Joncas G., Smith G., Gregersen E., Fich M., 2000, ApJ, 545, 327
- (25) Johnstone D., Di Francesco J., Kirk H., 2004, ApJ, 611, L45
- (26) Kirk J. M., Ward-Thompson D., André P., 2005, MNRAS, 360, 1506
- Lada (1987) Lada C. J., 1987, IAUS, 115, 1
- Lasker (1994) Lasker B. M., 1994, IAUS, 161, 167
- Loren (1989) Loren R. B., 1989, ApJ, 338, 902
- Loren & Wootten (1986) Loren R. B., Wootten A., 1986, ApJ, 306, 142
- Loren et al. (1990) Loren R. B., Wootten A., Wilking B. A., 1990, ApJ, 365, 269
- Lynds (1962) Lynds B. T., 1962, ApJS, 7, 1
- Martin et al. (1998) Martin E. L., Montmerle T., Gregorio-Hetem J., Casanova S., 1998, MNRAS, 300, 733
- McGlynn & Scollick (1994) McGlynn T., Scollick K., 1994, ASPC, 61, 34
- (35) Motte F., André P., Neri R., 1998, A&A, 336, 150
- Mundy et al. (1992) Mundy L. G., Wootten A., Wilking B. A., Blake G. A., Sargent A. I., 1992, ApJ, 385, 306
- Myers & Benson (1983) Myers P. C., Benson P. J., 1983, ApJ, 266, 309
- Ossenkopf & Henning (1994) Ossenkopf V., Henning T., 1994, A&A, 291, 943
- Pigulski (1992) Pigulski A., 1992, A&A, 261, 203
- Preibisch & Zinnecker (2001) Preibisch T., Zinnecker H., 2001, ASPC, 243, 791
- Sandell (1994) Sandell G., 1994, MNRAS, 271, 75
- Stark et al. (2004) Stark R., et al., 2004, ApJ, 608, 341
- Stine et al. (1988) Stine P. C., Feigelson E. D., Andre P., Montmerle T., 1988, AJ, 96, 1394
- Wakelam et al. (2004) Wakelam V., Castets A., Ceccarelli C., Lefloch B., Caux E., Pagani L., 2004, A&A, 413, 609
- Walker, Carlstrom, & Bieging (1993) Walker C. K., Carlstrom J. E., Bieging J. H., 1993, ApJ, 402, 655
- Ward-Thompson et al. (2006) Ward-Thompson D., André P., Crutcher R. M., Johnstone D., Onishi T., Wilson C., 2006, in: ‘Protostars and Planets V’, in press
- (47) Ward-Thompson D., André P., Kirk J. M., 2002, MNRAS, 329, 257
- Ward-Thompson et al. (1989) Ward-Thompson D., Robson E. I., Whittet D. C. B., Gordon M. A., Walther D. M., Duncan W. D., 1989, MNRAS, 241, 119
- Ward-Thompson et al. (1994) Ward-Thompson D., Scott P. F., Hills R. E., André P., 1994, MNRAS, 268, 276
- Wilking & Lada (1983) Wilking B. A., Lada C. J., 1983, ApJ, 274, 698
- Wilking et al. ( 1989) Wilking B. A., Lada C. J., Young E. T., 1989, ApJ, 340, 823
- Wootten (1989) Wootten A., 1989, ApJ, 337, 858