11email: danica@astrophysik.uni-kiel.de 22institutetext: Institute of Astronomy, University of Vienna, Türkenschanzstr. 17, A-1180 Vienna, Austria
22email: hensler@astro.univie.ac.at
Chemical Self-Enrichment of Hii Regions by the Wolf-Rayet Phase of an star
It is clear from stellar evolution and from observations of WR stars that massive stars are releasing metal-enriched gas through their stellar winds in the Wolf-Rayet phase. Although Hii region spectra serve as diagnostics to determine the present-day chemical composition of the interstellar medium, it is far from being understood to what extent the Hii gas is already contaminated by chemically processed stellar wind. Therefore, we analyzed our models of radiative and wind bubbles of an isolated star with solar metallicity (Kröger et al. 2006) with respect to the chemical enrichment of the circumstellar Hii region. Plausibly, the hot stellar wind bubble (SWB) is enriched with during the WN phase and even much higher with and during the WC phase of the star. During the short period that the star spends in the WC stage enriched SWB material mixes with warm Hii gas of solar abundances and thus enhances the metallicity in the Hii region. However, at the end of the stellar lifetime the mass ratios of the traced elements N and O in the warm ionized gas are insignificantly higher than solar, whereas an enrichment of above solar is found for C. Important issues from the presented study comprise a steeper radial gradient of C than O and a decreasing effect of self-enrichment for metal-poor galaxies.
Key Words.:
galaxies: evolution – Hii regions – hydrodynamics – instabilities – ISM: bubbles – ISM: structure1 Introduction
Hii regions are considered as the most reliable targets for the determination of the present-day abundances in the Interstellar Medium (ISM). Nevertheless, heavy elements are released by massive stars into their surrounding Hii regions. The knowledge of its amount is of particular interest for the observation of very metal-poor galaxies. Kunth & Sargent (1986) e.g. discussed the problem of determining the heavy-element abundance of very metal-poor blue compact dwarf galaxies from emission lines of Hii regions in the light of local self-enrichment by massive stars. This can happen during two stages in their evolutionary course: In the Wolf-Rayet (WR) stage, when the stellar wind has peeled off the outermost stellar layers, and by supernovae of type II (SNeII). Because of their energetics, stellar winds and SNeII contribute their gas to the hot phase. Therefore, it is of high relevance for observations and the addressed question of the presented exploration to study the amount to what it can be mixed into the diagnosed Hii regions.
As discussed by Chiosi & Maeder (1986), massive stars with an initial mass greater than evolve into WR stars with enhanced mass-loss rates and chemically enriched stellar winds.
Abbott & Conti (1987) concluded from stellar evolution models that WR winds strongly contribute to the Galactic enrichment of 4He, 12C, 17O, and 22Ne, while contributing only moderately to the enrichment of 14N, 26Mg, 25Mg, and 16O.
For metallicities less than solar two effects reduce the heavy element release by WR stars: First, the lower the metallicity the more massive a star has to be to evolve through the WR stages. Therefore, the number of WR stars decreases with decreasing metallicity. Schaller et al. (1992, hereafter SSMM) found that with metallicity the minimal initial H-ZAMS mass for a WR star is . At the minimal initial mass is . Second, the lower the metallicity the shorter are the WR lifetimes, and not all WR stages are reached. At solar metallicity WR stars enter all three WR stages (WNL, WNE, WC), whereas at only the WNL phase is reached (SSMM). The WR lifetime of an star, e.g., is at and at (SSMM).
That WR stars play an important role for carbon enrichment of the ISM at solar metallicity was shown by Dray et al. (2003). Their models predict that the C enrichment by WR stars is at least comparable to that by AGB stars while the enrichment of N is dominated by AGB stars and the O enrichment is dominated by SNeII. At other metallicities Dray & Tout (2003) found an increase in carbon enrichment with increasing metallicity but a decrease in oxygen enrichment. The N enrichment by WR stars is negligible compared to that by other sources. Additionally, the total amount of N ejected by a WR star generally decreases with decreasing metallicity.
Hirschi et al. (2004, 2005) showed that the consideration of stellar rotation in the Geneva stellar evolution code increases the yields for heavy elements by a factor of for stars between . For the more massive stars rotation raises the yields of and other H-burning products like , but the yields of He-burning products like are smaller. Additionally, for stars with , the evolution differs from that of non-rotating stars by the following manner: Rotating stars enter the WR regime already in the course of their main-sequence.
As an extent to stellar evolution models mentioned above hydrodynamical simulations of radiation and wind-driven Hii regions can trace the spatial distribution of the elements ejected by the star, and, therefore, we can study the mixing of the hot chemically enriched stellar wind with the warm photoionized gas.
2 The model
We analyze the model of an star in a series of radiation and wind-driven Hii regions around massive stars (Freyer et al. 2003, 2006; Kröger et al. 2006, hereafter: Paper I, Paper II, Paper III) as described in Paper III. A description of the numerical method and further references are given in Paper I. The time-dependent parameters of the star with “standard” mass-loss and solar metallicity () during its H-MS and its subsequent evolution are taken from SSMM, who used the relative abundance ratios of Anders & Grevesse (1989) for the heavy elements.
An star with solar abundance enters its WN stage at an age of . The WR star enriches the combined SWB/Hii region with 12C, 14N, and 16O. In our 2D simulations we study the spatial distribution of these tracer elements inside the SWB/Hii region as well as their time-dependent mass ratios as , , and in two different temperature regimes: “warm” gas accounts for the gas of the Hii region, and “hot” gas, whose temperatures are reached inside the SWB. Additionally, for the Hii region diagnostic a degree of ionization of must be reached. The undisturbed ambient medium outside the Hii region as well as the material swept-up by the expanding Hii region are not counted since they are not ionized. The observable abundances of Hii regions are derived for the warm phase only.
The mass fractions of , , and in the circumstellar gas as well as of the star itself are initially set to the solar values, taken from Anders & Grevesse (1989), , , and , respectively, in relation to H.
3 Results
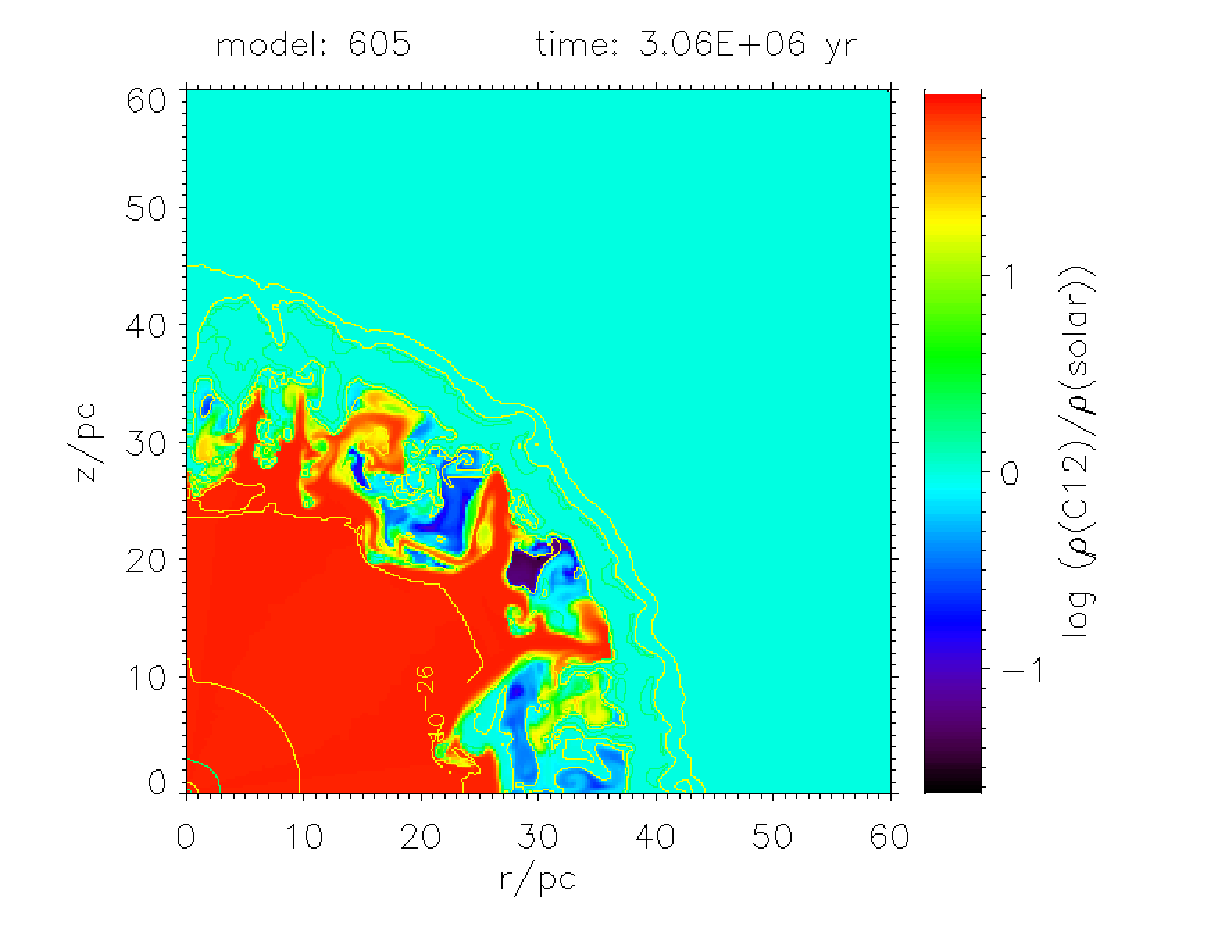
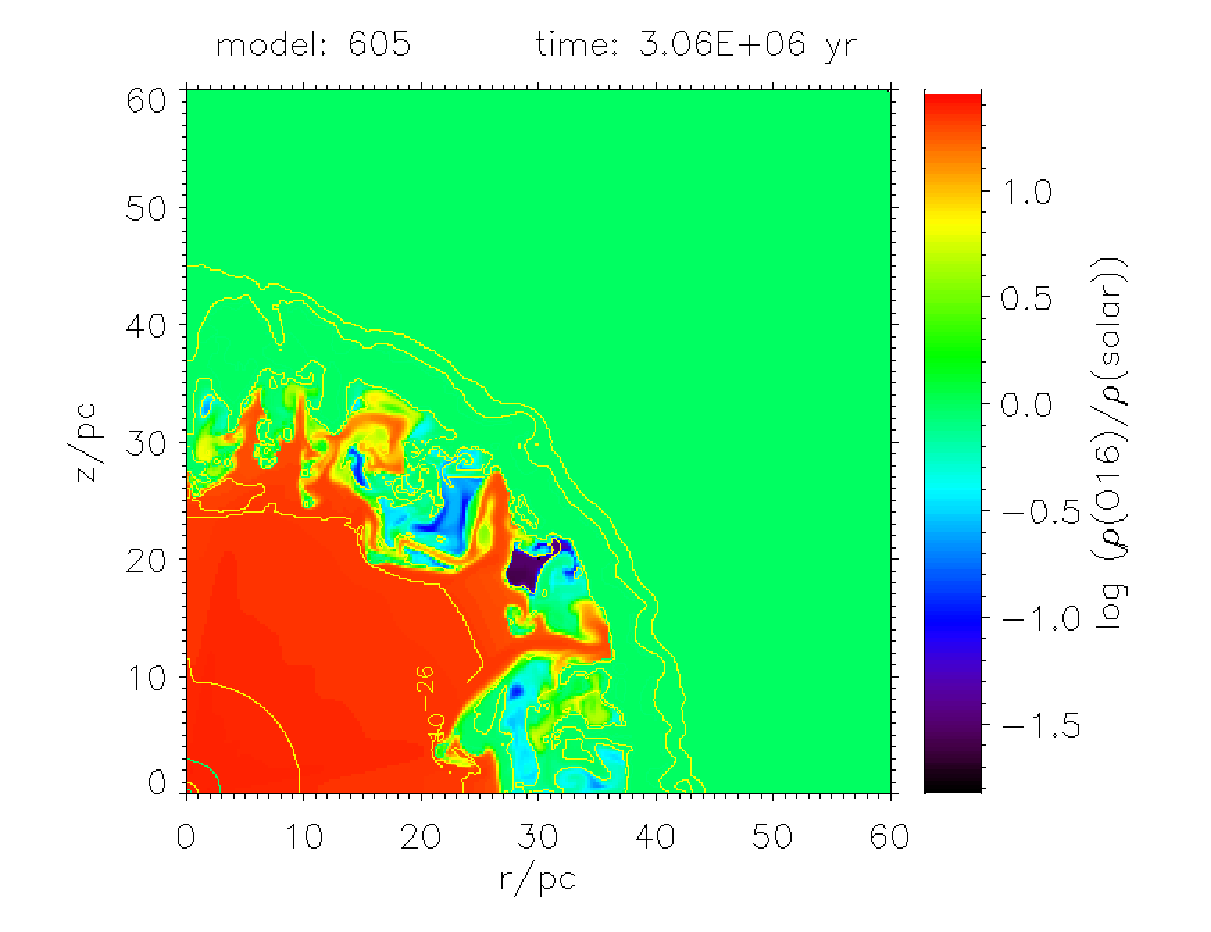
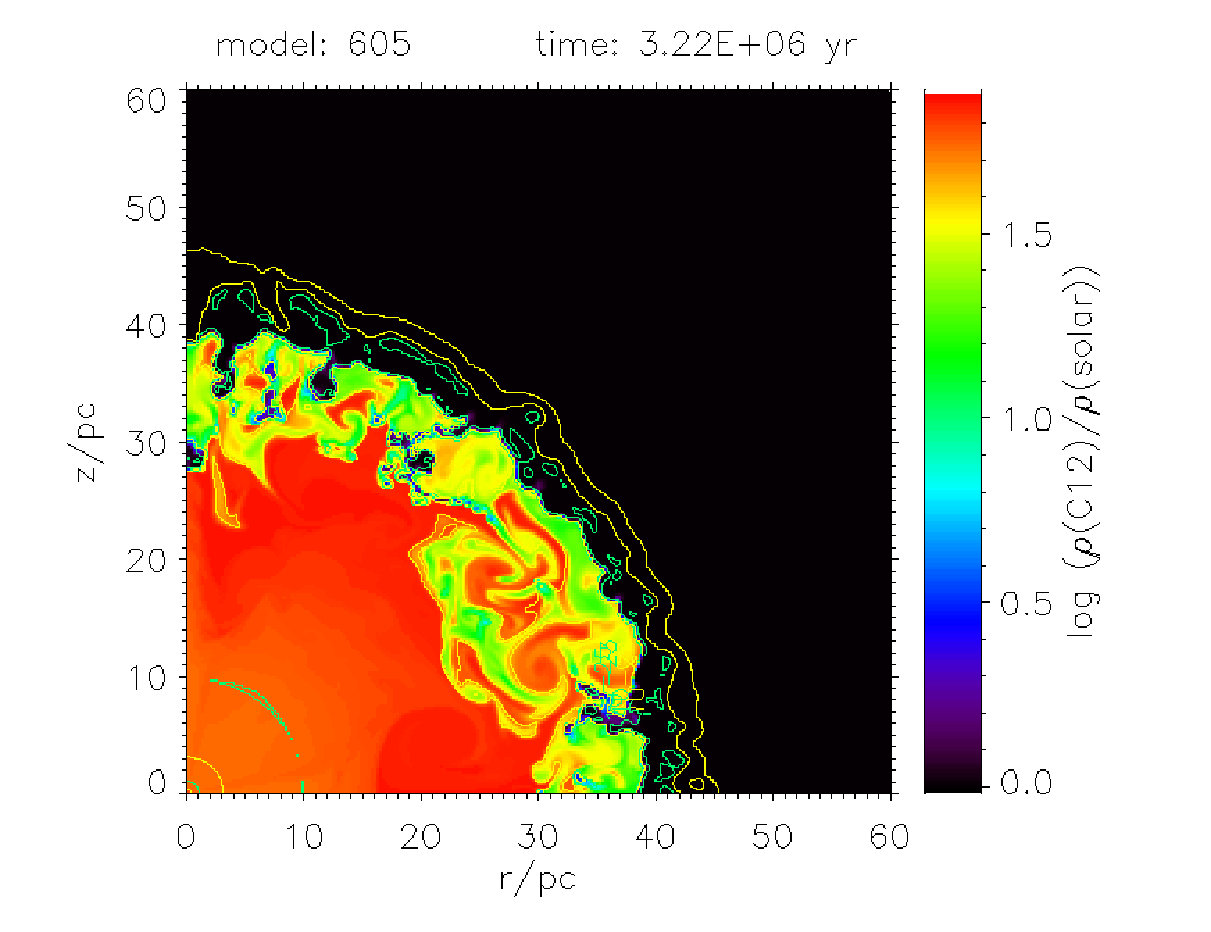
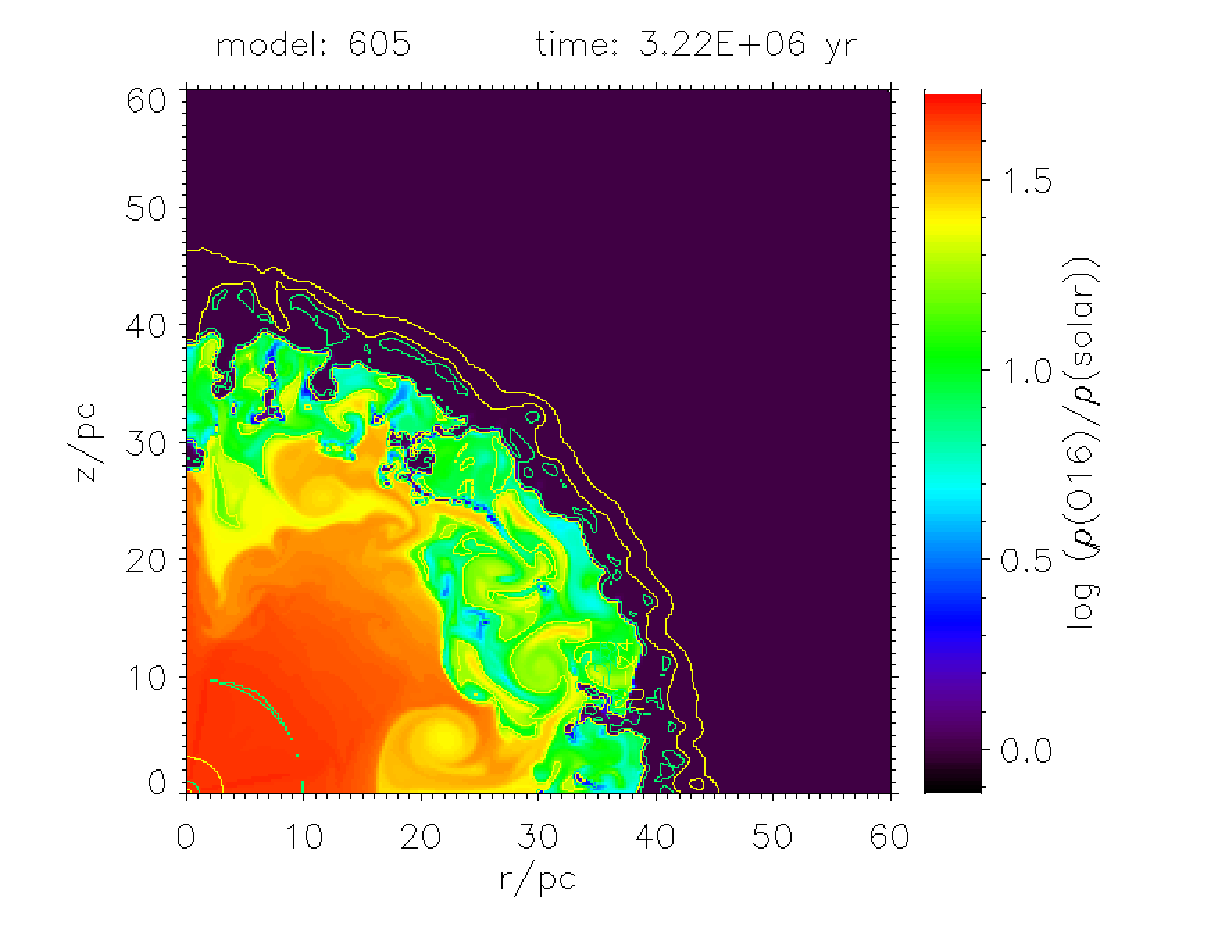
The spatial distribution of the tracer elements is shown as at different stages of stellar evolution, where “element” means (Fig. 1, middle column), (Fig. 1, left column), or (Fig. 1, right column), respectively. All plots cover the whole computational domain of . The gas density is overlaid as a contour plot. Before the onset of the WN phase, these density ratios are unity by definition. With the onset of the WN phase the combined SWB/Hii region is chemically enriched by the WR wind.
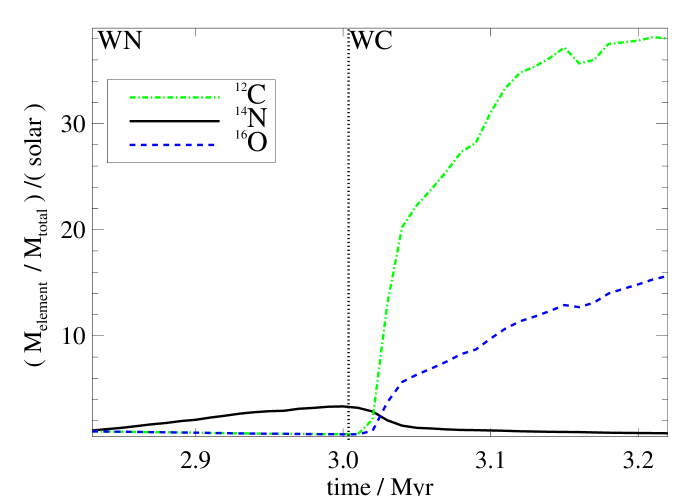
We study the temporal evolution of , , and , respectively, normalized to solar values in the two different temperature regimes of the combined SWB/Hii region: For the hot gas of the SWB the mass ratios are depicted in Figure 2. Figure 3 shows it for the “warm” Hii gas (see § 2).
3.1 Chemical enrichment of the stellar wind bubble
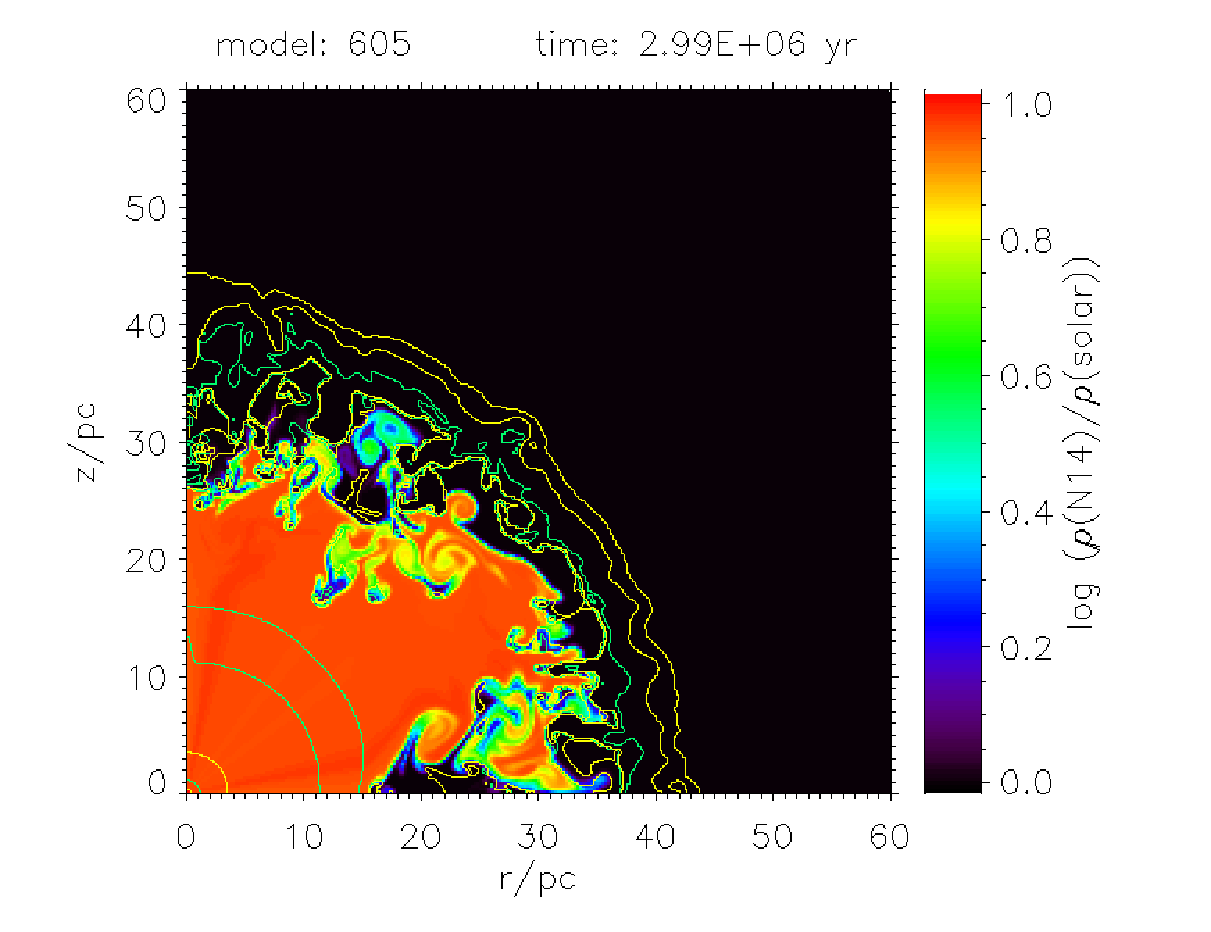
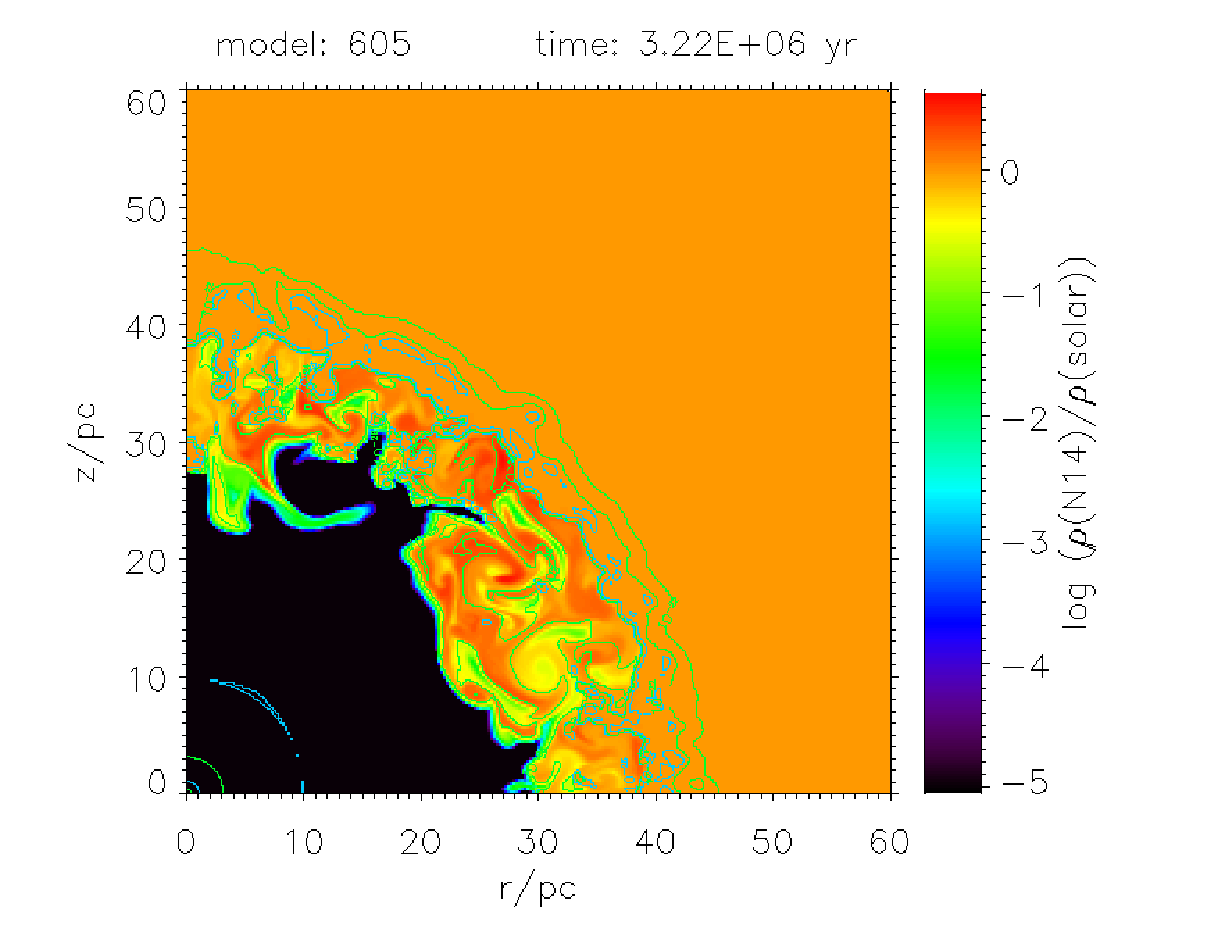
In the hot gas of the SWB the abundance of at (close to the end of the WN phase, Fig. 1, upper left plot) that lasts only for , reaches values in the range of . is distributed in the whole SWB except in the Hii material enveloped by the SWB. and can be found at the same places, but their concentration is as low as and .
During its WN phase the star releases of , which is more than half of its total release, but almost no extra or is supplied.
With the onset of the WC phase at the release ends and the main enrichment of the SWB with and starts. Due to the beginning WC phase with its high mass-loss rates and high terminal wind velocity the previously ejected material in the SWB including the emitted is compressed into a shell-like structure. Therefore, after and are distributed in the whole SWB and can mostly be found in an expanding shell (see lower left plot of Fig. 1, at ). The density contour line at a radius of in the upper middle and upper right plots of Fig. 1 () marks the position of the reverse shock which borders the free-flowing wind zone. At the radius of the reverse shock has reached its biggest extent.
During this evolutionary phase (see upper middle and upper right plots in Fig. 1, at ) the star ejects large amounts of and : The value reaches inside the highly enriched SWB and the maximum value is .
At the end of its lifetime at the star has supplied of , of , and of , which are contained in the combined SWB/Hii region. This situation is shown in the lower plots of Fig. 1. The reverse shock is now located at a radius of , the hot gas of the SWB fills the area up to a radius of . Almost all of the ejected , , and is located in the SWB’s volume.
In the outer zones of the SWB the highest abundance of (see lower middle plot of Fig. 1) is locally reached with . For radii the value is .
The ratio (Fig. 1, lower left) reaches in the outer zones of the SWB, where the material ejected during the WN phase is located. In the inner parts of the SWB only and can be found.
The maximum of the value (Fig. 1, lower right) of is reached at radii . Within the outer parts of the SWB the values range from to , highly depending on the location, since the abundance within the embedded clumps differs from that of the hot SWB material.
The temporal evolution of the abundance in the hot gas phase is plotted in Fig. 2 as dash-dotted line. The plot starts at , when the WN phases are reached. Additionally, the onset of the WC phase at is indicated. During the WN phase the stellar parameters (SSMM) specify the abundance of the WR wind to about solar. Due to the mixing of the WR wind with the main-sequence wind the averaged mass ratio in the hot gas of the SWB is only times solar during the WN and early WC phase. The enrichment starts with the onset of the WC phase. After the newly ejected material passed the reverse shock the abundance in the hot gas reaches times the solar value at . This value increases further to times solar at the end of the stellar lifetime.
The abundance is depicted in Fig. 2 as solid line. It rises as the enriched free-floating stellar wind passes the reverse shock, where the material is heated to several . Since in the WC stage the stellar wind contains no , the abundance in the hot SWB decreases strongly after it reached its maximum value of times solar at . At the end of the stellar lifetime the abundance in the hot gas phase is only times solar.
Because the enrichment with starts together with at the onset of the WC phase and due to the high mass-loss rate in the WC phase the O-abundance in the hot gas phase rises steeply after the material passed the reverse shock. After the mass ratio in the hot gas becomes supersolar and increases until the end of the stellar lifetime up to times solar.
3.2 Chemical enrichment of the Hii region
During the WR phases of the star the SWB expands into the surrounding Hii region without being bordered by a shock front. Therefore, the hot SWB gas structures the Hii region and encloses Hii gas which is thus compressed into clumps. This embedded Hii material contributes to the warm gas phase as well as the Hii layer around the SWB.
At the end of the stellar lifetime the abundance (lower middle plot in Fig. 1) in the Hii layer reaches a local maximum of . It contains a small fraction of , the values there are up to (Fig. 1, lower left). The values (Fig. 1, lower right) range from 0 to .
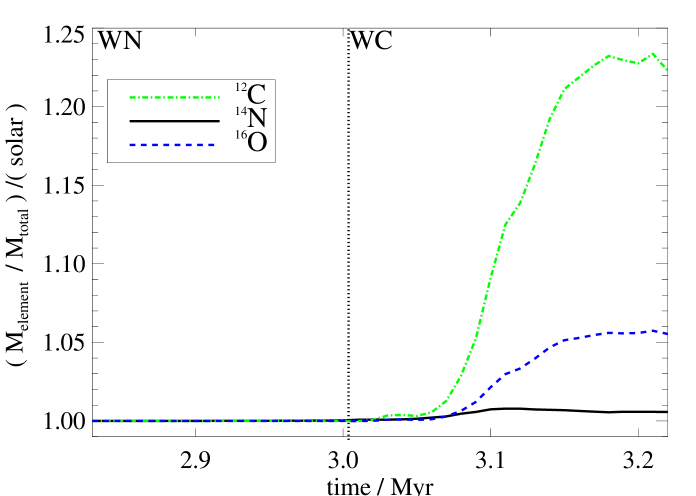
The temporal evolution of the abundance is plotted as dash-dotted line in Fig. 3. As in Fig. 2, the plot starts with the beginning of the WN phases, the vertical dotted line indicates the onset of the WC phase. In the warm Hii gas the averaged abundance reaches supersolar values after , thus the enriched material needs about for its way from the stellar surface, through the SWB, until it reaches the Hii region and mixes with the warm Hii gas. It rises steeply until reaching a value of times solar at and is times solar at .
The mass fraction (solid curve in Fig. 3) in the warm gas phase rises to supersolar values after when the has passed the SWB and cools down to Hii temperatures. As discussed for Fig. 1, after the -enriched material can only be found in the shell-like structure in the outer zones of the SWB. The abundance in the warm Hii gas reaches its maximum of times solar at and has a value of times solar at the end of the stellar lifetime.
For the warm gas the mass ratio is given as dashed line in Fig. 3. Like it reaches supersolar values after . Until the end of the stellar lifetime it increases slightly but reaches only times the solar value at .
4 Discussion
This chemical analysis of the wind and radiation-driven Hii region around an star with solar metallicity provides first quantitative conclusions to what extent the C, N, O-enriched WR winds contribute to the observable abundances of the surrounding Hii region.
When comparing the C, N, O abundances in our simulation with observed values, one has to take into account that the overall lifetime as well as the WR lifetime of the star are extremely short compared to less massive stars. Also, the choice of the stellar parameters of SSMM influences our results, since other evolutionary tracks would provide other WR lifetimes as well as other mass-loss rates (see, e.g., Paper III).
At the end of the stellar lifetime, the abundance in the warm gas phase amounts to above solar, whereas we find only supersolar for , and supersolar for . These values measured in the warm gas phase are the quantities which should be compared with observed Hii regions’ emission spectra.
On the other hand, the hot gas of the WR wind bubble is highly enriched with and since the onset of the WC phase, while it was significantly enriched with during the preceeding WN phase.
From these models we conclude that the enrichment of the circumstellar environment with and by WR stars might be negligible if the star is representative for massive stars passing the WR stage. Only for the enrichment of the Hii gas is significant.
Since the occurrence of a WR phase is strongly metal dependent the enrichment with C should also depend on metallicity like e.g. on O. One should therefore expect that the C gradient of Hii regiones in galactic discs is steeper than that of O. And indeed, Esteban et al. (2005) found for the Galactic disk.
In metal-poor galaxies one would expect less chemical self-enrichment because the stellar mass range of the WR occurrence is shrinked and shifted towards higher masses and the WR phases are shorter.
References
- Abbott & Conti (1987) Abbott, D. C. & Conti, P. S. 1987, ARA&A, 25, 113
- Anders & Grevesse (1989) Anders, E. & Grevesse, N. 1989, Geochim. Cosmochim. Acta, 53, 197
- Chiosi & Maeder (1986) Chiosi, C. & Maeder, A. 1986, ARA&A, 24, 329
- Dray & Tout (2003) Dray, L. M. & Tout, C. A. 2003, MNRAS, 341, 299
- Dray et al. (2003) Dray, L. M., Tout, C. A., Karakas, A. I., & Lattanzio, J. C. 2003, MNRAS, 338, 973
- Esteban et al. (2005) Esteban, C., García-Rojas, J., Peimbert, M., et al. 2005, ApJ, 618, L95
- Freyer et al. (2003) Freyer, T., Hensler, G., & Yorke, H. W. 2003, ApJ, 594, 888
- Freyer et al. (2006) Freyer, T., Hensler, G., & Yorke, H. W. 2006, ApJ, 638, 262
- Hirschi et al. (2004) Hirschi, R., Meynet, G., & Maeder, A. 2004, A&A, 425, 649
- Hirschi et al. (2005) Hirschi, R., Meynet, G., & Maeder, A. 2005, A&A, 433, 1013
- Kröger et al. (2006) Kröger, D., Freyer, T., & Hensler, G. 2006, A&A, in prep.
- Kunth & Sargent (1986) Kunth, D. & Sargent, W. L. W. 1986, ApJ, 300, 496
- Schaller et al. (1992) Schaller, G., Schaerer, D., Meynet, G., & Maeder, A. 1992, A&AS, 96, 269