photometry of the very old open cluster Berkeley 17††thanks: Based on observations made with the Italian Telescopio Nazionale Galileo (TNG) operated on the island of La Palma by the Fundación Galileo Galilei of the INAF (Istituto Nazionale di Astrofisica) at the Spanish Observatorio del Roque de los Muchachos of the Instituto de Astrofisica de Canarias.
Abstract
We have obtained CCD imaging of Berkeley 17, an anticentre open cluster that competes with NGC 6791 as the oldest known open cluster. Using the synthetic colour magnitude diagrams (CMD) technique with three sets of evolutionary tracks we have determined that its age is 8.5 - 9.0 Gyr, it distance modulus is = 12.2, with a reddening of = 0.62 - 0.60. Differential reddening, if present, is at the 5% level. All these values have been obtained using models with metallicity about half of solar (Z=0.008 or Z=0.01 depending on the stellar evolution tracks), which allows us to reproduce the features of the cluster CMD better than other metallicities. Finally, from the analysis of a nearby comparison field we think to have intercepted a portion of the disrupting Canis Major dwarf galaxy.
keywords:
Hertzsprung-Russell (HR) diagram – open clusters and associations: general – open clusters and associations: individual: Berkeley 17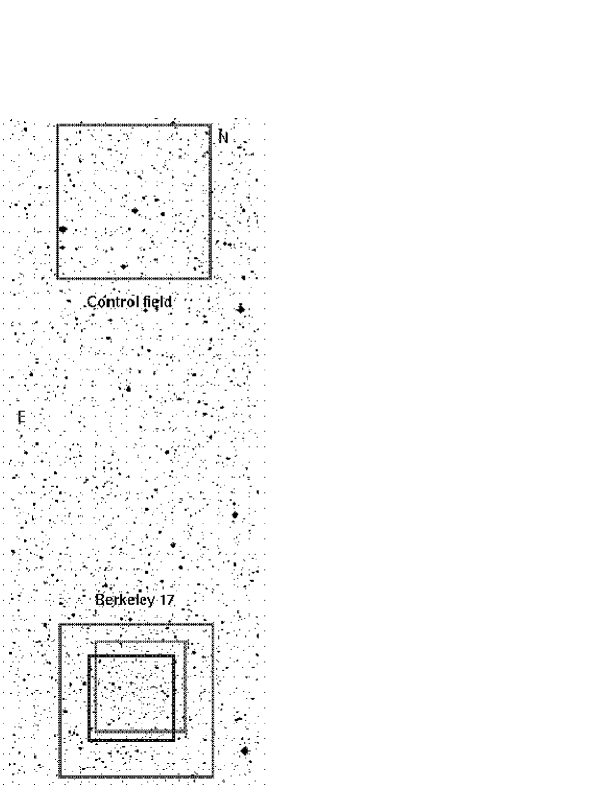
1 Introduction
It is generally accepted that open clusters (OCs) are among the best tracers of the properties, the formation and the evolution of the disc of our Galaxy (e.g., Friel 1995). This is particularly true for the oldest ones, since they could trace back the first moments of the disc lifetime and put crucial constraints on its formation mechanism(s) and early evolution.
Berkeley 17 is among the oldest OCs of the Galaxy, if not the oldest one. It is located at , , corresponding to the Galactic anticenter direction , . This cluster had not received much attention since its discovery by Setteducati & Weaver (1962) until 1994, when the almost contemporary works by Kaluzny (1994) (hereafter K94), Phelps, Janes, & Montgomery (1994) and Janes & Phelps (1994) definitely found it to be a very old object. The controversy on the actual age of Be 17 began immediately, since K94 stated that Be 17 is at least as old as NGC 6791, whose age he assumed to be 9 Gyr, while Phelps et al. (1994) and Janes & Phelps (1994) derived an age, based on the Morphological Age Indicator (MAI, see Sect. 3) of about 12 Gyr, i.e., similar to that of the youngest globular clusters (albeit with a large error bar). A very large age has been reiterated by Phelps (1997) (hereafter P97: 12 Gyr), but not fully confirmed by several other analyses (e.g., Carraro et al. 1998, 1999: Gyr; Salaris et al. 2004: Gyr; Krusberg & Chaboyer 2006: Gyr).
The very large age found by P97 would imply that the age distributions of open and globular clusters overlap, and that the disc began to form stars during the last phases of halo formation. On the contrary, if Be 17 is conclusively demonstrated to be younger than the youngest globular clusters (GCs), the existence of a hiatus between the formation of the halo/thick disc and the present thin disc would be reinforced. The latter is nowadays the most popular scenario for the formation of our Galaxy and is supported by many observational evidences (Freeman & Bland-Hawthorn, 2002).
Less dispute appears to exist about the metallicity of Be 17, that has been estimated to be slightly lower than solar by Friel et al. (2002), with [Fe/H]= dex, based on low resolution spectroscopy, and by Friel et al. (2005), with [Fe/H]= dex, based on high resolution spectroscopy of three giant stars. A slightly sub solar or at most nearly solar abundance is also found by photometric analyses, both in the optical and IR bands (see. e.g., P97; Carraro et al., 1998, 1999).
Even if its age is reduced to a value of 9-10 Gyr, Be 17 is a fundamental cluster because it defines the old tail of the OC population together with NGC 6791, from which it differs significantly. We are building a sample of homogeneously studied OCs well distributed in age, position and metallicity, that we intend to use to study the disc properties and evolution; see Bragaglia & Tosi (2006) for a detailed description of our program (that we named Bologna Open Cluster Chemical Evolution - or BOCCE - program) and its results. Such a sample cannot leave Be17 aside. We have obtained deep photometry that we present here and high resolution spectra of 3 red clump stars that will be the subject of a forthcoming paper. Medium resolution spectra of stars from the tip of the red giant branch to the main sequence are planned to determine membership of more than 100 stars in this crucial cluster.
The paper is organized as follows: we present our data in Section 2, we discuss the resulting CMDs in Section 3 and derive the fundamental cluster parameters using the synthetic CMDs method in Section 4; finally a discussion and a summary are given in Section 5.
2 Observations and data reduction
Observations of Be 17 and of the associated control field used to check the field stars contamination were obtained at the Telescopio Nazionale Galileo on UT 2000 October 1, 2, and 3. We used DOLORES (Device Optimized for the LOw RESolution), a focal reducer capable of imaging and low resolution spectroscopy, mounting a 2k Loral thinned and back-illuminated CCD, with scale of 0.275 arcsec/pix, and a field of view 9.4 9.4 arcmin2. The two fields, separated by about 30 arcmin, are shown in Fig. 1. The observations include several exposures in each of the three Johnson-Cousins’ filters. Table 1 lists the dates of the observations together with the filters used and the corresponding ranges of exposure time (in seconds). All the three nights were photometric, with a mean seeing value around 1.4.
| field | NV t | NB t | NI t |
|---|---|---|---|
| Cluster | 3600, 200, 60, 30, 10, 5 | 1800, 2900, 2600, 60 | 471, 400, 4300, 120, 220, 10, 5 |
| External | 2300, 10, 2 | 900, 300, 60, 10, 2 | 2300, 10, 1 |
Corrections for bias and flat-field were performed using the standard IRAF111IRAF is distributed by the National Optical Astronomical Observatory, which are operated by the Association of Universities for Research in Astronomy, under contract with the National Science Foundation procedures. The subsequent data reduction and analysis was done following the same procedure for both data-sets (cluster and comparison field), and using the DAOPHOT ii package in IRAF (Stetson, 1987; Davis, 1994). Objects have been independently searched in all the frames, using a threshold of 4 above the background, and have been measured with a quadratically varying point spread function (PSF). For each filter, the magnitudes have been aligned to that of a reference frame, the deepest one, obtained in the best seeing conditions. An average instrumental magnitude (weighted with the photometric errors) was derived in each filter. For the brightest stars, which are saturated in all frames but the shortest ones, only one measure was available. Finally, we applied aperture corrections (of the order of 0.2 - 0.3 mag) to the weighted instrumental PSF magnitudes in each band, to calibrate them on the same system of the standard stars. For the latter, magnitudes were derived using aperture photometry.
The final catalogs have been created including all the objects identified in at least two filters, after applying a moderate selection in the shape-defining parameter () and on the goodness-of-fit estimator (). To the two final catalogs, one for the cluster and one for the comparison field, we applied the transformation to astrometrize the and coordinates, using software written by P. Montegriffo at the Bologna Observatory.
2.1 Photometric calibration
Transformation from the instrumental to the standard system have been obtained using the standards areas PG0231+051 and MarkA (Landolt 1992), observed several times during the three nights. We derived the calibration equations using only the standard fields observed on the same nights of the reference frames (October 2 and 3). The 10 stars retained in our calibrations have colours and , thus covering the bulk of the cluster stars without need for extrapolation.
For the extinction coefficients we used the average between the values of these two nights222see www.ast.cam.ac.uk/dwe/SRF/camc_extinction.html and King (1985) (). The resulting calibration equations have the following form:
where , are the aperture corrected instrumental magnitudes, after correction also for extinction and exposure time, and are the output magnitudes, calibrated to the Johnson-Cousins standard system.
Finally, we determined our completeness level in each band using extensive artificial stars experiments: we iteratively added, one at a time, about 50000 simulated stars to the deepest frames and repeated the reduction procedure, determining the ratio of recovered over added stars (see Tosi et al. 2004 for a more detailed description). The results are given in Table 2.
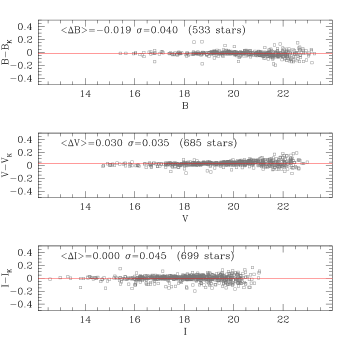
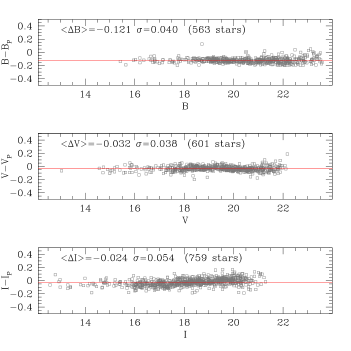
We checked the calibration comparing our photometry with that presented in previous literature (i.e., K94 and P97, which supersedes the one by Phelps et al. 1994, taken in non optimal weather conditions). To estimate the differences, we cross identified our objects with those of K94 and P97 (obtained through the BDA333 http://www.univie.ac.at/webda/new.html, Mermilliod 1995). We found (see Figs 2 and 3): , , for K94, where is intended as our magnitude minus the one by K94, and , , for P97. Even if in neither case there are strong trends with magnitude, the comparison looks better with K94. The differences are small, except for our B photometry compared to P97’s. The nights in which we observed the reference frames were deemed photometric, as was the case for the P97 observations (while K94 used the photometric part of a not completely photometric night), so we cannot easily explain this large difference.
These differences in magnitudes translate into differences in colours: , and , : we are bluer than both literature photometries in the plane; redder than K94 and almost identical to P97 in the plane. Since the simultaneous fit of the and colours is one of the indicators to select the most appropriate metallicity from the comparison with theoretical stellar models (see Section 4), such an uneven difference in the colours may affect the photometric metallicity choice.
We also compared the two photometries by K94 and P97 with each other, finding differences in agreement with what is given above; if we limit the comparison to stars brighter than as in P97 (their table 1), we find: , , and , based on about 280 stars in common. This means , . As already stated by P97, there are no direct means to decide which photometry is more precisely on the standard system (there are no stars with photoelectric measures in our fields), so we will proceed with our own data, without attempting any correction.
After all these comparisons were made, a new photometry has been presented (but is not yet available) by Krusberg & Chaboyer (2006). It appears of slightly lower quality than ours (e.g., the cluster sequences are less well defined) but, thanks to differential comparison with NGC 188, it is claimed to be on the standard Landolt system to within 0.03 mag. Interestingly, they too find their photometry bluer than the one by P97 by about 0.1 mag in (), providing further support to our calibration.


3 The colour - magnitude diagram
The final, calibrated sample of the cluster stars (that will be made available through the BDA) consists of 2473 objects identified in at least two filters, of which 1940 identified simultaneously in all the three filters .
The corresponding CMDs are shown in Fig. 4, where the mean errors per magnitude bin are also plotted. Both CMDs show: (i) a very clear main sequence (MS) extending down to V 24 for the CMD and to V 23 for the CMD; (ii) a main sequence turn-off (MSTO) near V = 18, with a sparsely populated red giant branch (RGB), extending more than three magnitudes above the TO. This morfology is typical of very old stellar systems for which the RGB raises very steeply and is very extended vertically, while the colour separation between the MSTO and the base of the RGB is smaller than in intermediate age clusters. The red clump (RC), including 8 stars, is visible at and , . This clump coincides with that identified by K94 and P97 and, in our opinion, is also apparent in Krusberg & Chaboyer (2006) CMD, in spite of these authors’ conclusion.
We have measured the difference in magnitude between the RC and the MSTO: . This, using the so called MAI (Janes & Phelps, 1994), implies an approximate age of 14.5 Gyr, but even the conservative error of 0.1 mag in the value means that the cluster could be more than 16 Gyr old, or as ”young” as about 12 Gyr. Since it is now generally accepted that this calibration leads to ages systematically larger than those derived e.g, from isochrone fitting, we take this only as an indication of the very old age of the cluster. We intend to re-calibrate the age- relation once the entire sample of OCs in our BOCCE program is examined and homogeneously dated through stellar evolutionary models.
In both CMDs the sequence of binary stars is visible, although its identification is complicated by the presence of a substantial field star contamination. For this reason, we did not attempt to quantify the fraction of binary systems as we did for less contaminated clusters (e.g., NGC 6253: Bragaglia et al. 1997; Be 21: Tosi et al. 1998).
Finally, we note that information on membership based on radial velocity is available only for a few bright stars. Scott et al. (1995) observed about 30 stars (all brighter than ) determining velocities with a precision of about 10 km s-1 and their data were used by Friel et al. (2002) for the determination of the cluster metallicities. They found that only about half of them could be considered good candidate cluster members. They measured a mean velocity of ( = 11) km s-1 and a mean metallicity [Fe/H]= ( = 0.12) dex. Four of these stars were later studied by Friel et al. (2005), who find that only three are actual cluster members and derive an average velocity of ( = 0.8) km s-1 and a mean [Fe/H]= ( = 0.09) dex.
3.1 The control field
To estimate the field stars contamination we used the data of the control field, which is far enough from the cluster to be safely considered free of cluster members. Fig. 5 shows the resulting and CMDs for the objects identified in this field. The corresponding catalogue contains 1310 objects identified in at least two filters, of which 1103 are identified simultaneously in all the three filters. Comparison of Figs. 4 and 5 helps to understand which are the true cluster features. We also plot (see Fig. 6) radial CMDs, both for Be 17 (where the centre was defined using histograms of the star coordinates along the x and y axes) and the comparison field. The cluster is quite loose, but its features clearly stand out with respect to the field population in the central part.
As in many other cases (see e.g., D’Orazi et al. 2006 for Be 32), the CMD of the external field appears to be composed by (at least) two populations. As already noted by K94, there is a broad main sequence that crosses diagonally the diagram and can be explained by the young population of the Perseus spiral arm. As a demonstration, in Fig. 7(b) we have plotted the Z=0.02 isochrones by Bertelli et al. (1994) for ages of 0.80, 1.25, 2, and 3 Gyr, assuming the values usually attributed to the arm =0.5 and =11.75 (i.e., a distance from the Sun of about 2.2 kpc).
There is a second sequence, fainter and bluer than the cluster MS (noticeable also in the CMD of the field centered on Be 17). In Fig. 7(b) we have overplotted on this second sequence the Z=0.008 and Z=0.004 isochrones with older ages (4, 5, 6.3, 9.9 Gyr) and assuming larger distance and reddening. We find a reasonably good fit with 0.65, 13.35, i.e., a distance of about 4.7 kpc, if Z=0.004 and 0.60, 13.30, i.e., a distance of about 4.8 kpc, if Z=0.008. With these values, we cannot have intercepted the Monoceros (or Anticentre) Ring, a feature of the Galactic disc visible towards the external parts of our Galaxy (e.g., Newberg et al. 2002, Ibata et al. 2003) but with a much larger distance from the Sun, of about 10 kpc. This Ring has been associated (Martin et al. 2004, but see Momany et al. 2004 for a different view) to an over density in star counts, interpreted as the remnant of the dwarf galaxy Canis Major (CMa). Interestingly, Bellazzini et al. (2006) present the N-body model of the disruption of CMa, which shows a clear signature towards the anticentre, and at a distance of about 5 kpc from the Sun (see their fig. 11). We are possibly seeing this feature, so we have compared the CMD of CMa to the one of our control field. We took the data presented by Bellazzini et al. (2004) for CMa, taking into account the different areas, as well as the distance modulus and reddening given in that paper, i.e. = 0.10 and = 14.5. The result is shown in Fig.7(c); the two CMDs are comparable, and we also see the blue plume (for magnitudes between about 17.5 and 19, and colours bluer than about = 1). These comparisons suggest that we are actually seeing a small portion of the disrupting dwarf.
Finally, Fig.7(d) shows the output of the Besançon Galactic model (Robin et al., 2003) in the direction of our control field, after correction for our completeness function; the bright parts of the CMDs are similar, but they are a poor match fainter than about . This shows that we cannot explain our observed features in terms of simple Galactic field, but we need to take the anomalous overdensities into account to reproduce all the sequences of the CMD.
| mag | cB | cV | cI | cB | cV | cI | |
|---|---|---|---|---|---|---|---|
| 16.00 | 1.0 | 1.0 | 1.0 | 1.00 | 1.00 | 1.00 | |
| 16.50 | 1.0 | 1.0 | 0.97 | 1.00 | 1.00 | 1.00 | |
| 17.00 | 1.0 | 1.0 | 0.99 | 1.00 | 1.00 | 1.00 | |
| 17.50 | 1.0 | 1.0 | 0.96 | 1.00 | 1.00 | 1.00 | |
| 18.00 | 1.0 | 0.97 | 0.98 | 1.00 | 1.00 | 0.98 | |
| 18.50 | 1.0 | 0.98 | 0.96 | 1.00 | 1.00 | 0.99 | |
| 19.00 | 0.99 | 0.99 | 0.94 | 0.98 | 0.98 | 0.96 | |
| 19.50 | 0.99 | 0.97 | 0.88 | 0.97 | 1.00 | 0.96 | |
| 20.00 | 0.98 | 0.97 | 0.81 | 0.98 | 0.97 | 0.92 | |
| 20.50 | 0.98 | 0.97 | 0.63 | 0.96 | 0.97 | 0.80 | |
| 21.00 | 0.97 | 0.95 | 0.31 | 0.96 | 0.95 | 0.48 | |
| 21.50 | 0.94 | 0.93 | 0.13 | 0.92 | 0.97 | 0.12 | |
| 22.00 | 0.94 | 0.91 | 0.03 | 0.89 | 0.93 | 0.02 | |
| 22.50 | 0.91 | 0.73 | 0.0 | 0.87 | 0.87 | 0.0 | |
| 23.00 | 0.81 | 0.45 | 0.0 | 0.66 | 0.55 | 0.0 | |
| 23.50 | 0.57 | 0.18 | 0.0 | 0.38 | 0.29 | 0.0 | |
| 24.00 | 0.24 | 0.04 | 0.0 | 0.13 | 0.04 | 0.0 | |
| 24.50 | 0.05 | 0.0 | 0.0 | 0.02 | 0.0 | 0.0 | |
| 25.00 | 0.0 | 0.0 | 0.0 | 0.00 | 0.0 | 0.0 |
4 Cluster parameters
Age, distance and reddening of Be 17 have been derived with the same procedure applied to all the clusters of our BOCCE project (see Bragaglia & Tosi 2006 and references therein), namely the synthetic CMD method originally described by Tosi et al. (1991). The best values of the parameters are found by selecting the cases providing synthetic CMDs with morphology, colours, number of stars in the various evolutionary phases and luminosity functions (LFs) in better agreement with the observational ones.
As usual, to test the effects of the adopted stellar evolution models on the derived parameters, we have run the simulations with three different types of stellar tracks, with various prescriptions for the treatment of convection and of overshooting from convective regions. Actually, Be 17 is so old that its MSTO stars have masses around 1 M⊙ and are therefore not expected to experience any overshooting from convective cores. Indeed, we find no appreciable difference in the results obtained with models with or without overshooting.
To estimate the metallicity which better reproduces the photometric properties of the cluster, we have created the synthetic CMDs adopting, for each type of stellar models, metallicities ranging from solar down to 20% of solar. We still assume (see Bragaglia & Tosi 2006) as solar metallicity models those with Z=0.02, because they are the ones calibrated by their authors on the Sun, independently of the circumstance that nowadays the actual solar metallicity is supposed to be lower (see Asplund, Grevesse, & Sauval 2005). At any rate, we consider the metallicities obtained with our photometric studies only indicative and use, whenever available, high resolution spectroscopy for a safe determination of the chemical abundances.
The adopted sets of stellar tracks are listed in Table 3, where the corresponding references are also given, as well as the model metallicity and the information on their corresponding overshooting assumptions. The transformations from the theoretical luminosity and effective temperature to the Johnson-Cousins magnitudes and colours have been performed using Bessel, Castelli & Pletz (1998) conversion tables and assuming = 1.25 (Dean et al. 1978) for all sets of models. Hence, the different results obtained with different stellar models must be ascribed fully to the models themselves and not to the photometric conversions.
| Set | metallicity | overshooting | Reference |
|---|---|---|---|
| BBC | 0.02 | yes | Bressan et al. 1993 |
| BBC | 0.008 | yes | Fagotto et al. 1994 |
| BBC | 0.004 | yes | Fagotto et al. 1994 |
| FRA | 0.02 | no | Dominguez et al. 1999 |
| FRA | 0.01 | no | Dominguez et al. 1999 |
| FRA | 0.006 | no | Dominguez et al. 1999 |
| FST | 0.02 | =0.00 | Ventura et al. 1998 |
| FST | 0.02 | =0.02 | Ventura et al. 1998 |
| FST | 0.02 | =0.03 | Ventura et al. 1998 |
| FST | 0.01 | =0.00 | Ventura et al. 1998 |
| FST | 0.01 | =0.02 | Ventura et al. 1998 |
| FST | 0.01 | =0.03 | Ventura et al. 1998 |
| FST | 0.006 | =0.00 | Ventura et al. 1998 |
| FST | 0.006 | =0.02 | Ventura et al. 1998 |
| FST | 0.006 | =0.03 | Ventura et al. 1998 |
The synthetic stars are attributed the photometric error derived from the artificial stars tests performed on the actual images. They are retained in (or excluded from) the synthetic CMD according to the photometry completeness factors listed in Table 2. All the synthetic CMDs have been computed either assuming that all the cluster stars are single objects or that a fraction of them are members of binary systems with random mass ratio (see Bragaglia & Tosi 2006 for a description of how binaries are included in the synthetic CMDs). We find, as in many other clusters, that a binary fraction around 30% well reproduces the observed distribution along the main sequence. All the synthetic CMDs shown in the figures assume this fraction of binaries.
In spite of the field contamination, the evolutionary sequences are quite well defined in the CMD of Be 17. Fig. 6 shows that the CMDs of the inner cluster regions are not much cleaner than the global one, and have the disadvantage of containing less stars; we have thus run the simulations for the whole field covered by our images. Since the cluster field contains 1940 stars measured in and the external field 1103, we assume that the cluster members are 1940 – 1103 = 837. Hence, the synthetic CMDs have been created with 837 objects.
We find that in all cases a solar metallicity must be excluded, because it does not allow us to simultaneously reproduce both the observed and colours. With Z=0.02, when the synthetic is correct, always turns out bluer than observed. Vice versa, models with Z0.006 provide colours redder than observed, when is correct. On the other hand, stellar tracks with metallicity about half of solar can reproduce very well the observed colours of all the evolutionary phases, once the appropriate reddening is adopted. For the BBC models, the only available metallicity leading to self-consistent results is Z=0.008. For both the FRA and the FST models, Z=0.006 allows to reproduce rather well the observed colours, but Z=0.01 leads to a much better agreement. We thus favour Z=0.01 as the photometric metallicity of Be 17.
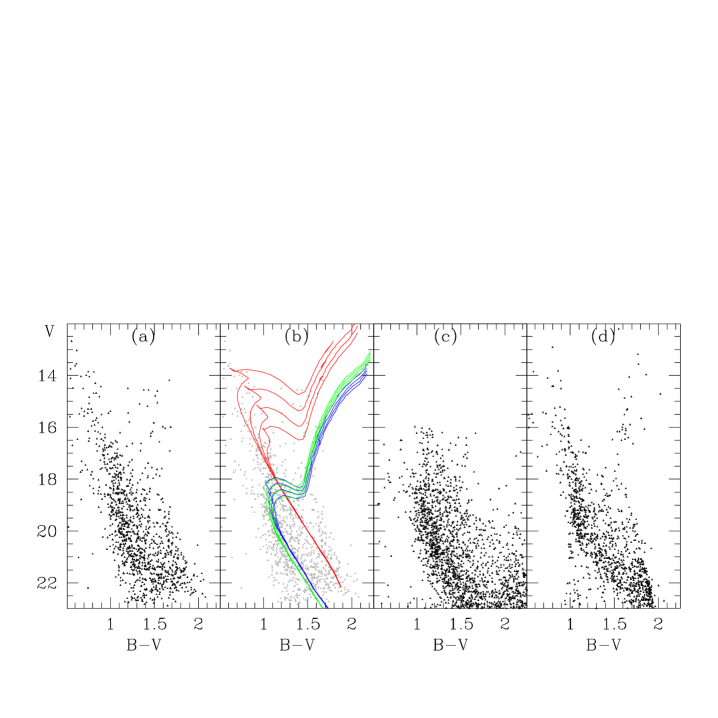
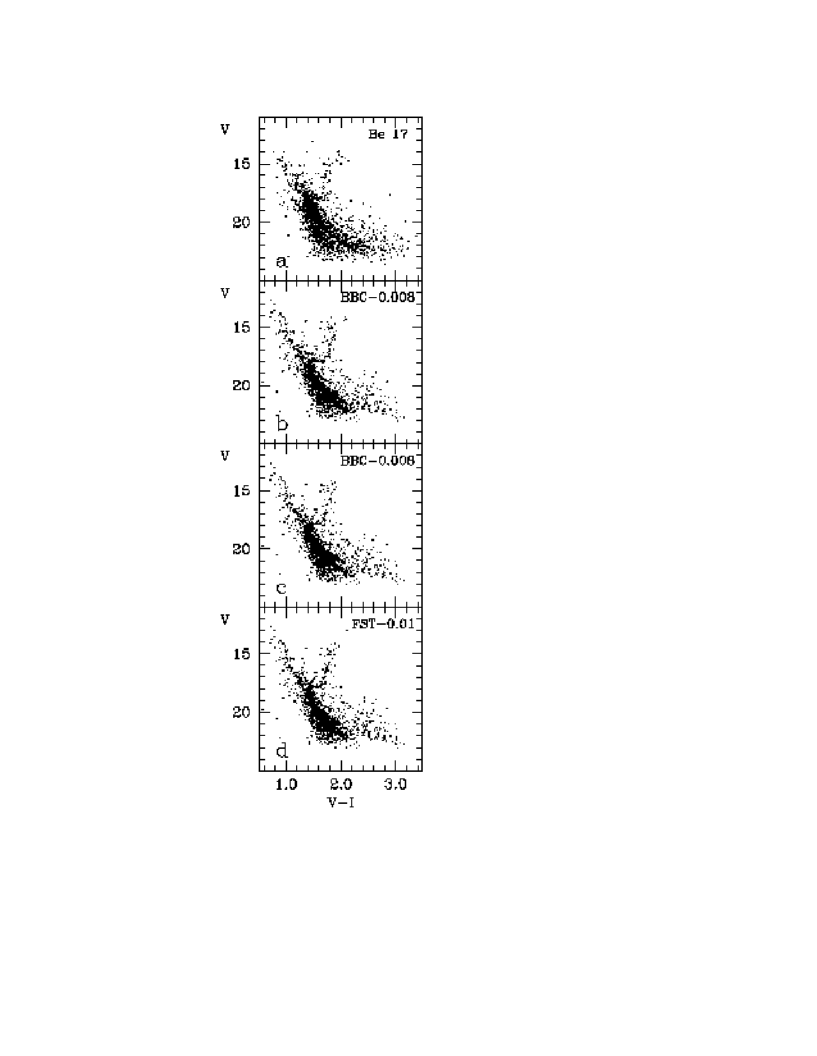
Fig. 8 compares three representative cases of synthetic CMDs (panels b, c and d), with the empirical one (panel a) in the plane. To better appreciate the differences between the various theoretical predictions, in panels b, c and d we plot only the 837 synthetic stars attributed to Be 17. Fig. 9 shows the corresponding plane, with the superposition of the 1103 external field stars to the 837 synthetic ones. Hence, all the CMDs of Fig. 9 contain 1940 objects. The observed cluster sequence looks slightly wider than the synthetic one, perhaps due to the character of the field contamination, but we think this does not significantly affect the age determination. It is also immediately apparent that our synthetic MSs never reach as deep as the empirical one. This is due to the fact that none of the adopted sets of stellar evolution models includes stars less massive than 0.6 M⊙, while our photometry clearly detects significantly smaller stars.
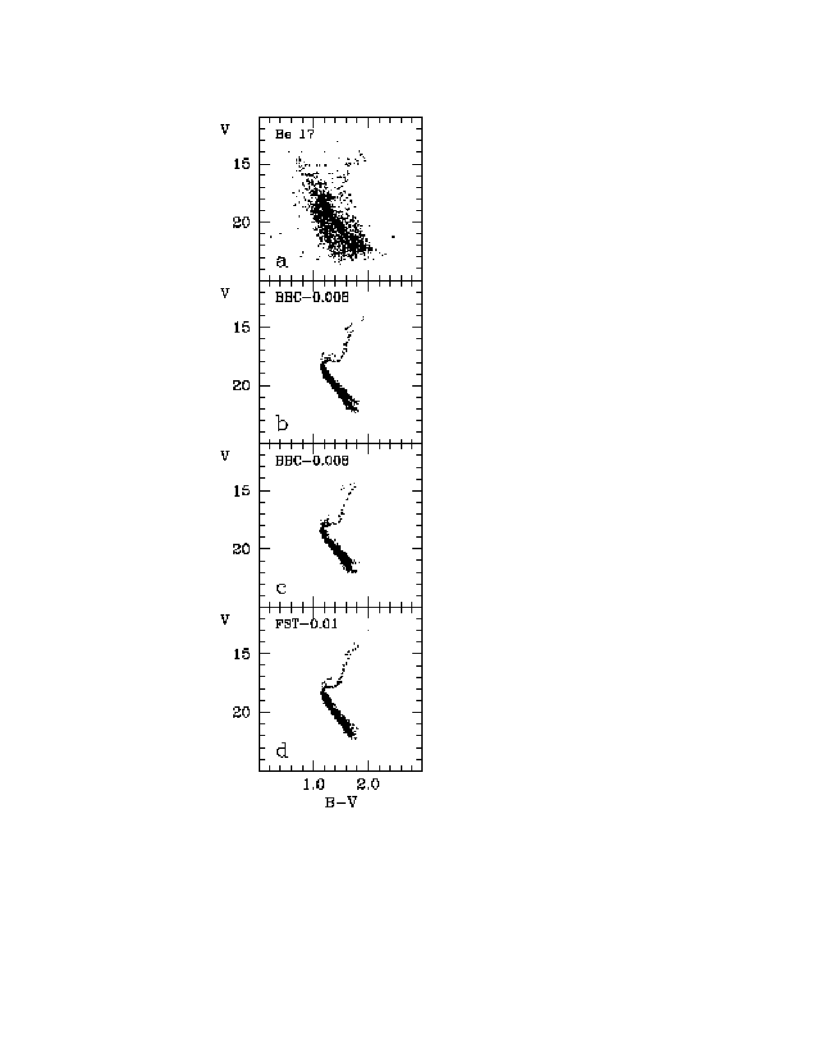
The binary sequence is evident in the synthetic CMDs of Fig. 8 and it is interesting to notice that it perfectly overlaps with existing sequences of the observational diagram, one on the right of the MS and one above the MSTO. These two observational sequences are not statistically significant by themselves, due to the field contamination, but the perfect match with the predicted binary sequence is unlikely to be just a fortuitous coincidence.
With all the adopted sets of stellar evolution models, the age that allows us to better reproduce all the observed properties of Be 17’s CMD is between 8.5 Gyr (with the BBC models, panel b in Figs 8 and 9) and 9 Gyr (with the FST models, panel d in Figs 8 and 9). Namely, with this age we obtain the right luminosity and colours of both the MSTO and the clump, the right shape of the MS, the subgiant branch (SGB) and the RGB, the right number of stars predicted on the clump and on the RGB, and the right star counts at the various MS levels. Younger ages imply fainter clump, worse MSTO morphology and, often, more extended SGB, and are therefore easy to reject. On the other hand, it is admittedly difficult to completely rule out older ages, up to 11-12 Gyr. As shown in panel c of Figs 8 and 9 (BBC models with Z=0.008, age = 12 Gyr, = 0.56 and = 12.1), the clump does become brighter and bluer, the star distribution on the RGB does differ somehow from the observed one, the SGB luminosity does increase too much with decreasing temperature, but none of these defects can really be considered bad enough to reject the case, once both the theoretical and the observational uncertainties are taken into account. However, since all the adopted sets of stellar evolution models agree in favouring an age of Gyr, we consider this value as the most likely age of Be 17.
The various sets of stellar models converge to values in strikingly good agreement also in the predictions for the reddening and the distance modulus. We obtain = 0.62, = 12.2 for the BBC models with Z=0.008 and age = 8.5 Gyr; = 0.60, = 12.2 for the FRA models with Z=0.01 and age = 9.0 Gyr; = 0.60, = 12.2 for the FST models with Z=0.01 and age = 9.0 Gyr. For sake of completeness (and because it was suggested by K94) we have also tested the possibility of some differential reddening affecting this rather contaminated region. From the comparison of synthetic CMDs computed with varying amounts of differential reddening, we suggest that, if present, the absorption variations should be rather small, with 0.03.
The LFs of the three synthetic CMDs shown in Fig. 9 are plotted in Fig. 10 (lines) and compared to that of the CMD of Fig. 9a. The latter is significantly affected by the 1103 external stars, thus making the comparison of little help in discriminating between different cases. We simply find that all these models are consistent with the data, except for the lack of very low mass stars which lead us to under predict the faint end of the LF.

5 Summary and discussion
5.1 Comparison with previous results
As already mentioned in the Introduction, Be 17 has received a lot of attention in the last decade.
The first to present good CMDs for this cluster was K94; he observed the central part of Be 17 with the 2.1 m telescope and a larger area ( arcmin2) with the 0.9 m telescope, both at Kitt Peak. He deduced a cluster diameter of about 13 arcmin and mentioned the possibility of differential reddening. By comparison of the CMD of the central part to NGC 6791 and assuming that Be 17 is metal-poorer, he found an age equal or slightly larger than that of NGC 6791, an apparent distance modulus , and a reddening (or ). He also concluded that the field stars appearing redder and brighter than the cluster MS belong to the Perseus spiral arm. The results for age and reddening are in very good agreement with our findings. We find instead a much shorter distance, but cannot readily explain such a difference.
The same year Janes & Phelps (1994), in their study of the properties of the old OCs, using photometry presented by Phelps et al. (1994) and their calibration of the MAI, derived the very large age of 12 Gyr for Be 17. The MAI had not been intended to measure absolute ages, and Janes & Phelps (1994) stress that it is to be used only to measure relative ages. In their calibration of the versus age (the latter taken from internally precise, but inhomogeneous sources) they also considered several GCs, with ages taken from Chaboyer et al. (1992). Among them the youngest GCs have ages of about 10 Gyr. The MAI was scaled so that an age of 15 Gyr was obtained for the oldest among the globulars: an age currently considered older than the Universe !
Another kind of analysis was done by P97, who concentrated on the single cluster, instead of considering the bulk properties of the open cluster sample. He obtained deep and precise photometry of Be 17, using the 2.1 m Kitt Peak telescope on a photometric night. P97 noted, as we already said in Sect. 2.1, that his and K94 photometries do not perfectly agree, but he thought that this did not compromise his major conclusions. He used a control field to statistically subtract the field star contamination and employed the cleaned CMDs for his analysis. First he determined the cluster age by means of the and the (this is a difference in colour, that can be calibrated to derive a second estimate of ): he found (instead of 2.8 as in Phelps et al. 1994) and from the MAI calibration obtained an age of 10.9 Gyr. Later he derived the cluster age from isochrone fitting. Using the VandenBerg (1985) isochrones (that do not reach the RC) he derived a best fit age of 12 Gyr with Z=0.01, while for the Bertelli et al. (1994) isochrones he cited a range of 10 to 12 Gyr, with a preference for Z=0.02. On the whole, he assumed an age of 12 Gyr and a metallicity between solar and half of solar. The reddening and distance he derived are perfectly consistent with ours: and . With these values, and adding the largish diameter and mass and the rather high radial velocity, P97 seems to think that Be 17 may be a transitional cluster, in between open and globular ones; his main conclusion is that this cluster poses important constraints on the age of the disc and of the halo too, which is thought to have formed before.
Why did he obtain such a large age using the Bertelli et al. (1994) isochrones, coming from the same set of models from which we obtain instead a best fit age of 8.5 Gyr and Z=0.008 ? With his data we would have made a choice different from his. In fact, judging from his figures 7 and 8, the luminosity of the RC is actually better fit by the 10 Gyr isochrone. Furthermore, we would have given lower weight to the VandenBerg (1985) isochrones, since they miss the very important clue of fitting both the MSTO and the RC luminosities and colours.
A confirmation of our choice comes from the work by Carraro et al. (1998): they re-analysed the data by P97 (and K94), using the new Girardi et al. (2000) isochrones (in preparation, at the time) and found that the possible combinations of parameters are: , , and age Gyr for Z, with the metallicity not affecting the age. They too differ from P97’s choice of the best fit from the Bertelli et al. (1994) isochrone, and place lower weight to the VandenBerg (1985) ones.
Another check of the cluster parameters come from the work by Carraro et al. (1999) based on IR data. They obtained an independent estimate of the cluster metallicity from the RGB slope, finding [Fe/H], in very good agreement with the spectroscopic estimates. Using this value and the Girardi et al. (2000) isochrones they find a best fit age of 9 Gyr; translating from the IR quantities, they derive and .
Salaris et al. (2004) derived a calibration of the that takes into account also the metallicity. They determined distances to 10 clusters by means of main sequence fitting, and the corresponding ages using their own evolutionary models. These clusters were used to derive the calibration from which, using literature values for and metallicity, an age of 10 Gyr is obtained for Be 17. They also confirm a gap of 2.0 Gyr between the formation of the thin disc and of the halo, while the oldest OCs (Be 17 and NGC 6791) have the same age of the oldest thin disc stars.
Finally, Krusberg & Chaboyer (2006) assumed the metallicity from Friel et al. (2002) and obtained, from isochrone fit without RC, an age of 10 1 Gyr, =14.1-14.2 and a =0.56-0.61. They do mention that assuming a higher metallicity (as indicated by Friel et al. 2005) the age would decrease, thus presumably becoming closer to our value.
Since we have not analysed yet the spectra we obtained for three RC stars, no real comparison between our (approximate) photometric metallicity based only on the best fit isochrones and the spectroscopic values obtained by Friel et al. (2002) and Friel et al. (2005) is attempted. We only note that there is a general agreement that the cluster metallicity is (slightly) sub solar.
5.2 Discussion
Our analysis confirms that Be 17 is a very old disc object but that its age is far from that of globulars. There is only one known exception: Carraro (2005) has presented evidence that GCs may be much younger than usually taken for granted. Whiting 1, with , low metallicity (Z = 0.001), and heliocentric distance of 45 kpc hardly qualifies as a disc open cluster, yet it has an age of about 5 Gyr. Its nature has to be further investigated; either the separation between Galactic globular and open clusters is fuzzier than we think, or Whiting 1 is a ”freak”, maybe connected to an accretion event.
Considering the age distribution of the bulk of well behaved globular clusters, recent studies of a very ample, well defined, homogeneously analysed sample of GCs (Rosenberg et al. 1999; De Angeli et al. 2005) have derived accurate relative ages for 55 GCs, finding that most of them are coeval and old. There are some GCs younger by about 1 Gyr, but the really younger ones (by about 3 Gyr) seem all connected to streams, i.e. not truly genuine halo or disc clusters. The absolute age is more delicate to determine; for instance, Gratton et al. (2003), after deriving a very accurate distance using the main sequence fitting method for three GCs also present in that sample, found that two of them, NGC 6752 and NGC 6397, are coeval while the metal-richer 47 Tuc is younger by about 2.5 Gyr. This, using models by Straniero et al. (1997), and taking into account differences in microscopic diffusion and helium content between those models and later results, means absolute ages of about 13 and less than 11 Gyr, respectively, with an error bar of about 1 Gyr.
Our result places Be 17 quite safely away from that lower limit; however, to obtain an absolute age we have to rely on theoretical models, and ages of GCs and OCs obtained by different authors with different techniques and models may not be immediately comparable. To get a definitive answer, stricter homogeneity is required, but the evidences are still largely in favour of the thin disc being younger than the halo.
Finally, we note that a hiatus between the formation of the halo and thick disc and that of the presently observed thin disc has also been found using chemical signatures. For instance, Gratton et al. (2000) analysed disc and halo stars in the solar neighborhood and noticed that the run of [Fe/O] versus [O/H] supports the hypothesis of a period with no, or very low, star formation, confirming previous results by Furhrmann (1998). In a [Fe/O] versus [O/H] plot (where O is the clock), Fe - primarily produced by type Ia Supernovae - after remaining constant with increasing O, suddenly increases at constant O. Since O is instead produced by short-lived, massive stars, this is interpreted as absence of such stars, i.e., of star formation, for a period of at least 1 Gyr.
5.3 Summary
We have analysed photometric data of Be 17, and determined its fundamental parameters by means of comparison of the observed CMDs to synthetic ones generated using different sets of stellar evolutionary models.
-
•
We find an age of 8.5-9 Gyr, a distance = 12.2 (consistently for all evolutionary tracks used; an error of 0.1 mag can be assumed), a reddening value = 0.60-0.62, and approximate metallicity Z=0.008 or 0.01. The three adopted sets of models agree very well on these values.
-
•
We cannot completely rule out a larger age ( Gyr) but the corresponding synthetic CMDs produce consistently worse fits to the observed ones.
-
•
Differential reddening is estimated to be at most at the 5 per cent level.
-
•
We find that a binary fraction of 30 per cent well reproduces the MS: these binary systems populate a secondary brighter and redder sequence that is possible to detect also in the observed CMDs along the single-stars MS and brighter than the MSTO.
-
•
The measured on our data would imply a very old age ( Gyr), but a re calibration of this useful relative age indicator, based on homogeneously determined ages, is necessary.
-
•
Comparison of our findings with literature values indicates only two real discrepancies: with K94 for distance and with P97 for age; possible causes for the latter have been discussed.
-
•
The comparison field shows a structure probably associated to the young population of the Perseus arm; there is a second component, compatible with having intercepted the orbit of the disrupting CMa galaxy.
-
•
Be 17 has a sub solar metallicity, a quite large reddening, and a very old age. With our preferred value of 8.5 – 9 Gyr Be 17 is definitely younger than the bulk of GCs, those that are thought to have formed in the very first phases of Galaxy formation, either by a monolithic collapse or early fragment accretion.
Further work on Be 17 is foreseen, both to derive its elemental abundances on a scale homogeneous with the other OCs in our sample (e.g., Carretta et al. 2005 and references therein) and to define membership from radial velocities for about 100 stars in crucial evolutionary phases. The latter information may be used to confirm or refine the determination of cluster properties done in the present paper.
ACKNOWLEDGEMENTS
We gratefully acknowledge the use of software written by P. Montegriffo, and of the BDA, operated for many years by J.C. Mermilliod and now by Dr. E. Paunzen. We thank L. Di Fabrizio for help with the photometric calibration, and M. Bellazzini for discussions on CMa. The bulk of the synthetic CMD code was originally provided by Laura Greggio. We thank the anonymous referee for the useful suggestions. This project has received partial financial support from the Italian MIUR under PRIN 2003029437. AB thanks the Fundación Galileo Galilei for funding a visit to La Palma during which the analysis of the cluster was completed.
References
- Asplund, Grevesse, & Sauval (2005) Asplund M., Grevesse N., Sauval A. J., 2005, ASPC, 336, 25
- Bellazzini et al. (2004) Bellazzini M., Ibata R., Monaco L., Martin N., Irwin M. J., Lewis G. F. 2004, MNRAS, 354, 1263
- Bellazzini et al. (2006) Bellazzini M., Ibata R., Martin N., Lewis G. F., Conn B., Irwin M. J., 2006, MNRAS, 366, 865
- Bertelli et al. (1994) Bertelli G., Bressan A., Chiosi C., Fagotto F, Nasi E. 1994, A&A, 106, 275
- Bessell, Castelli, & Plez (1998) Bessell M. S., Castelli F., Plez B., 1998, A&A, 333, 231
- Bragaglia et al. (1997) Bragaglia A., Tessicini G., Tosi M., Marconi G., Munari U., 1997, MNRAS, 284, 477
- Bragaglia & Tosi (2006) Bragaglia A., Tosi M. 2006, AJ, March issue (astro-ph/0511020)
- Bressan et al. (1993) Bressan A., Fagotto F., Bertelli G., Chiosi C., 1993, A&AS, 100, 647
- Carraro (2005) Carraro G., 2005, ApJ, 621, L61
- Carraro et al. (1998) Carraro G., Girardi L., Chiosi C., 1998, MNRAS, 309, 430
- Carraro et al. (1999) Carraro G., Vallenari A., Girardi L., Richichi A., 1999, A&A, 343, 825
- Carretta et al. (2005) Carretta E., Bragaglia A., Gratton R. G., Tosi M., 2005, A&A, 441, 131
- Chaboyer et al. (1992) Chaboyer B., Sarajedini A., Demarque P., 1992, ApJ, 394. 515
- Davis (1994) Davis L. E. 1994, A Reference Guide to the IRAF/DAOPHOT Package, IRAF Programming Group, NOAO, Tucson
- Dean, Warren, & Cousins (1978) Dean J. F., Warren P. R., Cousins A. W. J., 1978, MNRAS, 183, 569
- De Angeli et al. (2005) De Angeli F., Piotto G., Cassisi S., Busso G., Recio-Blanco A., Salaris M., Aparicio A., Rosenberg A., 2005, AJ, 130, 116
- Dominguez et al. (1999) Dominguez I., Chieffi A., Limongi M., Straniero O., 1999, ApJ, 524, 226
- D’Orazi et al. (2006) D’Orazi V., Bragaglia A., Tosi M., Di Fabrizio L., Held E. V., 2006, MNRAS, in press (astro-ph/0602017)
- Fagotto et al. (1994) Fagotto F., Bressan A., Bertelli G., Chiosi C., 1994, A&AS, 105, 29
- Freeman & Bland-Hawthorn (2002) Freeman K., Bland-Hawthorn J., 2002, ARA&A, 40, 487
- Friel (1995) Friel E. D. 1995, ARA&A, 33, 381
- Friel et al. (2002) Friel E. D., Janes K. A., Tavarez M., Scott J., Katsanis R., Lotz J., Hong L., Miller N., 2002, AJ, 124, 2693
- Friel et al. (2005) Friel E. D., Jacobson H. R., Pilachowski C. A., 2005, AJ, 129, 2725
- Furhrmann (1998) Furhrmann K., 1998, A&A, 338, 161
- Girardi et al. (2000) Girardi L., Bressan A., Bertelli G., Chiosi C., 2000, A&AS, 141, 371
- Gratton et al. (2000) Gratton R. G., Carretta E., Matteucci F., Sneden C., 2000, A&A, 358, 671
- Gratton et al. (2003) Gratton R. G., Bragaglia A., Carretta E., Clementini G., Desidera S., Grundahl F., Lucatello S., 2003, A&A, 408, 529
- Ibata et al. (2003) Ibata R. A., Irwin M. J., Lewis G. F., Ferguson A. M. N., Tanvir N. 2003, MNRAS, 340, L21
- Janes & Phelps (1994) Janes K. A., Phelps R. L. 1994, AJ, 108, 1773
- Kaluzny (1994) Kaluzny J., 1994, Acta Astron., 247, 256 (K94)
- King (1985) King D.L., 1985, RGO/La Palma technical note no 31
- Krusberg & Chaboyer (2006) Krusberg Z. A. C., Chaboyer B., 2006, AJ, in press (astro-ph/0512131)
- Landolt (1992) Landolt A. U. 1992, AJ, 104, 340
- Martin et al. (2004) Martin N., Ibata R. A., Bellazzini M., Irwin M. J., Lewis G. F., Denhen W. 2004, MNRAS, 348, 12
- Mermilliod (1995) Mermilliod J. C. 1995, D. Egret, M. A. Albrecht eds, Information and On-Line Data in Astronomy, Kluwer Academic Press (Dordrecht), p. 127
- Momany et al. (2004) Momany Y., Zaggia S. R., Bonifacio P., Piotto G., De Angeli F., Bedin L. R., Carraro G., 2004, A&A, 421, L29
- Newberg et al. (2002) Newberg H. J., et al. 2002, ApJ, 569, 245
- Phelps (1997) Phelps R. L., 1997, ApJ 483, 826 (P97)
- Phelps et al. (1994) Phelps R. L., Janes K. A., Montgomery K .A. 1994, AJ 107, 1079
- Robin et al. (2003) Robin, A.C., Reylé, C., Derrière S., & Picaud, S. 2003, A&A, 409, 523
- Rosenberg et al. (1999) Rosenberg A., Saviane I., Piotto G., Aparicio A., 1999, AJ, 118, 2306
- Salaris et al. (2004) Salaris M., Weiss A., Percival S. M., 2004, A&A, 414, 163
- Scott et al. (1995) Scott J. E., Friel E. D., Janes K. A., 1995, AJ, 109, 1706
- Setteducati & Weaver (1962) Setteducati A.F., Weaver M.F. 1962, in ’Newly found Stellar Clusters’, Radio Astr. Lab. Univ. of California, Berkeley
- Stetson (1987) Stetson P. B. 1987, PASP 99, 191
- Straniero et al. (1997) Straniero O., Chieffi A., Limongi M., 1997, AJ, 490, 425
- Tosi et al. (1991) Tosi M., Greggio L., Marconi G., Focardi P. 1991, AJ, 102, 951
- Tosi et al. (1998) Tosi M., Pulone L., Marconi G., Bragaglia A., 1998, MNRAS, 299, 834
- Tosi et al. (2004) Tosi M., Di Fabrizio L., Bragaglia A., Carusillo P. A., Marconi G. 2004, MNRAS, 354, 225
- VandenBerg (1985) VandenBerg D. A., 1985, ApJS, 58, 711
- Ventura et al. (1998) Ventura P., Zeppieri A., Mazzitelli I., D’Antona F., 1998, A&A, 334, 953