Chandra X-Ray Observations of Young Clusters. III. NGC 2264 and the Orion Flanking Fields
Abstract
Chandra observations of solar-like pre-main sequence (PMS) stars in the Orion Flanking Fields (age 1 Myr) and NGC 2264 (3 Myr) are compared with the results of the COUP survey of similar objects in the ONC (0.5 Myr). The correlations between log and mass found for PMS stars on convective tracks in these clusters are consistent with the relationships found for the ONC, indicating little change in the median values of either log or log /during the first 3-5 Myr of evolution down convective tracks. The fraction of stars with extreme values of , more than 10 times higher than the average for a given or with log / greater than the canonical saturation value of 2.9, is however larger by a factor of two in the younger ONC when compared with the Orion FF and NGC 2264.
PMS stars in NGC 2264 on radiative tracks have / values that are systematically lower by a factor of 10 times than those found for stars of similar mass on convective tracks. The dramatic decrease in flux from convective to radiative phases of PMS evolution is likely related to major structural changes which influence the efficiency of magnetic field generation and thus the level of magnetic activity.
As in the ONC, we find that stars with measured periods have, on average, higher X-ray luminosities. However, there is a wide range in and / for both periodic and non-periodic stars of similar mass. Among stars with measured periods, the level of X-ray emission does not correlate with the rotation rate.
For this data set, we find no statistically significant correlation between X-ray flux and (a) the presence or absence of circumstellar accretion disks, or (b) disk accretion rates as assessed from ultraviolet excesses.
1 Introduction
Low-mass stars of all stages of evolution—from protostars to the main sequence—emit X-rays (see, e.g., Feigelson & Montmerle 1999). The relationships between the levels of X-ray emission and stellar properties for pre-main-sequence (PMS) stars are, however, very different from the well established correlations between rotation, Rossby number, and X-ray emission seen in young main-sequence stars (e.g., Stauffer et al. 1994, Micela et al. 1996, Pizzolato et al. 2003). Several factors may contribute to these differences. Low-mass PMS stars are fully convective during their early evolution, and differences in stellar structure (convective in the PMS phase vs. radiative core, convective envelope on the ZAMS) are likely to produce different levels of magnetic-field-related activity. Many PMS stars are still surrounded by accretion disks, which may influence X-ray emission in at least three ways. Additional X-ray emmission above coronal levels may be produced in accretion shocks or wind/jet shocks (e.g., Kastner et al. 2002, 2005; Guedel et al. 2005). Depending on the system orientation and the size of disk (and extent of flaring), disks or neutral winds may absorb X-ray photons, decreasing the detected flux, particularly at short wavelengths (e.g., Kastner et al. 2005; Walter & Kuhi 1981). The rotation speed of PMS stars could, in principle, also affect X-ray emission. If so, then the X-ray properties of stars surrounded by accretion disks may differ systematically from their counterparts that lack disks, owing to the effects of “disk locking” on rotation (e.g., Shu et al. 1987, 2000; Königl 1991, 1989). Finally, there might also be other less direct interactions between accretion, the young stellar object, its outer convective zone, the magnetic field structures, and the X-ray emitting plasma, as discussed in Preibisch et al. (2005).
The recent COUP project (Getman et al. 2005) has investigated the detailed relationships among stellar parameters and X-ray flux among solar-like PMS stars in the ONC (Preibisch et al. 2005), which has an age of 0.5 Myr. We consider here the relationships among rotation, X-rays, and disks for several hundred stars in the Orion Flanking Fields (1 Myr) and NGC 2264 (3 Myr). We focus our analysis on objects of masses 0.3 to 2.5 M☉.
The stars in these regions are, on average, slightly older than those in the ONC and are therefore, in combination with the COUP data, well-suited for searching for changes during the early evolution of PMS stars. Importantly, for stars of 1-2 M☉, the current sample includes stars spanning the range of ages in which substantial structural changes take place as stars evolve from a fully convective phase to a phase in which they develop radiative cores and convective envelopes. Since the origin of the X-rays in the Sun is believed to be linked to dynamo-driven activity, we might expect that the mechanism of magnetic field and consequent coronal X-ray generation changes as stars make the transition from a fully convective state to one in which a radiative core is surrounded by a thin convective envelope. Consequently, we might also expect to see a change in the X-ray properties.
The basic presentation of the data for the Orion FF and NGC 2264 appears in other papers (Ramirez et al. 2004a,b; Flaccomio et al. 2005a,b); we discuss here the implications of these data. After a brief summary of the observations (§2), we consider in some detail the completeness and selection effects of the sample of stars to be discussed here. Then we compare the relationships of log and log / (§3) with mass and age for stars on convective tracks in all three clusters and find that the relationships are entirely consistent, thereby indicating that there is little or no evolution in X-ray properties during the first 5 Myr of evolution down convective tracks. We find clear evidence for a decrease in log / when stars make the transition from convective to radiative tracks (§4). We also discuss the sample with rotation information (§5), and find that the subset of stars with measured periods has on average significantly higher values of log /, as was found previously for the ONC (Preibish et al. 2005b). Also in accordance with previous studies, we find no clear trends of X-ray emission with rotation among the sample having spot-modulated periods. Finally, in §6, we examine the relation between disks, mass accretion rate (inferred from ultraviolet excess emission) and X-ray luminosity; we find no clear trends.
2 Observations, Data, and Sample Selection
2.1 Observations
In this paper, we discuss stars detected in four Chandra/ACIS fields: two in NGC 2264 and two in the outer Orion Nebula Region, the so-called “Orion Flanking Fields” (FF; see Rebull et al. 2000, Rebull 2001 for more discussion of these fields).
The Chandra data for the Orion FF were first presented in Ramirez et al. (2004b). The two fields here correspond to portions of fields 2 and 4 from Rebull et al. (2000); they are centered on 05h35m19s, and 05h35m6s, . Standard CIAO procedures were used to reduce the data. With about 48 ks exposure time per field, 417 sources were detected in total over both fields. The distance modulus we assumed for Orion is 8.36 (470 pc).
The Chandra data for the northern field in NGC 2264 were first presented in Ramirez et al. (2004a), in which 263 sources were detected in 48.1 ks. The ACIS-I array was centered at 6h40m48s, . These data were also independently analyzed by Sung et al. (2004) in an effort to identify X-ray emitting WTTS. The ACIS data for the southern field in NGC 2264 is discussed in Flaccomio et al. (2005, 2006). The ACIS-I array was centered at 6h40m58.1s, +93400.40, and 420 sources were detected in 96 ks. Standard CIAO procedures were used to reduce the data. The distance modulus we assumed for NGC 2264 is 9.40 (760 pc).
Following the approach discussed in Ramirez et al. (2004a,b) and Flaccomio et al. (2006), we determined upper limits for all stars with optical data in these fields.
ACIS data have also been recently published in the ONC core region by Feigelson et al. (2003b) and as part of the COUP project (Getman et al. 2005, Preibisch et al. 2005b). Those much deeper () observations of an extremely rich and slightly younger region (Ramirez et al. 2004b) provide a dataset of great statistical weight with which we can compare our results.
2.2 Ancillary Data and Counterparts
In order to interpret these X-ray data in the context of young stars, we assembled extensive catalogs of multi-wavelength photometric and spectroscopic data for each cluster, as discussed in greater detail in Ramirez et al. (2004a, b). These catalogs are hereafter referred to as the ancillary data catalogs (ADC). For NGC 2264, the bulk of the data in the ADC comes from Rebull et al. (2002), as well as Park et al. (2000) and the Two Micron All Sky Survey (2MASS). The ADC also contains preliminary proper motions from B. Jones; see Rebull et al. (2002). We have added to the ADC recently published data from Lamm et al. (2004), Sung et al. (2004), and Dahm & Simon (2005). For the Orion Flanking Fields, the ADC was assembled from 30 published articles ranging from the magnitudes in Rebull et al. (2000) to the photometry from 2MASS; see Ramirez et al. (2004b). The ADC has also been updated with more recently published photometric data from Sicilia-Aguilar et al. (2005), as well as with 126 additional measurements and upper limits currently under preparation for publication (Rebull et al. 2006 in prep).
For each of the clusters, we matched each X-ray detection from Ramirez et al. (2004a,b) to optical and/or NIR counterparts from the ADC based on comparison of RA and Dec of the individual objects combined with manual inspection of the near-IR field around each X-ray source.
Following the same approach as in, e.g., Rebull et al. (2000), using the stars’ positions in the dereddened color-magnitude diagram (CMD), we calculated following the precepts summarized by Hillenbrand (1997). Similarly, we assigned masses to the stars according to the two different sets of PMS stellar models: (1) those of D’Antona & Mazzitelli (1994, 1998; DAM), with conversion from the theoretical to the observational plane (including calculation of ) using transformations found in Hillenbrand (1997); and (2) those of Siess et al. (2000; SDF), the Z=0.02 model with no overshooting, using conversions from Kenyon & Hartmann (1995). The DAM models are what we have used in previous papers (e.g., Rebull et al. 2000), but the SDF models were used by COUP (Preibisch et al. 2005b); masses from both models are discussed here to facilitate comparison with these and other papers. If stars fell outside the grid provided by the models, no masses or ages were assigned; such stars were excluded from this analysis. Additional discussion regarding uncertainties in masses and ages appears in Rebull (2001); we repeat here that the largest uncertainties are in the models themselves, and the ages and masses used here are perhaps best thought of as proxies for relative placements in the observational CMD.
In Ramirez et al. (2004b), we have found that the X-ray selected sample in Orion FF (1 Myr) is on average slightly older than that for the ONC (0.5 Myr), but not as old as that for NGC 2264 (3 Myr). Repeating this analysis now including the second NGC 2264 field, it is still the case that the median age of the FF sample is older than the ONC, and NGC 2264 is older still. The range of ages found within each of these clusters is on the order of 3 Myr and comparable in all three clusters, with the largest fraction of older stars being found in NGC 2264; see Figure 1. The ages listed here (0.5, 1, and 3 Myr) are obtained from comparing distributions of ages derived using DAM models for the “best possible sample” (see next subsection below) for these clusters. If we use SDF models for the same subset of stars, we find ages that are on average older by 1 Myr, but the relative age placement of the clusters is similar at 1.5, 2, and 4 Myr. The relative placement of the clusters is also consistent with the relative numbers of radiative and convective stars (see below); the fewest radiative stars are found in the ONC and the most are found in NGC 2264.
2.3 Catalog Statistics and Sample to be Considered Here
In order to interpret our X-ray data, we have to include data from the ancillary data catalog (ADC). However, we cannot simply take all of the ADC data merged with the X-ray data and proceed. Not all stars have a complete set of data in the ADC, and there is a wide range of ADC survey depths among our sample clusters. In this section, we describe what kinds of data we require for a given star to appear in subsequent analysis in this paper. In the end, we settle on a sample which we will hereafter refer to as the “best possible sample” (as defined below and summarized in Table 1). Within this best possible sample, there are stars that are on radiative tracks according to either the DAM or SDF models, and stars that are on convective tracks according to those models. These samples are referred to as the best possible radiative and best possible convective samples. In plots that follow, where both the radiative and convective stars appear, the radiative stars are colored red; otherwise, the plots contain just the convective stars. The following discussion is summarized in Table 1, where the numbers of detections and/or upper limits are tabulated for each of a variety of criteria.
While there are 416 X-ray sources detected in the Orion FF and 683 sources detected in NGC 2264 (line A in Table 1), only 84% (348) of the FF sources and 75% (509) of the NGC 2264 sources have optical and/or NIR counterparts in the ADC (line B in Table 1). For determining, among other things, masses and ages, we require a and magnitude so that we can place all the stars in the same CMD and at least derive self-consistent values. There are 278 (67%) of the FF X-ray detections and 465 (68%) of the NGC 2264 X-ray detections meeting those criteria (line D in Table 1). Further, of those, 94% (261 in the FF and 438 in NGC 2264) are likely cluster members based on position in the sky and position in the CMD (line E in Table 1)—these objects appear in a clear “locus” above the ZAMS (see Rebull et al. 2000, 2002 for full CMDs and additional discussion).
Of the entire set of X-ray detections, only 115 (27%) Orion FF sources and 294 (52%) NGC 2264 sources can be identified with counterparts that have known spectral types in the ADC (line C in Table 1). Because of the original motivations behind the studies amassing most of these spectral types, the set of stars with types is strongly biased toward the stars with known rotational periods. As we will see below, stars with measured periods are brighter in X-rays, which therefore affects the set of stars with both X-ray detections and spectral types.
As a result of this bias, we chose not to limit our analysis here to solely the stars with spectral types. In order to minimize the chances of field star contamination, we have, however, restricted our discussion to objects (261 detections in the FF and 438 detections in NGC 2264) that are likely members based on position in the sky and in the CMD (line E in Table 1).
Upper limits can be important for determining trends in complex data sets such as this. We obtained upper limits in for stars with optical detections in the ADC. For the FF, this adds 84 upper limits to the 261 detections to be considered (for just the stars that are likely to be members – the ones in the CMD locus – an increase of 30%). The optical surveys of NGC 2264 incorporated into the ADC are very deep and are not well-matched to the relatively shallow Chandra survey. If the entire optical sample from the ADC were included (line F in Table 1), the number of X-ray upper limits would dwarf the detections (and moreover would likely be dominated by non-members). We have, therefore, limited our analysis to likely member stars (line G in Table 1; those both on the molecular cloud and in the CMD locus) with , which is well-matched both to the detections and to the optical surveys incorporated into the ADC for both clusters. In order to make a fair comparison with the set of detections, we further limit even the detections to those stars with . This adds 168 upper limits to the now-reduced 349 detections to be considered in NGC 2264 (line H in Table 1). These restrictions should also reduce the contamination of our sample by non-members. The percentage of non-members is probably higher among stars with no detections (because members are more likely to be bright in X-rays) and at the faint end (because the mass function means there are simply more low-mass stars in the field). This cut in of course has implications for the mass and age range to be considered here; see Figure 1. This cut eliminates stars with 0.3 M☉ and 5 Myr, using DAM models.
To summarize the discussion to this point (line H in Table 1), then, there are 261 X-ray detections with optical counterparts from the ADC that are likely stellar members of the Orion FF, with 84 additional upper limits. There are 349 X-ray detections with optical counterparts from the ADC with that are likely stellar members of NGC 2264, with 168 additional upper limits.
Because we will be comparing the X-ray properties of stars on radiative tracks with the stars on convective tracks, we have further limited the discussion to just stars that fall within the range of and spanned by published stellar models (the “model grid”), and those with 2.5 M☉. This leaves 250 detections and 80 upper limits in the FF, and 317 detections with 139 upper limits in NGC 2264 (lines I and J in Table 1)
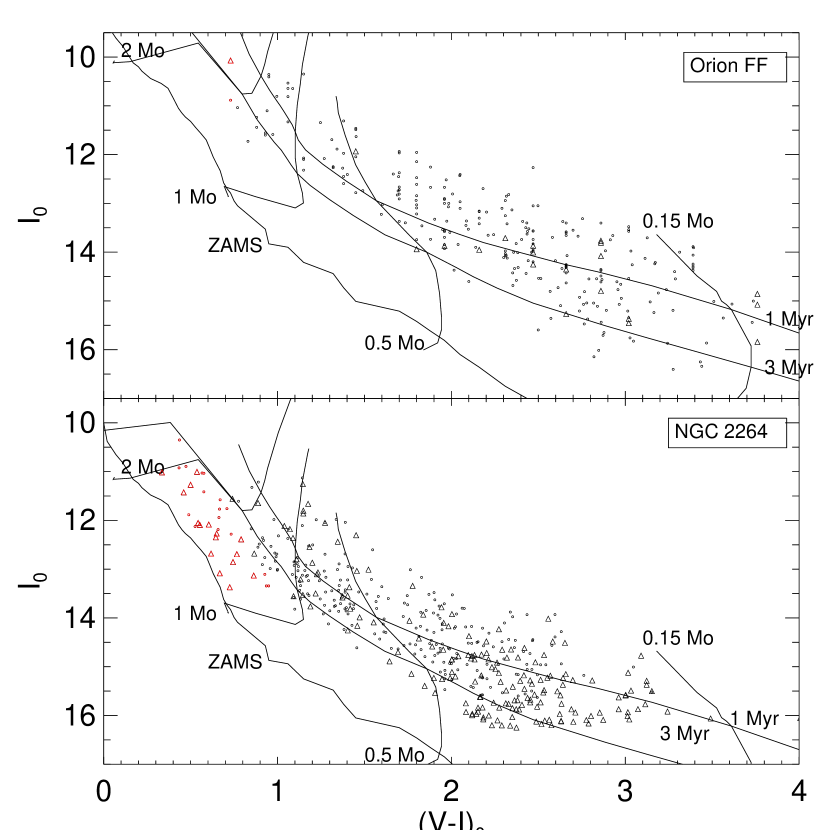
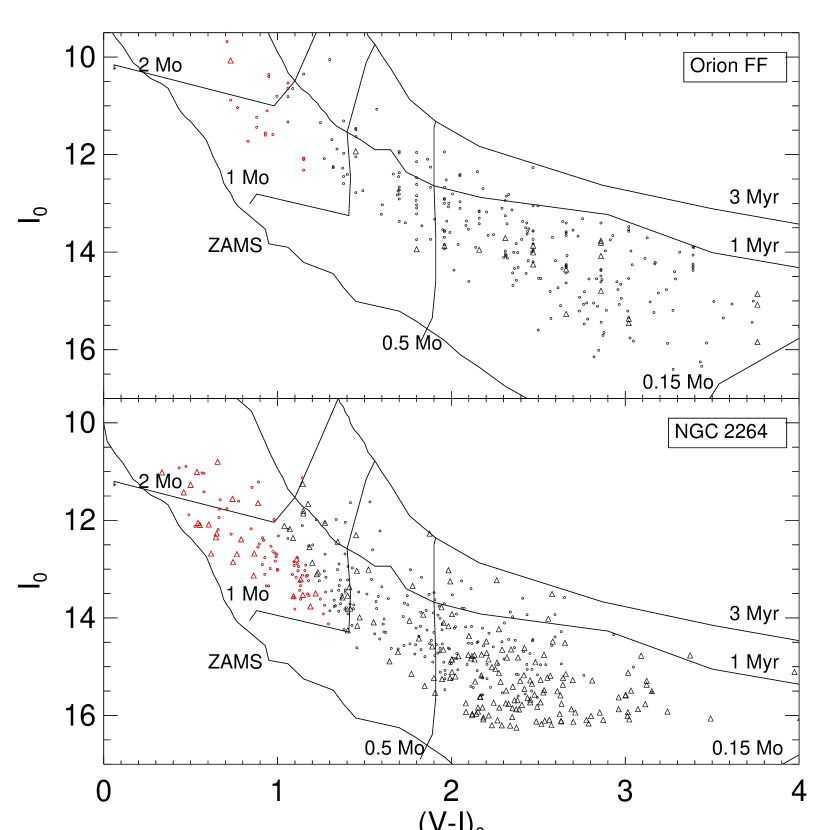
The sample considered here uses the best available information for each star, e.g., if there is a spectral type in the ADC, the star is dereddened by values specific to each star, and if there is no type available, the star is dereddened by the most likely reddening in the direction of the cluster (see Rebull et al. 2000, 2002 for more discussion on reddening towards these clusters). A CMD for this sample appears in Figure 1. This constitutes the “best possible sample” for both clusters. Note that there are no stars included in this sample that fall outside the model grid. Note also that despite using two different models, DAM and SDF, the number of stars in the best possible sample using DAM models is very similar to the best possible sample using SDF models.
For each of the evolutionary models (DAM & SDF) depicted in Figure 1, the red symbols indicate the stars between 1 and 2.5 M☉ that are on radiative tracks (lines K and L in Table 1). There are very few of these radiative stars available in the FF, with only 1 X-ray detection (and 1 upper limit) using DAM models, and 18 X-ray detections (and 1 upper limit) using SDF models. But, in NGC 2264, using the DAM models, there are 17 X-ray detections and 16 upper limits; using the SDF models, there are 62 X-ray detections and 24 upper limits . The red, radiative points here are the “best possible radiative sample.”
Essentially all of the discussion that follows is restricted to stars on convective tracks with masses 2 M☉, e.g., the black points in Figure 1. The black, convective points here are the “best possible convective sample.” For the best possible convective sample, using DAM models, this leaves 249 detections and 79 upper limits in Orion so 24% of the best possible convective sample is upper limits; in NGC 2264, there are 300 detections and 123 upper limits, so 29% of the best possible convective sample in this cluster is upper limits. Similar numbers are obtained for SDF models; see Table 1. In most dicussions that follow, we consider only the convective sample. Where the radiative stars are included in subsequent discussion and plots, we note this explicitly. In plots that follow, where both the radiative and convective stars appear, the radiative stars are colored red.
Of this final, best possible sample of convective stars, we also want to know how many stars have measured periods and values (lines O and P in Table 1). There are 110 stars in the Orion FF with measured periods that are also detected in X-rays, and 14 stars with measured periods but upper limits in X-rays; there are 64 stars with measured and X-ray detections, and 4 with upper limits in X-rays. In NGC 2264, there are 181 stars with measured periods and X-ray fluxes, and 38 more with upper limits in . There are only 30 stars with measured and X-ray detections, and 3 more stars with upper limits in .
| Orion FF | NGC 2264 | |||
|---|---|---|---|---|
| criterion/a | detections | limits | detections | limits |
| A. X-ray detections | 416 | 683 | ||
| B. line A + opt/NIR counterpart | 348 (84% of A) | 509 (75% of A) | ||
| C. line B + spectral type | 115 (27% of A) | 294 (52% of A) | ||
| D. line B + V, I detection | 278 (67% of A) | 465 (68% of A) | ||
| E. line D + inferred cluster membership | 261 (94% of D) | 438 (94% of D) | ||
| F. upper limits for opt/NIR object in catalog | 147 | 1388 | ||
| G. upper limit for opt/NIR likely member | 84 | 479 | ||
| H. lines E & G + 16 (N2264 only) | 349 | 168 | ||
| I. BEST POSSIBLE SAMPLE | ||||
| line D (FF), line H (N2264) + DAM 2.5M☉+ age exists | 250 | 80 | 317 | 139 |
| J. line D (FF), line H (N2264) + SDF 2.5M☉+ age exists | 258 | 80 | 327 | 146 |
| K. line I, radiative tracks only, DAM models | 1 | 1 | 17 | 16 |
| L. line J, radiative tracks only, SDF models | 18 | 1 | 64 | 24 |
| M. line I, convective tracks only, DAM models | 249 | 79 | 300 | 123 |
| N. line J, convective tracks only, SDF models | 240 | 79 | 263 | 122 |
| O. line M + periods | 110 | 15 | 181 | 38 |
| P. line M + | 64 | 5 | 30 | 3 |
3 vs.
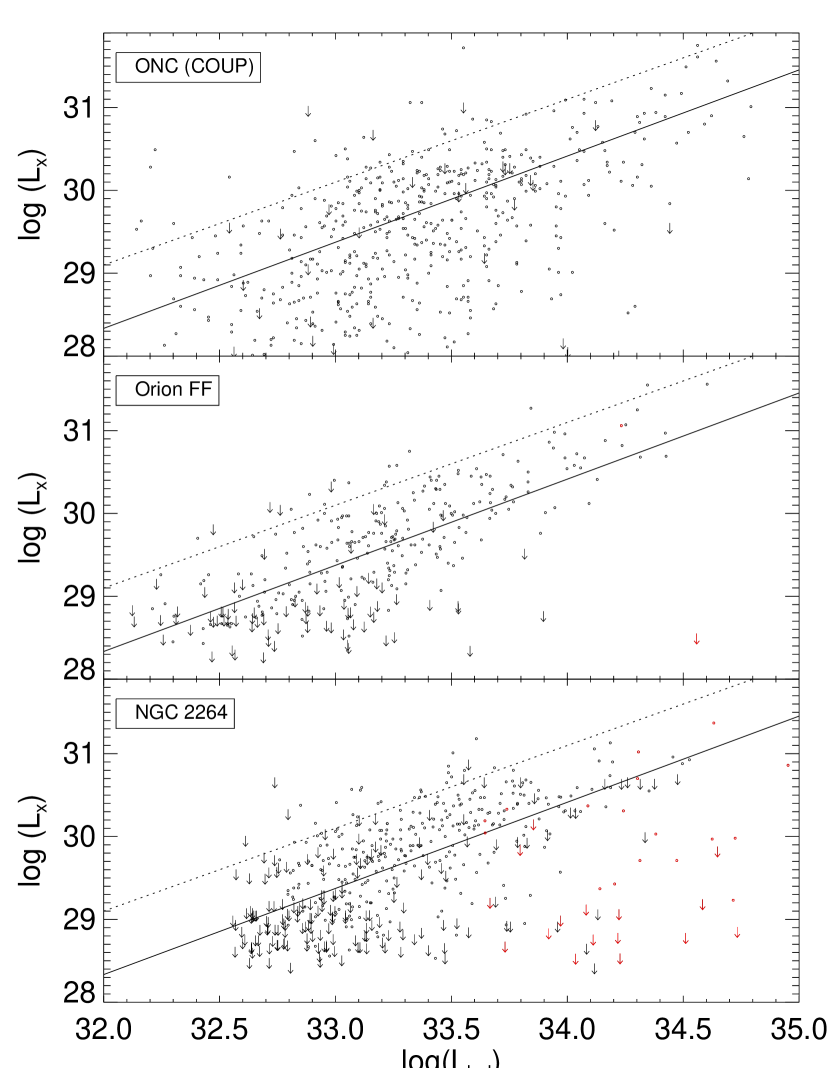

All recent investigations, including the COUP study (e.g., Preibisch et al. 2005b), have found a clear positive correlation between log and log but with a very large intrinsic (as opposed to instrumental) scatter (Feigelson et al. 2003).
Figure 2 shows the results for the ONC from the COUP sample, Orion FF, and NGC 2264. The best possible radiative sample for NGC 2264 and the Orion FF is shown in red, and the best possible convective sample is shown in black (essentially all of the COUP stars are convective). Also shown is the best fit straight line obtained by Preibisch et al. (2005b) for the ONC COUP data, which has a sensitivity limit of about log =27.0. This should be compared with a sensitivity limit of about log for our observations. The line derived for the ONC is a reasonable fit to the data for stars on convective tracks for both of our regions. We note, however, that many of our points near log 33.5 lie above the mean line for the ONC, and there is a cloud of points with low values of log that lie below the line near log 32.8, suggesting that perhaps a linear fit may not be appropriate. However, both of these features are also seen in the ONC plots and may thus reflect some inadequacy in the ability of a straight line to fit the data for both data sets. Figure 3 depicts the same data as in Figure 2, but in box plot form. These box plots have been used in other papers (e.g., Flaccomio et al. 2003c) as a mechanism for interpreting scatter plots. We emphasize that the boxes in Fig. 3 have been corrected using the Kaplan-Meier estimator for censored data to take into account the upper limits present in the data. The central line in each box denotes the (corrected) median; the ends of each box are the first and third quartile of the (corrected) distribution; the lines extend to the most extreme values that are not more than 1.5 times the interquartile range; and the open circles are those points outside 1.5 times the interquartile range. If downward-pointing triangles appear in the boxes, then the true (corrected) lower limit of the box is located at some unknown location below the line indicated. The top three panels in Fig. 3 contain only convective stars; the bottom panel contains only the radiative stars in NGC 2264 (there are not enough radiative stars in Orion to merit a separate plot). Examination of Fig. 3 reveals that the X-ray properties of the radiative stars are significantly different than those of the convective stars.
Preibisch & Feigelson (2005) used the Orion data to search for changes in X-ray emission with age. They assumed that the stars in Orion ranged in age from 0.1 to 10 Myr (Palla & Stahler 1999). Because contraction down the Hayashi tracks slows with increasing age, at ages of 3 Myr, typical uncertainties in derived luminosities and effective temperatures lead to age uncertainties of 2-3 Myr (1 errors, Hartmann 2001). Based on the ONC data alone, Preibisch & Feigelson concluded that the mean decayed slowly with age ( ) during the first 10 Myr for stars with masses in the range 0.5-1.2 M☉. However, in order to match the X-ray properties of ZAMS stars in young clusters, the decay of must be accelerated at ages 10 Myr. For stars with masses in the range 0.1-0.4 M☉ they found only a modest decrease in log during the first 100 Myr and a possible slight increase in log / over that same time period. Flaccomio et al. (2003c) also investigate trends of X-ray emission with time, comparing median levels of X-ray emission in several star-forming regions. They found constant log and an increase in log / with time through 3-4 Myr and a subsequent leveling off at saturation level (log / ).
Our own data are for clusters which contain stars that are on average older than the stars in the ONC. We see two differences with respect to the ONC data. First, the upper envelope in log for ONC data lies about 1.5 dex or a factor of 30 above the best fit straight line. For the Orion FF and NGC 2264, the upper envelope is only about a factor of 10 (1 dex) above the best fit straight line. As Fig. 2 also shows, very few of the Orion FF and NGC 2264 stars lie above the nominal “saturation” limit of log / , while a large number of ONC stars lie above this limit (Preibisch et al. 2005b). Quantitatively, 14% of the detected ONC stars have log / , and 4.6% have log / . For the Orion FF, the fractions are 5% and 0.4%, respectively, and for NGC 2264, the fractions are 7% and 0.9% respectively. In other words, there is a significantly larger number of stars with high and high / in the younger ONC. There are three possible explanations for this effect. First, it could be entirely an age effect, in that the most extreme levels of activity may decay during early PMS evolution. Second, it could be the intrinsic variability of the stars themselves in . Third it could be the intrinsic variability of the stars themselves in the optical photometry that goes into the estimate. In either of these latter cases, the variability could be more extreme in the younger stars, allowing for more outliers. With regards to the variability in , Favata et al. (2005), in studying the brightest 1% of the COUP flares, find some objects that flare 1-2 orders of magnitude, and that the characteristic times for these flares range from 10-400 ks. In the specific case of the COUP sample, however, as Preibisch & Feigelson (2005) point out, the influence of individual flares on the total reported for any one star is reduced by the long time baseline of their observations. Thus, outliers solely due to flares in the COUP data set are less likely than in the other (much shorter) observations. Variability in the optical data that go into calculation of may account for some fraction of the outliers; optical variability can exceed a magnitude. Rebull et al. (2002b) discussed the sources of these errors in detail for stars with spectral types over limited mass ranges and in regions of less reddening. For the COUP sample in particular, even though reddening is a concern, spectral types are known for every object, and so it is unlikely that this can account for all (or even most) of the outliers. More data on time variability will be required to determine why there are more outliers with high in the ONC.
The lower envelope of the X-ray detected stars in all three regions for both and /, however, is comparable for stars with similar to that of the Sun, and so the decay in the mean and lower bounds of the X-ray luminosities with time during the first 5 Myr of PMS evolution indeed appears to be small, as Preibisch & Feigelson (2005) reported for the ONC alone. Unfortunately, because of the shallow depth of our current survey, we cannot compare the lower bounds of the detections of stars with M M☉ in these three regions. Since more than half the stars in our sample were detected, we can compare the median log and log / for the best possible convective sample in all three clusters. The median log for the ONC (further restricted to 0.16 M☉to account for the difference in survey depths), the Orion FF, and NGC 2264 are 29.55, 29.71, and 29.90, respectively; the median values of log / (in the same order) are , , and . (There are some upper limits in this sample, so as a simple worst-case test, we recomputed the medians, adopting the upper limits for all stars as detections, and it does not change these median values very much.) These results are consistent with that obtained by COUP for the ONC. While it is true that the most luminous objects have disappeared by the age of NGC 2264, there is not much change in the median values. We certainly do not see a significant decrease during the first 5 Myr, in agreement with the Preibisch & Feigelson (2005) work on the ONC alone.
4 X-ray properties and stellar structure: the transition from convective to radiative tracks
In this section, we compare the X-ray properties of low mass stars still located on fully convective tracks with those of higher mass stars, some of which appear to lie on convective tracks, while others of slightly greater age have developed radiative cores and are proceeding toward the main sequence along radiative tracks. In Figure 1, the stars on radiative tracks are indicated.
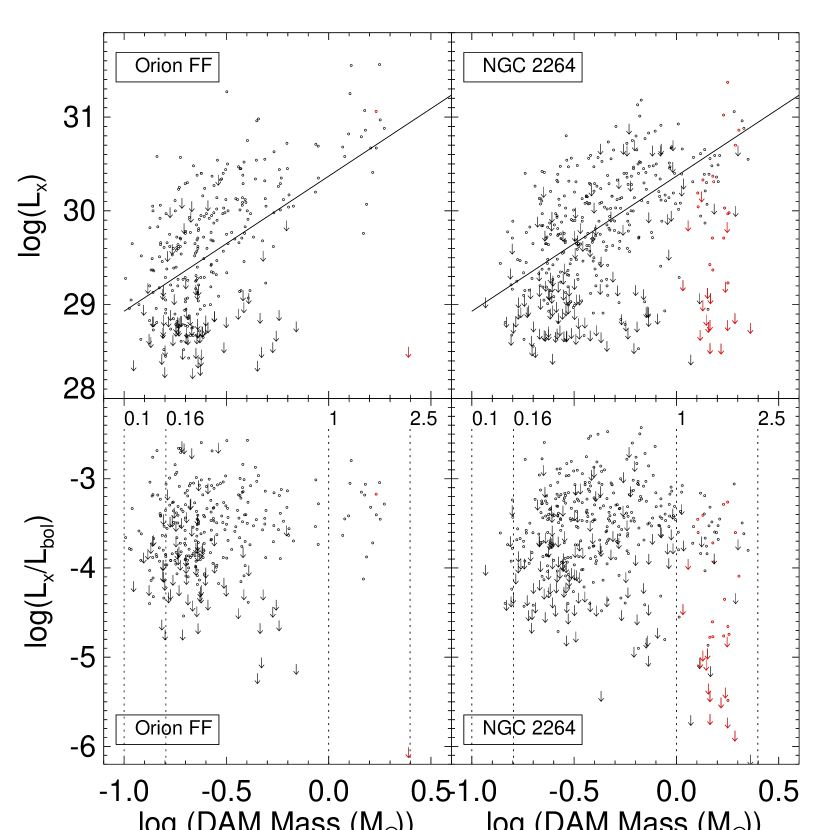
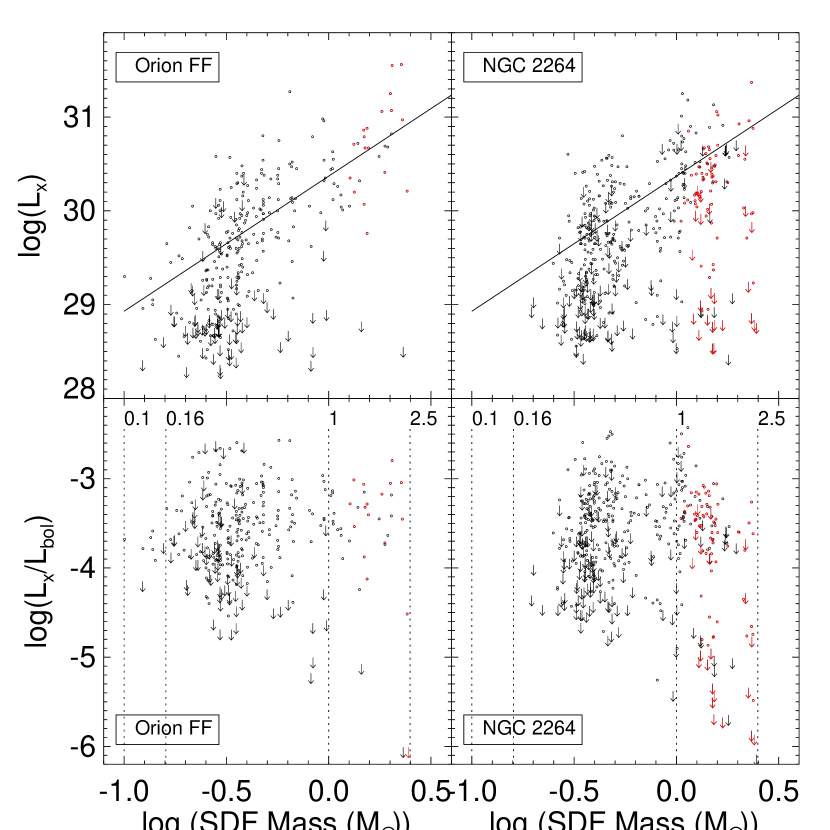
In Figures 4 and 5, we plot log and log / vs. mass, retaining the red (radiative) and black (convective) convention. Among the detections, the stars on radiative tracks have lower values than their similar mass counterparts located on convective tracks; moreover, there is a higher fraction of upper limits among the radiative stars than among the convective stars. Examining solely stars with detections in NGC 2264, the median log / for all convective stars between 1 and 2.5 M☉ is 3.51; the median log / for radiative stars (over the same mass range) is 4.01. However, many of the values for radiative stars are upper limits; adopting the upper limits for all stars as detections at the level of their upper limits, the median log / for the convective stars changes subtly to 3.54, while the median for the radiative stars changes to 4.48. By assigning the upper limits to be “detections,” we of course obtain a conservative limit on the median log /; even so, the medians for the convective and radiative samples differ by a factor of 10. Evidently the transition from a fully convective state to a radiative-core convective envelope configuration results in a dramatic decrease in coronal activity as diagnosed by X-rays; Gagne et al. (1995) also report differences in the X-ray properties between the convective and radiative stars in Orion based on ROSAT observations (see also Strom 1994 and Flaccomio et al. 2003b).
We have examined the COUP data to search for a similar trend among the ONC sample. Unfortunately, because the region is younger, too few stars have evolved to their radiative phases to enable a convincing test.
Preibisch et al. (2005b) reported a weak but significant correlation between log / and mass. Spearman’s correlation coefficient does not find any significant correlations in our data for the Orion FF and NGC 2264. However, we note that our survey covers a much smaller mass range than COUP. Restricting the comparison with COUP data to the same mass range reveals no clear trends in either sample. Because our data are dominated at low masses by upper limits, we are also unable to search for mass-dependent differences in log / as reported by Flaccomio et al. (2003b, 2003c), who find similar log vs. mass relationships to that reported by Preibisch et al. (2005b).
The conclusion that X-ray luminosity is related to the interior structure of PMS stars is of course valid if and only if stars assigned to radiative tracks are placed correctly in the HR diagram, are predominantly members of the Orion FF and the ONC, and if the X-ray flux is not dominated by a faint companion that is not visible in the optical. We now examine each of these requirements for NGC 2264, which has the largest number of massive stars in apparent post-convective evolution.
How accurately have we located these stars in the HR diagram? These stars are among the brightest stars in the cluster, and for 94% of the radiative stars (both detections and upper limits), we have spectral types; they range in type from A0 to K4. Because we have types, we are able to deredden each star individually with a correction appropriate to that specific star. Therefore, the placement of these stars in the dereddened CMD would appear to be as secure as possible for young (often variable) stars. These stars appear in the correct vertical position to be taken as cluster members; they do not appear significantly above or below the ZAMS for a cluster at the distance of NGC 2264. We therefore believe that most of these stars are members based on position in the HRD.
Because these stars are among the brighter stars in the cluster, we have preliminary proper motions (see Rebull et al. 2002) for 54% of the stars on radiative tracks; 33% of the red points (detections and upper limits) in Figure 1 (DAM models) are likely members, 22% are likely non-members, and the rest have no proper motion membership information available. Of the available sample, at least 60% of the stars are thus members based on proper motions.
Another indicator of likely membership is the presence of a circumstellar disk. Seventy percent of the best possible radiative sample has positive circumstellar and/or accretion disk indicators, suggesting at least 70% of the sample are indeed members.
Are unresolved binaries important? They may play a role, particularly in the case of X-rays where low-mass companions can outshine their primaries. However, what we have shown is that the fluxes of the stars on radiative tracks are systematically lower than those of stars with similar masses on convective tracks. If optically fainter companions do contribute some of the flux, then the discrepancy must be even larger.
In summary, then, we believe that most (70%) of the best possible radiative sample are indeed cluster members. We therefore conclude that there is a significant decrease in X-ray luminosity as stars of similar mass evolve from convective tracks, where log / values lie close to the “saturation limit,” to radiative tracks, where / values are 10 times smaller. In support of this result we note two additional observations: 1) the apparent ‘bifurcation’ in / disappears for masses lower than about 0.5 M☉ which is approximately the mass below which stars remain fully convective from the stellar birthline to the ZAMS; and 2) the levels of and / for stars on radiative tracks are roughly in agreement with the values found in this mass range in the NEXXUS survey of nearby field stars (Schmitt & Liefke 2004).
| work | instrument | cluster | range of aaValues in parentheses are for the low-mass stars in the sample. | disk indicator | conclusion on disksbb“C” = CTTS; “W” = WTTS | conclusion on rotation |
|---|---|---|---|---|---|---|
| Bouvier (1990) | Einstein | Taurus-Auriga | log=27-32 | H10Å | no diff. | anti-correl. |
| Feigelson et al. (1993) | ROSAT/PSPC | Cham I | 2 to 5 | EW(H)10Å | (C)(W) but no diff. within sel. eff. | no correl. |
| Gagne & Caillault (1994) | Einstein | ONC | 2 to 7 | , H | no difference | no correl. |
| (2 to 4.5) | ||||||
| Damiani & Micela (1995) | Einstein | Taurus-Auriga | 3 to 5 | IRAS-25 | WTTS fainter | weak anti-correl. with scatter |
| Gagne et al. (1995) | ROSAT/HRI | ONC | 2 to 7 | (C)(W) | no correl. | |
| (2 to 5) | ||||||
| Casanova et al. (1995) | ROSAT/PSPC | Oph | 2 to 5 | Class 0-3 | (embedded)(less embedded), no diff. | N/A |
| Neuhauser et al. (1995) | RASS | Taurus-Auriga | 4 to 7 | EW(H)-15 Å | (C)(W) | correl. |
| (C) harder than W | ||||||
| Lawson et al. (1996) | ROSAT/PSPC | Cham I | 2 to 5 | H | no difference | N/A |
| Preibisch (1997) | ROSAT/PSPC | several | log=27-32 | N/A | N/A | anti-correl. |
| Alcala et al. (2000) | RASS | Orion | log31 | N/A | N/A | no correl. for K stars |
| Wichmann et al. (2000) | RASS | Taurus-Auriga | 2.5 to 5 | N/A | N/A | correl. |
| Flaccomio et al. (2000) | ROSAT/HRI | NGC 2264 | 2 to 5 | H | no difference, but C more variable | N/A |
| (2 to 4) | ||||||
| Grosso et al. (2000) | ROSAT/HRI | Oph | 2 to 4 | ISO data | no difference | N/A |
| Stelzer et al. (2000) | ROSAT/PSPC | Taurus-Auriga | HBC listing W/C | (C)(W) but stronger flares, | anti-correl. | |
| & C more variable | ||||||
| Imanishi et al. (2001) | Chandra/ACIS | Oph | Class 0-3 | (Class I)(Class II & III) | N/A | |
| Stelzer & Neuhauser (2001) | ROSAT/PSPC | Taurus-Auriga | 3 to 6 | EW(H) 10Å | (C)(W) | correl. |
| Preibisch & Zinnecker (2002) | Chandra/ACIS | IC 348 | 2 to 6 | EW(H) 10 Å, | (C)(W), but likely to be sel. eff. | N/A |
| (2 to 4.5) | (goes away for | |||||
| Feigelson et al. (2002, 2003) | Chandra/ACIS | Orion (ONC) | 2.5 to 6 | no difference | weak correl. | |
| Getman et al. (2002) | Chandra/ACIS | NGC 1333 | no difference | N/A | ||
| Tsujimoto et al. (2002) | Chandra/ACIS | OMC-2, OMC-3 | Class 0-3 | of C higher than W, but poss. sel. eff. | N/A | |
| Flaccomio et al. (2003a) | ROSAT/HRI | NGC 2264, | 2 to 7.8 | (C)(W) | N/A | |
| Cham I | (2 to 5) | |||||
| Flaccomio et al. (2003b) | Chandra/HRC | ONC | 2 to 7.8 | EW(Ca II) 1 Å | (C)(W) | no correl.; stars with high |
| (2 to 5) | ||||||
| Stassun et al. (2004) | Chandra/ACIS | ONC | 2 to 6 | EW(Ca II) 1 Å | (C)(W) | log / correl. with P, but not |
| ; stars with high | ||||||
| Feigelson & Lawson (2004) | Chandra/ACIS | Cham I | =28-31 | various | (C)(W) (slightly) | N/A |
| Preibisch (2005) | XMM/EPIC | Serpens | literature | Class I more variable than Class II+III | N/A | |
| Ozawa et al. (2005) | XMM/EPIC | Oph | 2 to 5 | literature | Class I higher T, absorp. than II+III | N/A |
| Preibisch et al. (2005b) | Chandra/ACIS | ONC (COUP) | to 6 | , | accretors less active | weak correl. |
| , EW(Ca II) |
5 X-ray Emission and Rotation


Flaccomio et al. (2003b) first found evidence that stars in the ONC for which rotation periods are known to have higher X-ray luminosities than stars which show no clear evidence of spot-modulated rotation; Stassun et al. (2004) confirm this result.
The same trend is seen among fully convective stars ( 0.5 M☉) in both the Orion FF and NGC 2264. Figure 6 shows that the stars with derived periods in these two associations are clearly brighter in log /, and, conversely, stars that are bright in log / are more likely to have a measurable period. For the best possible convective sample (plotted in Figure 6), the best-fit slopes to the lower panels in the Figure are (for the FF) 0.340.05, and (for NGC 2264) 0.260.05. These values do not change significantly when considering other possible subsamples of the data. Median values of log / for the best possible convective sample for the ONC, FF, and NGC 2264, for the sample with periods, are (respectively) , , and . For the best possible convective sample without periods (in the same order), the medians are , , and . It is clear that the samples with measured are brighter in X-rays (and again there are no trends with age).
In searching for correlations between X-ray emission and rotation rates of PMS stars, another concern is whether the sample of stars with known periods represents the full range of rotation rates for PMS stars. It might be, for example, that periodic stars are biased toward PMS stars dominated by either long or short rotation periods, or by stars viewed more nearly equator-on than pole-on. The study of periods and in the ONC by Rhode et al. (2001) concluded that there was no difference in the distribution of rotation rates for samples of stars with periods and samples of stars with . A similar test is performed for the current data set in Figure 7. For the purpose of this graph, rotational velocities have been derived from and an estimate of the radius (see, e.g., Rebull et al. 2002 for more on this calculation); the values have been converted to velocity by multiplying the observed rates by 4/ to allow for inclination effects (Chandrasekhar & Muench 1950; Gaige 1993). The Orion FF appears to exhibit a relative paucity of objects with low . However, this reflects the resolution limit of the data rather than a real physical effect. Taking this into account, we conclude from these data that there is no apparent bias in the period-selected sample. However, our data set is too sparse to distinguish whether the distribution for the low / stars that lack periods differ from the ensemble distribution.
Why are we more likely to be able to determine periods from photometric monitoring programs for stars with large values of log /? In order to obtain an optical photometric period, we require a clear view of the stellar photosphere where there are large, stable, relatively isolated spots or spot groups rotating into and out of view causing periodic modulations. Stassun et al. (2004) have suggested that perhaps more active stars have larger and/or more organized magnetic spot coverage and that periodic variations are more easily measured in such circumstances. If so, then stars with more organized spots also have higher levels of coronal activity leading to higher X-ray luminosity.
Since the earliest days of X-ray astronomy, investigators have sought a relation between rotation rate (periods or ) and X-ray luminosity for PMS stars. Because the X-ray flux is thought to originate in coronal activity which is driven by convection and rotation, and because faster-rotating main sequence stars are brighter in X-rays (e.g., Stauffer et al. 1994, Micela et al. 1996, Pizzolato et al. 2003), it was perhaps reasonable to expect to find a similar relation in younger stars, but the evidence remains mixed. Table 2 contains a listing of the conclusions on this topic from the literature to date. Most recently, the COUP project (Preibisch et al. 2005b) found a weak but statistically significant correlation between P and log /.
Figure 8 plots log and log / against log period for our sample, and Figure 9 shows the same data but in box plot form. There is no significant trend in these plots, nor in similar plots of X-ray emission against linear , , or . Upper limits are found at all periods and rotation rates. The current data do not support as strong a correlation between period and fractional X-ray luminosity as the one reported for the ONC by Preibisch et al. 2005b. We also do not find the same correlations as can be found in main sequence stars.


6 Disk and Accretion Effects


Two processes associated with disk accretion can, in principle, affect the observed X-ray properties of solar-type PMS stars: (1) local heating of the stellar photosphere at the ‘footprints’ of magnetospheric funnel flows, where highly supersonic ( 200 km sec1) gas lands on the stellar surface (e.g. Kastner et al. 2002; Schmitt et al. 2005), producing shocks, local heating and, as a result soft X-rays; and (2) absorption of keV coronal X-ray emission by gas associated with accretion-driven outflows (Walter & Kuhi, 1981). The first of these processes would qualitatively produce an increase in X-ray emission above coronal activity levels as disk accretion rates increase. Quantitative estimates of the magnitude of the expected increase are not available, owing primarily to the complexity of the detailed radiative transfer studies needed to estimate the X-ray flux emerging from accretion spots. The second process would produce a decrease of X-ray emission with increasing accretion rate, since the column density, and hence the X-ray optical depth of outflowing material, is expected to increase with increasing accretion rate. For isotropic outflows, significant 5 keV absorption is expected to occur for mass outflow rates of M☉ yr-1 or mass accretion rates of M☉ yr-1.
There has been a great deal of work attempting to uncover relationships between circumstellar disks, and/or disk accretion, and/or X-ray emission (either log or log /). Table 2 collects the conclusions from large surveys of X-ray emission for accreting and non-accreting PMS stars. Kastner et al. (2002); and Schmitt et al. 2005 find evidence of enhanced X-ray emission associated with transient increases in disk accretion rate, thus suggesting that at least some X-ray emission may be associated with accretion as opposed to coronal activity. In ensemble, there is no evidence of excess X-ray emission for accreting PMS stars. Rather, the trend, if any, is for an anti-correlation between the presence of an accretion disk and total X-ray luminosity.
Walter & Kuhi (1981) were the first to report an inverse correlation between soft X-ray flux and H emission for classical T Tauri stars. Working under the assumption that the observed equivalent width of H serves as a surrogate for mass outflow rate, they argued that the apparent decrease of X-ray emission with increasing H equivalent width reflected the effects of X-ray absorption by outflowing gas. More recently, Flaccomio et al. (2003b) find a similar result: a larger fraction of stars with active accretion signatures, there measured by Ca II emission, have fainter values than non-accretors when stars of similar masses are compared. Stassun et al. (2004) also report a similar result for a sample of young solar-like PMS stars, particularly for those stars with 0.5 M☉. Preibisch et al. (2005b) find significantly lower X-ray emission for accreting as opposed to non-accreting PMS stars (as selected on the basis of Ca II triplet emission equivalent width), for the restricted mass range 0.3-0.5 M☉. They also find that the non-accretors show a better-defined correlation between and than the accretors, that the median value of / is nearly a factor of three lower for accretors, and that there is a weak anti-correlation of the fractional X-ray luminosity with accretion rate. In looking for correlations of X-ray emission with the presence/absence of accretion disks, but for which there is no direct evidence of accretion, Preibisch et al. (2005b) find, somewhat surprisingly, that there are significant differences in / for stars with and without near-IR excesses, but no differences for stars with and without excesses; is usually considered to be a more reliable disk indicator.
In our particular case, we have three different disk and/or accretion indicators (, , and excesses) for both clusters, and a fourth indicator (H equivalent widths) for NGC 2264. We note that the H measurements were only obtained for stars with classification spectra in NGC 2264. Most of these spectra were obtained as part of the studies by Rebull et al. (2002) and Makidon et al. (2004), where the goal was to classify stars with known periods. Therefore, the sample of stars with H is likely to be biased toward stars that are brighter in X-rays (see Figure 6).
The numbers of stars available from the best possible sample are summarized in Table 3. While and excesses indicate the presence of either passive or actively accreting circumstellar disks, excesses and H arise from active accretion; excesses have already been translated directly to mass accretion rates for many of our targets (Rebull et al. 2000, Rebull et al. 2002).
Based on previously published results, we might expect that any correlations between total and fractional X-ray luminosity and stellar properties are likely to be weak (and in fact they are). We show plots for two of our available diagnostics of disks and/or accretion in Figures 10 and 11. Note that, for the near-IR disk indicators, redder colors suggest disks, whereas for , bluer colors suggest accretion. The placement of the disk cutoffs is discussed in Rebull et al. (2002, 2000), along with comparison of the disk indicators for the same stars.
There is a very large amount of scatter in these two figures, plus their companions ( and H) which are not shown, although the scatter is somewhat smaller in the plots with log / than in the plots against log . For this reason, we have chosen to show only the box plot representations of these data.
No statistically significant or consistent trends are seen in Fig. 10 or 11 (or in similar plots with the other available disk indicators). In stars without evidence for disks, we find examples of stars in which is high and log / is close to 3, but comparable large values are not seen in stars with disks or active accretion. The upper bound on both the total and fractional X-ray luminosity appears to decrease with increasing excess for NGC 2264 (but not the FF) and in increasing excess for the FF (but not NGC 2264). The X-ray fluxes do not appear to depend on excess for either cluster or in H for NGC 2264. These confusing, inconsistent results suggest that if there is any trend, it is subtle, and, despite the numbers of points we have (see Table 3), we require many more data points to securely detect it.
| Orion FF | NGC 2264 | |||
|---|---|---|---|---|
| disk indicator | non-disk | disk | non-disk | disk |
| detections (limits) | detections (limits) | detections (limits) | detections (limits) | |
| excess | 129 (38) | 109 (37) | 226 (42) | 63 (21) |
| excess | 171 (56) | 64 (15) | 236 (56) | 52 (15) |
| excess | 28 (4) | 25 (3) | 87 (14) | 151 (48) |
| H eqw | 77 (8) | 46 (12) | ||

Figure 12 looks for correlations explicitly with log as derived from the excess as in Rebull et al. (2000, 2002). The data in the Orion FF are too sparse to reach any conclusion. For NGC 2264, however, there may be evidence of a trend: the upper envelope of / is near for stars with accretion rates yr-1, but progressively decreases by nearly a factor of 10 for stars with higher accretion rates – a result in concordance with previously reported anti-correlations between X-ray luminosity and accretion for solar-like PMS stars.
It is perhaps surprising that there are no clear correlations of X-ray emission with either the presence/absence of accretion disks, or the magnitude of accretion rate apparent from our data, particularly given the plausibility of proposed X-ray production and absorption processes. Perhaps the intrinsic range in X-ray emission properties is so large that trends are difficult to discern, even with samples as large as several hundred stars. Alternatively, it may be that multiple mechanisms are at work simultaneously, and sorting among them may require a somewhat finer characterization of X-ray properties than Lx – the single property thus far used in searching for accretion-related correlations.
We anticipate that the COUP data, in combination with the Orion Treasury program (Robberto et al. 2005) and the Spitzer data in Orion (Megeath et al. 2006) will provide considerably more insight into the physical processes accompanying disk accretion. In particular, the Treasury Program will provide robust estimates of ultraviolet excess emission for a large sample, which in combination with extant optical spectroscopic studies yielding and estimates, should provide accretion rate estimates for a large (perhaps 1000 stars) sample of accreting PMS stars. The deep COUP exposures of the ONC (20 the length of the Chandra observations reported here) should provide well-characterized X-ray spectral energy distributions from 0.5 to 5 keV – sine qua non for sorting the relative contributions of soft X-ray emission that may arise from accretion, harder coronal X-ray emission and the effects of absorption arising in mass outflows.
7 Conclusions
We have studied the X-ray properties of stars in the Orion FF and NGC 2264. With ages of 1 Myr and 3 Myr respectively, both regions contain stars that are older than most stars in the ONC. Rotation periods are available for a relatively large fraction of the PMS population in these regions. Furthermore, NGC 2264 contains a significant number of stars that have made the transition to radiative tracks. These samples thus enable study of evolution- and rotation-driven changes in X-ray properties over the age range 1-5 Myr.
The data for the Orion FF and NGC 2264, when combined with the much more extensive data from the COUP survey of the ONC, establish a number of clear patterns in the behavior of X-ray emission in PMS stars. In all three regions, log for stars on convective tracks correlates positively with both log and also with stellar mass, not surprisingly since log is strongly correlated with mass. As Preibisch et al. (2005b) point out, a strong correlation between X-ray emission and stellar properties argues that the X-ray emission probably originates primarily in compact (coronal?) structures associated with the star. We confirm as well that the level of X-ray emission is directly related to stellar structure in that the level of emission drops on average by 10 when PMS stars with masses in the range 1-2 M☉ make the transition from fully convective to radiative tracks, where stars of about solar mass have radiative cores and convective envelopes.
The fractional X-ray luminosity, log /, is not strongly correlated with mass for stars on convective tracks; the scatter in the relationships of both log and log / with mass is large. The physical reasons for this large scatter remain unclear. Age is apparently not a large contributor; while there is evidence the ONC has nearly twice as many stars with extremely high X-ray emission (log / ) as the Orion FF and NGC 2264, we see little change in median values of either log or log / during the first 5 Myr of evolution down convective tracks. In sharp contrast to main sequence stars, we find no correlation between log and log / with or for stars on convective tracks, although more data are needed in NGC 2264. Preibisch et al. (2005) have argued that X-ray variability at typical levels is likely to be too small to account for the scatter in /.
In both the Orion FF and NGC 2264 we find, in agreement with earlier studies of the ONC, that stars with larger values of log / are more likely to exhibit spot-modulated periods. Approximately of the stars with log / are periodic, while while only about of the stars with log / have periods, and this difference does not appear to be the result of any biases in the samples. It may well be that, as Stassun et al. (2004) have suggested, more active stars have larger and/or more organized magnetic spot coverage and that periodic variations are more easily measured in such circumstances.
We have searched for a correlation between log and log / and 1) near-IR excess, which is a circumstellar disk indicator; 2) UV excess and H, both of which are indicators of accretion; and 3) the mass accretion rate, as inferred from the UV excess. There is substantial scatter in all of these relationships, and no clear trends emerge. Discovery of the relationship, if any, between accretion and X-ray emission awaits the combination of COUP results, which provides measures of X-ray luminosity and X-ray spectral energy distributions, with the corresponding results from the ongoing HST Orion Treasury program, which promises to provide accurate estimates of accretion rates for large samples of PMS stars, and the Spitzer data in Orion, which will provide more accurate mid-IR disk indicators.
References
- Alcala (2000) Alcala, J., et al. 2000, A&A, 353, 186
- Bouvier (1990) Bouvier, J. 1990, AJ, 99, 946
- Casanova (1995) Casanova, S., et al. 1995, ApJ, 439, 752
- Chandra (1950) Chandrasekhar, S. & Muench, G. 1950, ApJ, 111, 142
- Dahm & Simon (2005) Dahm, S., & Simon, T. 2005, AJ, 129, 829
- Damiani & Micela (1995) Damiani, F., & Micela, G. 1995, ApJ, 446, 341
- D’Antona & Mazzitelli (1994) D’Antona, F., & Mazzitelli, I. 1994, ApJS, 90, 467 (DAM)
- D’Antona & Mazzitelli (1998) D’Antona, F., & Mazzitelli, I. 1998, http://www.mporzio.astro.it/dantona/prems.html (DAM)
- eisner (05) Eisner, J., et al. 2005, ApJ, 623, 952
- (10) Favata, F., et al. 2005, ApJS, 160, 469
- Feigelson (1993) Feigelson, E., et al., 1993, ApJ, 416, 623
- Feigelson (1999) Feigelson, E. & Montmerle, T. 1999, ARAA, 37, 363
- Feigelson (2002) Feigelson, E., et al., 2002, ApJ, 574, 258
- Feigelson (2003) Feigelson, E., et al., 2003, ApJ, 584, 911
- Feigelson (2004) Feigelson, E., et al., 2004, in Proceedings of “Cool Stars 13,” July 2004, Hamburg, Germany
- FeigelsonLawson (2004) Feigelson, E., & Lawson, 2004, ApJ, 614, 267
- Flaccomio (1999) Flaccomio, E., Micela, G., Sciortino, S, Favata, F., Corbally, C., & Tomaney, A. 1999, A&A, 345, 521
- Flaccomio (2000) Flaccomio et al. 2000, A&A, 355, 651
- Flaccomio (2003a) Flaccomio et al. 2003a, A&A, 397, 611
- Flaccomio (2003b) Flaccomio et al. 2003b, ApJ, 582, 398
- Flaccomio (2003c) Flaccomio et al. 2003c, A&A, 402, 277
- Flaccomio (2005) Flaccomio et al. 2005, Mem. S. A. It., 76, 279
- Flaccomio (2005b) Flaccomio et al. 2006, in preparation
- Gagne (1994) Gagne, M., & Caillault, J.-P., 1994, ApJ, 437, 361
- Gagne (1995) Gagne, M., Caillault, J.-P., & Stauffer, J., 1995, ApJ, 445, 280
- Gaige (1993) Gaige, Y. 1993, A&A, 269, 267
- Getman (2002) Getman, K., et al., 2002, ApJ, 575, 354
- Getman (2005) Getman, K., et al., 2005, ApJS, 160, 352
- Grosso (2000) Grosso et al. 2000, A&A, 359, 113
- (30) Guedel, M., et al. 2005, ApJ, 626, 53
- Gullbring (1998) Gullbring, E., et al. 1998, ApJ, 492, 323
- (32) Hartmann, L. 2001, ApJ 121, 1030
- Hillenbrand (97) Hillenbrand, L., 1997, AJ, 113, 1733
- Hillenbrand (2004) Hillenbrand, L., & White, R., 2004, ApJ, 604, 741
- Imanishi (2001) Imanishi, K., et al., 2001, ApJ, 557, 747
- Kastner (1997) Kastner, J., et al. 1997, Science, 277, 67
- Kastner (2002) Kastner, J., et al. 2002, ApJ, 567, 434
- Kastner (2005) Kastner, J., et al. 2005, ApJS, 160, 511
- KenyonHartmann (1995) Kenyon, S., & Hartmann, L., 1995, ApJS, 101, 117
- Königl (2000) Königl, A. & Pudritz, R., 2000, in Protostars and Planets IV, (Tucson: University of Arizona Press; eds Mannings, V., Boss, A.P., Russell, S. S.), p. 759
- Königl (1991) Königl, A. 1991, ApJ, 370, L39
- Königl (1989) Königl, A. 1989, ApJ, 342, 208
- Lamm (2004) Lamm, M., et al. 2004, A&A, 417, 557
- Lawson (1996) Lawson et al. 1996, MNRAS, 280, 1071
- Makidon (2004) Makidon, R., et al. 2004, AJ, 127, 2228
- (46) Megeath, T., 2006, in prep
- Messina (2003) Messina, S., Pizzolato, N., Guinan, E., Rodono, M. 2003, A&A, 410, 671
- Micela (1996) Micela, G., et al. 1996, ApJS, 102, 75
- (49) Morrison, R., & McCammon, D., 1983, ApJ, 270, 119
- Muzerolle (2003) Muzerolle, J, et al. 2003, ApJ, 597, 149
- Najita (2003) Najita, J., et al. 2003, ApJ, 589, 931
- Neuhauser (1995) Neuhauser, R., et al. 1995, A&A, 297, 391
- Ozawa (2005) Ozawa, H., Grosso, N., Montmerle, T. 2005, A&A, 429, 963
- Park (2000) Park, B.-G., et al. 2000, AJ, 120, 894
- Pizzolato (2003) Pizzolato, N., Maggio, A., Micela, G., Sciortino, S., Ventura, P., 2003, A&A, 397, 147
- Preibisch (1997) Preibisch, T., 1997, A&A, 320, 525
- Preibisch (2002) Preibisch, T. & Zinnecker, H. 2002, AJ, 123, 1613
- Preibisch (2005) Preibisch, T. 2005, A&A, 428, 569
- Preibisch (2005b) Preibisch, T. et al. 2005, ApJS, 160, 401
- Preibisch (2005c) Preibisch, T., & Feigelson, E., 2005, ApJS, 160, 390
- (61) Press, W. H., Teukolsky, S. A., Vetterling, W. T., Flannery, B. P., 1992, Numerical Recipes in C, 2nd edition (Cambridge: Cambridge University Press)
- Ramirezetal (2004a) Ramirez, S., Rebull, L., Stauffer, J., Hearty, T., Hillenbrand, L., Jones, B., Makidon, R., Pravdo, S., Strom, S., Werner, M., 2004a, AJ, 127, 2659
- Ramirezetal (2004b) Ramirez, S., Rebull, L., Stauffer, J., Strom, S., Hillenbrand, L., Hearty, T., Kopan, E., Pravdo, S., Makidon, R., Jones, B., 2004b, AJ, 128, 787
- Rebull (2001) Rebull, L. 2001, AJ, 121, 1676 (R01)
- Rebull et al. (2000) Rebull, L., Hillenbrand, L. A., Strom, S. E., Duncan, D. K., Patten, B. M., Pavlovsky, C. M., Makidon, R. B., & Adams, M. T. 2000, AJ, 119, 3026
- Rebull et al. (2002) Rebull, L., Makidon, R. B., Strom, S. E., Hillenbrand, L. A., Birmingham, A., Yagi, H., Jones, B. F., Adams, M. T., & Patten, B. M. 2002, AJ, 123, 1528 (RMSH02)
- Rebull et al. (2002b) Rebull, L., Wolff, S., Strom, S, & Makidon, R. B. 2002b, AJ, 124, 546
- Rebull et al. (2004) Rebull, L., Wolff, S., & Strom, S. E., 2004, AJ, 127, 1029
- Rhodeetal (2001) Rhode, K., et al., 2001, AJ, 122, 3258
- Robberto (2005) Robberto, M., 2005, in “Star Formation in the Era of Three Great Observatories,” held July 13-15, 2005, in press.
- Schmitt (04) Schmitt, J., and Liefke, C., 2004, å, 417, 651
- Schmitt (05) Schmitt, J. et al. 2005, A&A, 432, L35
- Shu (1987) Shu, F. et al. 1987, ARAA, 25, 23
- Shu (2000) Shu, F., Najita, J., Shang, H., & Li, Z.-Y. 2000, in Protostars and Planets IV, ed. V. Mannings, A. P. Boss & S. S. Russell (Tucson: University of Arizona Press), p. 789
- SiciliaAguilar (2005) Sicilia-Aguilar, A., et al., 2005, AJ, 129, 363
- Siess et al. (2000) Siess, L., Dufour, E., & Forestini, M. 2000, A&A, 358, 593, and http://www-laog.obs.ujf-grenoble.fr/activites/starevol/evol.html (SDF)
- Sung (1997) Sung, H., Bessell, M., & Lee, S.-W. 1997, AJ, 114, 2644
- Sung (2004) Sung, H., Bessell, M., & Chun, M.-Y. 2004, AJ, 128, 1684
- Stassun (2004) Stassun, K. et al. 2004, AJ, 127, 3537
- Stauffer (1994) Stauffer, J. R., et al. 1994, ApJS, 91, 625
- strom (94) Strom, S., 1994, ASPC, 64, 211
- Stelzer (2000) Stelzer, B. et al. 2000, A&A, 356, 949
- Stelzer (2001) Stelzer, B. & Neuhauser, R., 2001, A&A, 377, 538
- Tsujumoto (2002) Tsujimoto, M., et al. 2002, ApJ, 566, 974
- Walter (1981) Walter, F., & Kuhi, L., 1981, ApJ, 250, 254
- Wichmann (2000) Wichmann, R., et al. 2000, A&A, 359, 181