Distribution of Positron Annihilation Radiation111Thanks to J.D. Kurfess, M.D. Leising and G. Weidenspointner for helpful discussions, and to the NASA Grants DPR S-13801-G and NNG05GK37G for support.
Abstract
The SPI instrument on-board the ESA/INTEGRAL satellite is engaged in a mission-long study of positron annihilation radiation from the Galaxy. Early results suggest that the disk component is only weakly detected at 511 keV by SPI. We review CGRO/OSSE, TGRS and SMM studies of 511 keV line and positronium continuum emission from the Galaxy in light of the early INTEGRAL/SPI findings. We find that when similar spatial distributions are compared, combined fits to the OSSE/SMM/TGRS data-sets produce bulge and disk fluxes similar in total flux and in B/D ratio to the fits reported for SPI observations. We further find that the 511 keV line width reported by SPI is similar to the values reported by TGRS, particularly when spectral fits include both narrow-line and broad-line components. Collectively, the consistency between these four instruments suggests that all may be providing an accurate view of positron annihilation in the Galaxy.
keywords:
1 Introduction
The successful launch and operation of the SPI instrument on-board ESA’s INTEGRAL satellite has renewed interest in the study of positron annihilation in the Galaxy. Numerous publications have resulted from the analysis of subsets of the first years of the SPI data-set. Both the spatial distribution and the spectral features have been studied, and preliminary findings of the analysis of the positronium continuum component is currently in preparation. In terms of the spatial distribution of the 511 keV line component, the early mapping results point to an intense bulge emission, better explained by an extended distribution than by a point source. The disk component has been either absent, or weakly detected in the initial results. The spectrum has revealed that the line centroid is centered at 511 keV with a line profile that can be separated into two components. These findings have motivated speculation as to the source(s) of the bulk of galactic positrons, both through further study of previously suggested sources, and through the development of new mechanisms. Collectively, the findings from SPI and the speculation that it has generated makes this a very interesting time for positron annihilation astrophysics.
The impression exists that the SPI findings are in disagreement with the spatial distributions reported by the previous missions, most notably by the CGRO/OSSE instrument. In particular, the total flux reported in many SPI-based publications is lower than the total fluxes reported by Purcell et al. 1997 and Milne et al. 2002, based upon OSSE/SMM/TGRS observations. Many SPI-based publications report no statistical requirement for the existence of a disk component to explain their observations. It is critical for the advancement of positron annihilation astrophysics to determine whether this impression of disagreement is correct, or rather a false impression generated by differing points-of-emphasis between the different teams presenting results from their instruments.
In this paper, we present a few simple comparisons between SPI results and those reported by OSSE, SMM and TGRS. In all cases, we have tried to compare similar models to the extent possible from the literature. We emphasize that this is merely the first step of a collaborative effort to jointly study the observations made by the OSSE and SPI instruments. In some situations, it works out that the improvement from one generation of instrument to the next generation is large enough that the newer instrument completely redefines the level of understanding of a particular emission. This is not the case for positron annihilation radiation. It works out that the best description of the distribution and total flux of positron annihilation radiation will utilize the observations performed by both instruments, with the potential that the joint analysis will lead to better direction as to how to best observe annihilation radiation with SPI.
2 SMM, TGRS and OSSE Observations
The SMM instrument observed positron annihilation radiation during the 1980s. The SMM instrument had relatively poor energy resolution (41 keV @ 511 keV), but a wide FoV (130 deg), which permitted long-term monitoring of the galactic center region during its nine years of operation. Principal among the SMM findings is the lack of significant variation in the 511 keV line flux from the direction of the galactic center, and an estimate of the total flux of 511 keV line emission, between (1.6 - 3.0) x 10-3 phot cm-2s-1, depending upon the spatial distribution of the emission (Share et al. 1988). SMM observations afford very little insight into the distribution of annihilation radiation, but they suggest a total flux level once a distribution is assumed.
The TGRS instrument observed positron annihilation radiation during the early-to-mid 1990s. With a germanium spectrometer, TGRS was capable of studying the 511 keV line centroid, thickness and profile, as well as being able to estimate the positronium continuum flux. Also a wide FoV instrument, TGRS reinforced the lack of variability of the annihilation flux, in this case during the mid-1990s.
The OSSE instrument observed positron annihilation radiation during the 1990s, utilizing a tungsten collimator over CsI(Th) detectors. OSSE had a much narrower FoV than SMM and TGRS (3.8∘ x 11.4∘), and thus had a far superior ability to determine the spatial distribution of annihilation radiation. It also accomplished background supression through alternating between source and background pointings every two minutes. This approach made the observations fundamentally differential rather than absolute, but it lowered the dependence upon understanding the instrumental background to derive accurate results. OSSE had a relatively poor energy resolution, (45 keV @ 511 keV), and thus contributed little to the understanding of the 511 keV line centroid, thickness and profile.222OSSE would have been capable of measuring significantly red-shifted or broadened annihilation radiation, however, analysis of OSSE observations has not revealed evidence of this emission. Both the 511 keV line and the positronium continuum fluxes have been mapped, the first time maps have been created of annihilation radiation.
The OSSE instrument was the best capable of studying the distribution of annihilation radiation, and OSSE continued to observe annihilation radiation after SMM and TGRS had completed the annihilation radiation portions of their missions. However, it has been determined that for a large subset of possible spatial distributions, the data-sets for the OSSE, SMM and TGRS instruments could be acceptably fitted. Mapping and model-fitting results for 511 keV line emission were often presented for all three data-sets simultaneously (the positronium continuum emission maps were generated from OSSE data alone). One principal finding from OSSE studies is that the 511 keV line and positronium continuum emission are similarly distributed, with both emissions featuring an intense bulge component and a fainter disk component.
The SPI instrument features spatial resolution (2.5∘ x 2.5∘) and spectral resolution (2 keV) far superior to that achieved by the OSSE instrument. Employing a coded mask above a Ge spectrometer, SPI accomplishes imaging and suppression of background in a different manner than OSSE. These differences lead to a complementary situation where each instrument’s findings are largely independent of the systematics of the other instrument. I this work, we cite the SPI study of Knödlseder et al. 2005 for the spatial distribution of 511 keV line emission; Lonjou et al. 2004 and Jean et al. 2006 for line diagnostics of the 511 keV line emission; and Weidenspointner et al. 2006 (in preparation) for positronium continuum emission.
3 Comparisons and Discussion
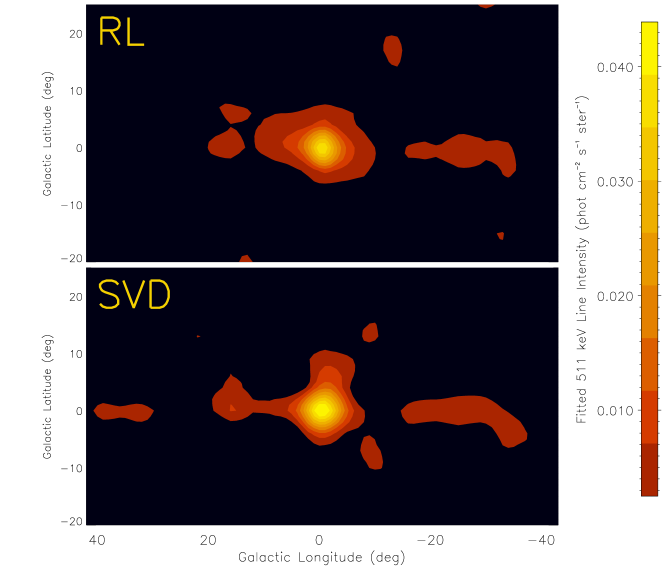
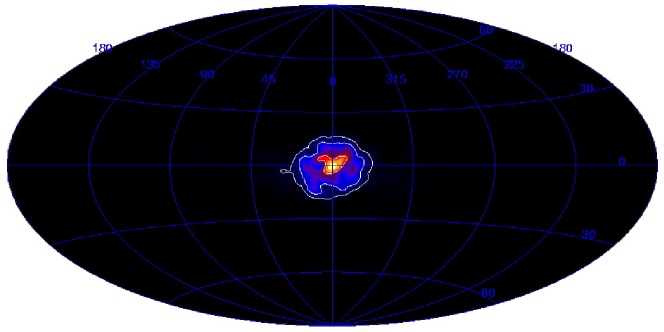
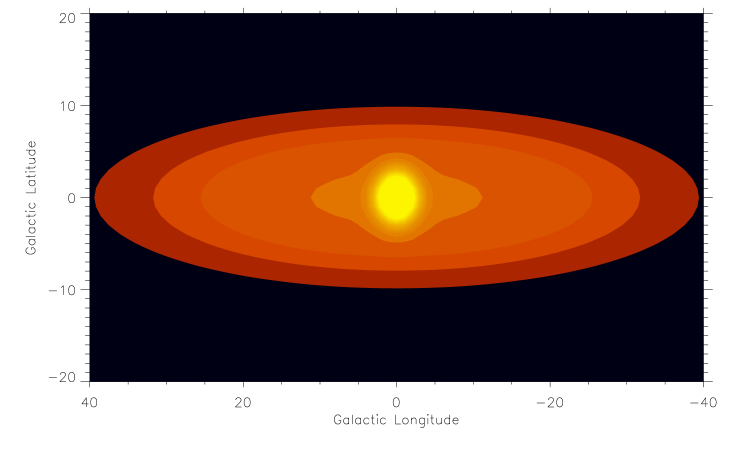
OSSE/SMM/TGRS maps of 511 keV line emission are shown in the upper panel of Figure 1. The intense bulge emission is evident, and a fainter disk emission is also present. The lower panel shows a SPI map of 511 keV line emission. The intense bulge emission is again evident, but the disk emission is absent. The disk is not apparent in SPI maps because it is either too faint and/or too longitudinally thick to be detectable with the current set of SPI observations. The question is then whether the disk emission apparent in OSSE/SMM/TGRS maps is in conflict with the lack of disk emission in SPI maps. This question is best addressed through comparisons of model-fitting to each data-set.
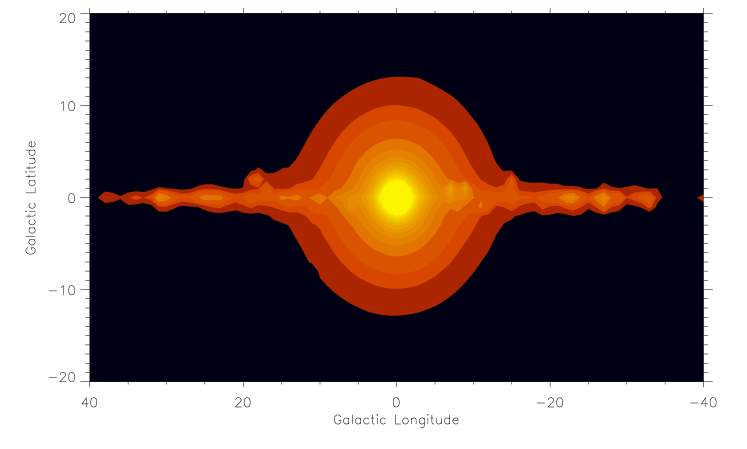
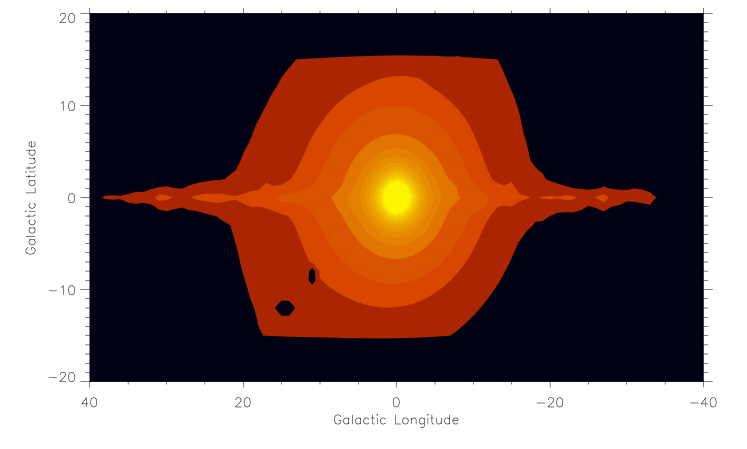
As described during AwR4 (Milne, Kurfess, Kinzer & Leising 2002) the OSSE data (both 511 keV line and positronium continuum) are equally well-fitted by three families of bulge-disk pairs; a bulge-dominated solution, an equal-contribution solution; and a disk-dominated solution. Examples of each of these three pairings are shown in Figure 2. Although these exact model pairings were not compared with the SPI data in the Knödlseder study, rough matches can be found. The “H-Prime” spheroid and the R1/4 spheroid possess similar shapes. The “Shells” spheroid and the 2D-Gaussian spheroid are quite similar. The “D0-young” disk in a thin disk, while the “D1-old” disk is a thicker disk. Shown in Table 1 are bulge, disk and total fluxes of bulge-disk pairs fit to OSSE, OSSE-SMM, OSSE-TGRS data and equivalent pairs fit to SPI data. It is clear from the table that when similar bulge-disk shape are used, OSSE/SMM/TGRS and SPI arrive at similar fluxes. As the INTEGRAL mission continues, the significance of the disk component should increase. In addition, SPI observations should eventually be capable of eliminating two of the “OSSE allowed” bulge-disk families.
| Model | Bulge | Disk | Total |
|---|---|---|---|
| R1/4 - Thin Disk | |||
| OSSE | 1.7 | 0.3 | 2.0 |
| OSSE-SMM | 2.0 | 0.4 | 2.4 |
| OSSE-TGRS | 1.6 | 0.3 | 1.9 |
| OSSE-SMM-TGRS | 2.5 | 0.3 | 2.8 |
| SPI: H’ + D0 | 1.6 | 0.4 | 2.1 |
| R1/4 - Thick Disk | |||
| OSSE | 1.9 | 0.9 | 2.8 |
| OSSE-SMM | 1.8 | 1.0 | 2.8 |
| OSSE-TGRS | 2.0 | 0.6 | 2.6 |
| OSSE-SMM-TGRS | 1.8 | 0.7 | 2.6 |
| SPI: H’ + D1 | 1.5 | 0.9 | 2.4 |
| Gaussian - Thick Disk | |||
| OSSE | 0.5 | 0.5 | 1.0 |
| OSSE-SMM | 0.3 | 2.2 | 2.5 |
| OSSE-TGRS | 0.8 | 0.7 | 1.6 |
| OSSE-SMM-TGRS | 0.3 | 2.2 | 2.5 |
| SPI: Shells + D1 | 1.0 | 1.0 | 2.0 |
OSSE, TGRS and SPI have all reported positronium fractions (i.e. the fraction of positron-electron annihilations that proceed after forming Positronium). Using TGRS data, Harris et al. 1998 reported f(Ps)=0.940.04. Using OSSE data, Kinzer et al. 2001 reported f(Ps)=0.970.04. Using SPI data, Weidenspointner reports f(Ps)=0.930.09, which is in agreement with the other two values (personal communication).
TGRS and SPI have studied the line profile of the 511 keV line. Using TGRS data, Harris et al. 1998 reported the centroid at 510.98 0.10 0.14 keV, a narrow-component line width of 1.81 0.54 0.14 keV, and a broad line component with 11% 9% of the total flux. Using SPI data, Lonjou et al. 2004 report the line to be centered at 511.02 +0.08 -0.09 keV. Also using SPI data, Jean et al. 2006 report a narrow-component line width of 1.3 0.4 keV FWHM, and a broad-line component with 33% 11% of the total flux. While the TGRS and SPI results are not identical, they do show a high level of agreement.
Viewed collectively, the SPI results re-affirm the essential findings from the SMM, TGRS and OSSE observations. As the INTEGRAL mission should be operational for years to come, the potential is great for SPI to further advance the characterization of galactic positron annihilation, and thus positron astrophysics in general. When comparing values, such as bulge, disk and total fluxes, B/D ratios, and line widths, it is important to be certain that the comparison is between similar models or assumptions. Apparent discrepancies might be nothing more than mismatches between the models being compared. A joint effort to properly compare OSSE/SMM/TGRS results with SPI results is underway, and promises to produce the clearest picture yet of the distribution of positron annihilation radiation in the Galaxy.
References
- (1) Harris,M. J. et al. 1998, ApJ, 501, L55.
- (2) Jean, P. et al. 2006, A&A 445, 579.
- (3) Kinzer, R.L. et al. 2001, Ap. J., 559, 282.
- (4) Knödlseder et al. 2005, A&A 441, 513.
- (5) Lonjou, V. et al. 2004, in “The INTEGRAL Universe”, Proc. of the 5th INTEGRAL Workshop held 16-20 February 2004, Munich, Germany, ESA SP-552, 129.
- (6) Milne, P.A., Kurfess, J.D., Kinzer, R.L., Leising, M.D. 2002, NewAR 46, 553.
- (7) Purcell, W. R., et al., 1997, ApJ, 491, 725.
- (8) Share, G.H. et al. 1988, ApJ 326, 717.