LAPTH–1141/06
Is the dark matter interpretation of the EGRET gamma excess
compatible with antiproton measurements?
Lars Bergström, Joakim Edsjö, Michael Gustafsson
Department of Physics, Stockholm University, AlbaNova University Center,
SE-106 91 Stockholm, Sweden
Pierre Salati
Laboratoire d’Annecy-le-Vieux de Physique Théorique LAPTH, CNRS and Université de Savoie,
9, Chemin de Bellevue, B.P.110 74941 Annecy-le-Vieux, France
Abstract
We investigate the internal consistency of the halo dark matter model which has been proposed by de Boer et al. to explain the excess of diffuse galactic gamma rays observed by the EGRET experiment. Any model based on dark matter annihilation into quark jets, such as the supersymmetric model proposed by de Boer et al., inevitably also predicts a primary flux of antiprotons from the same jets. Since propagation of the antiprotons in the unconventional, disk-dominated type of halo model used by de Boer et al. is strongly constrained by the measured ratio of boron to carbon nuclei in cosmic rays, we investigate the viability of the model using the DarkSUSY package to compute the gamma-ray and antiproton fluxes. We are able to show that their model is excluded by a wide margin from the measured flux of antiprotons. We therefore find that a model of the type suggested by Moskalenko et al., where the intensities of protons and electrons in the cosmic rays vary with galactic position, is far more plausible to explain the gamma excess.
1 Introduction
In a series of papers, de Boer et al. [1, 2, 3, 4] have put forward the idea that the well-known EGRET excess of diffuse galactic gamma rays [5] could be well explained by dark matter annihilations. The idea that excess from the region near the galactic center may be due to dark matter annihilations has a long history (at least [6, 7, 8]) but de Boer et al. have extended this idea to claim that all the diffuse galactic gamma rays detected above 1 GeV by the EGRET satellite, irrespective of the direction, has a sizeable dark matter contribution (for a similar, but less explicit, proposal, see [9]). De Boer et al. propose specific supersymmetric models as examples of viable models with correct relic density, and the gamma-ray fluxes are made to fit the observations. The price they have to pay, however, is a rather peculiar dark matter halo of the Milky Way, containing massive, disc concentrated rings of dark matter besides the customary smooth halo. In addition, they have to crank up the predicted gamma-ray flux by considerable “boost factors”. We will here examine these hypotheses a bit closer. In particular, we will discuss the astrophysical properties and possible inconsistencies of the model. We point out that, besides the strange features of the halo model (that we judge difficult to achieve with non-dissipative dark matter), supersymmetric models with large gamma-ray flux are essentially always accompanied by a large antiproton flux (see, e.g., [10, 11]). We investigate what the antiproton fluxes would be in the same halo model, using model-by-model the same boost factors as needed to fit the gamma-ray spectrum. We find that low-mass models (masses less than 100 GeV) that have low boost factors tend to overproduce antiprotons by a factor of around ten. Higher-mass models (above a few hundred GeV) have a lower antiproton rate, so the overproduction is slightly less. However, they give hardly any improvements to the fits to the gamma-ray spectrum. We will perform this analysis in a general Minimal Supersymmetric Standard Model (MSSM), but as the correlation between gamma rays and antiprotons is a general feature, our results will be more general. Our conclusion is that the proposal of de Boer et al. [2] to explain the gamma excess in all sky directions is, at present, not viable111We note that earlier versions of the scenario of de Boer et al., e.g. [4], which had higher mass models favored, did include a discussion of the antiproton fluxes. In the later papers with lower-mass models, they do not discuss the issue. We furthermore conclude that in the earlier papers, where a NFW [12] dark matter profile was used, the EGRET observations in all sky directions were not explained and, consequently, dark matter annihilations could not alone explain all the gamma excess.. Although – of course – we cannot exclude a small contribution to the diffuse gamma-ray flux from dark matter annihilations.
2 Description of the model
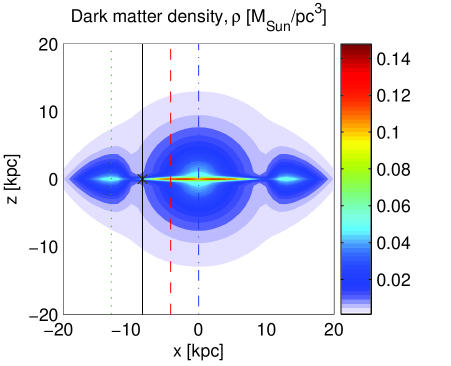

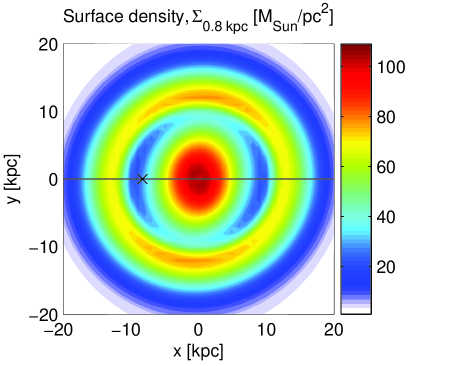
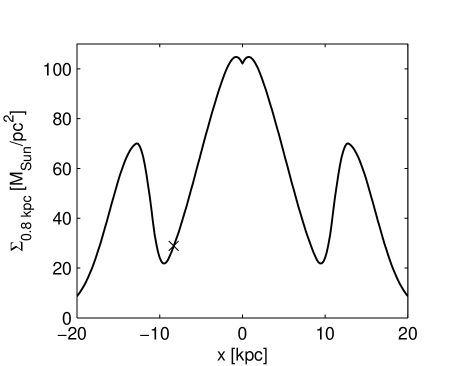
Gamma rays have the advantage of pointing back directly to their sources in the Galaxy and not to suffer from energy losses. This, together with known gamma-ray spectral shape from dark matter annihilation (distinct from the conventional background), permit to extract the sky-projected dark matter distribution from the EGRET observations. Taking this one step further de Boer et al. propose a specific dark matter profile, with 18 free parameters, and do a best fit to the EGRET data (for details, see [2]). The density profile de Boer et al. obtain consists of a dark matter halo with the following ingredients:
-
•
a triaxial smooth halo,
-
•
an inner ring at about 4.15 kpc with a density falling off as , and
-
•
an outer ring at about 12.9 kpc with a density falling off as .
where is the height above the galactic plane.
The triaxial halo is a modified isothermal sphere, but flattened in the direction of the Earth and in the -direction. The inner ring is rather broad, but very closely located to the baryonic disc, with an exponential fall-off above the galactic plane. The outer ring is more massive and slightly narrower and also exhibits an exponential fall-off above the galactic plane. The outer ring is also taken to have a sharper fall-off on the inside than the outside. Both rings are elliptic. The details of the parameterization of the dark matter model can be found in [2]. In Fig. 1, we show the strong concentration of dark matter to the disc (upper panel) as well as the ring structure of the model (lower panel). The steep exponential density fall-off away from the disc, originating from the two rings, can most clearly be seen in the upper-right plot.
Since conventional models of the diffuse gamma-ray emission employ scattering of cosmic rays on gas and dust in the galactic disc, we may already note that this model will produce a gamma-ray flux that has an angular distribution very similar to the generally accepted cosmic ray contribution [13]. In fact, besides the need for measurements with a better energy resolution such as will be given by GLAST, the desired spectral shape can also be obtained by adjusting the balance between the contributions from proton and electron cosmic rays (whose intensity is very poorly constrained away from the solar neighborhood) [13]. In [13] it was shown that one can get a good agreement with EGRET data by adjusting the electron and proton injection spectra (without any need for a dark matter contribution).
3 Astrophysical problems with the model
Even though the dark matter halo profile by de Boer et al. explains the EGRET data very well, we will here go through some of the astrophysical objections to this model. First, one may notice that the model of the dark matter really is very close to the “standard” model for the baryons of the Milky Way, containing a thin and a thick disc and a central bulge (see, e.g., [14]). Since the dark halo is much more massive than the baryonic one, one of the first things one should investigate is whether there is room to place as much unseen matter in the vicinity of the disc as de Boer et al. do.
3.1 Disc surface mass density
By observations of the dynamics and density fall-off of stars in the disc, one can get a measure of the gravitational pull perpendicular to the galactic plane. This in turn can be converted to an allowed disc surface mass density, a method pioneered by Bahcall [15]. Recent analyses [16, 17, 18] of the disc surface mass density at the solar system location have converged to a model with little room for a concentration of dark matter in the disc. Observations are well described by a smooth dark matter halo and a disc of identified matter (mainly containing stars, white and brown dwarfs and interstellar matter in form of cold and hot gases).
| surface density: | dynamical | identified | unidentified | dark matter in [2] | ||
|---|---|---|---|---|---|---|
| 9 – | 11 | 9 | 0 – | 2 | 4.5 | |
| 36 – | 48 | 34 | 2 – | 14 | 19 | |
| 59 – | 71 | 46 | 13 – | 25 | 29 | |
| 58 – | 80 | 49 | 9 – | 32 | 35 | |
Table 1 shows the observed local surface mass density in both identified components and the total dynamical mass within several heights. Their differences then give an estimate of the allowed amount of dark matter in the local disc222Even though the estimates are done under the assumption of a smooth dark matter halo these constraint still holds even for a wide range of varying dark matter profiles, including the profile concerned here (private communication, C. Flynn and J. Holmberg) – and the result is an exclusion of such strong concentration of unidentified/dark matter as derived in [2]. All these estimates also agree well with the observed local density of /pc3 in dynamical mass and /pc3 in visible matter [19, 17]. This gives room for only about /pc3 in unidentified matter, which should be compared to the dark matter density of 0.05 /pc3 in the model of de Boer et al. [2].
From these numbers alone, the de Boer model gives a too high mass density. One should keep in mind, however, that the estimates of the possible amount of dark matter are somewhat uncertain and that the disc models also have uncertainties of the order of 10% in their star plus dwarf components and uncertainties as large as about 30% in their gas components. Also the de Boer et al. model could easily be modified to give a lower disc surface mass density at the solar system’s location in the Galaxy. However, such a modification just to circumvent this problem seems fine-tuned. One should keep in mind that the model, as it now stands, already have made these modifications, e.g. the outer ring is Gaussian in shape in the radial direction, except that it is forced to zero relatively fast on the inside. This ad hoc cut-off lets the outer ring be very massive, while keeping the local density unaffected. In Fig. 1, the disc surface mass density for the halo model of de Boer et al. is shown. We clearly see that in this model, the Earth is located in a region with relatively low disc mass surface density. Modifying the model to reduce this further would make the model even more fine-tuned. It is also not unlikely that, e.g. recent SDSS data [14] could put constraints on the halo model further away from the solar system, but such an analysis has, to our knowledge, not been performed yet.
To summarize, the de Boer model seems to be in slight conflict with the estimates of the disc surface mass density. It is certainly possible to modify their dark matter model to avoid exceeding the allowed local disc surface mass density, but the model would become even more fine-tuned with such a modification. In fact, the proposal by de Boer et al. to explain the gamma excess by introducing dark matter and avoid any fine-tuning of the electron and proton injection spectra as in [13], actually ends up being considerably fine-tuned itself.
3.2 Ring profiles
The rings have an exponential fall-off above the galactic plane as given in Sec. 2. Actually, the outer ring is claimed [2] to be consistent with an observed overdensity of stars, the Monoceros stream [20, 21]. However, a recent analysis of Sloan Digital Sky Survey (SDSS) data [14] indicates that this is not really a ring but rather a localized structure like that expected from a merging dwarf galaxy with tidal arms, as already conjectured in [21]. In the original EGRET paper, this structure is clearly visible, but not as a ring (as it is not visible in quadrant IV in the notation of [5], Fig. 9).
In most models of cold dark matter, one would expect the dark matter distribution to be much more isotropic than that of the baryonic disc material, which supposedly forms dissipatively with energy loss but very little angular momentum loss [22]. In fact, we know of no reasonable example, from numerical simulations, that would indicate that the model shown in Fig. 1 resembles a dark matter halo.
4 Comparison with antiproton data
4.1 Calculating the antiproton fluxes
We will here investigate what antiproton fluxes, from annihilation in the dark matter halo, that the de Boer et al. model would predict. To do this, we follow the approach by de Boer et al. [2] as closely as possible and proceed as follows:
-
1.
We fit the expected background and signal to EGRET’s observed diffuse gamma flux towards the galactic center, with the normalization of the background333We note that in the analysis of de Boer et al. they also subtract data in regions near the center and the disc (see Fig.3 in [2]) and then put it back as signal with similar angular distribution. The only difference is the spectral shape, which is claimed to fit better a contribution from dark matter annihilation. and signal as free parameters. We here use region A in [2]; which is towards the galactic center ( in longitude and in latitude from the galactic center).
-
2.
From the best-fit signal normalization, we derive the required boost factor for the gamma flux from dark matter annihilation .
-
3.
Following de Boer et al. we assume that this boost factor is independent of location in the Galaxy (see comment in Sec. 4.4 below though).
-
4.
As the boost factor is assumed to be independent of location in the Galaxy, the same boost factor would apply also for the antiproton fluxes. We thus calculate the expected antiproton flux for the de Boer et al. halo profile and then boost it by the same boost factor as found from the EGRET fit.
For the background gamma flux, we have used both the standard background (as given in Fig. 2 of [2]) and the optimized background (as given in Fig. 6 of [2]). The difference between these are that the optimized background have a modified proton and electron injection spectrum, trying to give a good description of the EGRET data without dark matter. Both these models are based upon models by Strong, Moskalenko and Reimer [13].
The differential gamma-ray flux in a given direction is given by
| (1) |
with
| (2) |
Averaged over region A towards the galactic center, we find that .
For the signal, we use DarkSUSY [23] to calculate the dark matter annihilation cross sections and gamma-ray yields. We then use the Eqs. above to calculate the flux in region A. Following de Boer et al., we calculate the flux in 8 EGRET bins from 0.07 GeV to 10 GeV. We have done this for a set of rather general MSSM models, where we have varied the standard MSSM parameters (, , , , , and ) between very generous bounds (up to several TeV for the mass parameters). We have only kept models that do not violate any accelerator constraints and that has a relic density in the WMAP preferred range . We have about 100 000 models satisfying these constraints (but make the plots with binned results as the density of points has no physical meaning).
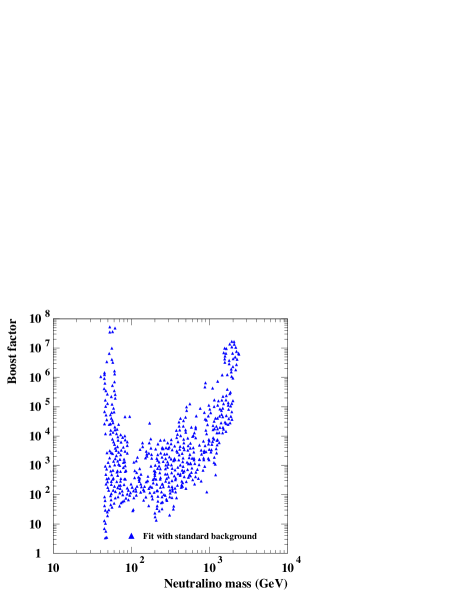
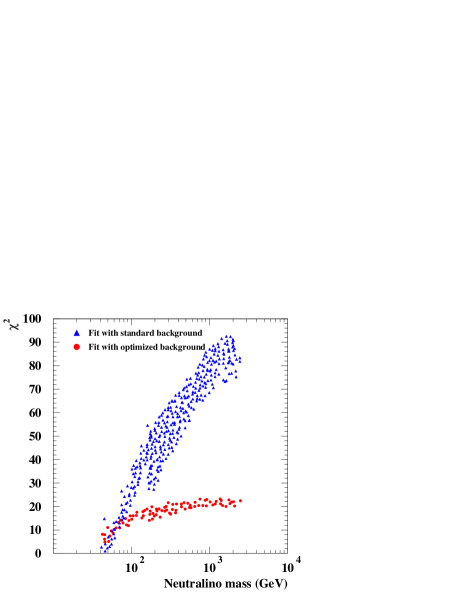
In Fig. 2a we show the boost factors of the signal that gives the best fits. We see that we roughly agree with the results in [1] that the required boost factors are of order 10 or more. We have also calculated the boost factors needed when we use the so called optimized background in our fits. We here also get roughly the same result as in [2], i.e. the required boost factors are about a factor of 3–4 lower.
In Fig. 2b, we show the of the fits (divide by 8-2=6 to get the reduced ). As already shown by de Boer, it is possible to get very good fits for masses below about 100 GeV. We also note that the fits with the optimized background are never as good as with the standard background. On the other hand, the fits are not as bad for higher masses though, as there is less need for a signal in this model. One should note that we use relative errors of only 7% for the gamma fluxes, although the overall uncertainty is often quoted to be 10-15% [24, 13]. The reason for using smaller errors is to take into account the fact that the relative point-to-point errors are expected to be less than the overall normalization error; dominated by systematics. The overall normalization uncertainty is irrelevant here, since in the fitting the normalization is a free parameter anyway. We follow de Boer et al. and use their estimate of 7% for the relative errors in our -fits. We note that our results are not sensitive to this choice though (apart from the actual values of course).
4.2 Comparing with BESS data
We are then ready to compare with antiproton measurements. We use DarkSUSY [23] to calculate the antiproton fluxes for each of these MSSM models and with the halo profile of de Boer et al. As our calculation assumes an axisymmetric halo profile, we symmetrized the de Boer et al profile in such a way that we for any given radius , take an average of the source function () over the azimuthal angles. We do not expect this to introduce any large errors as the antiproton diffusion effectively smears out local variations in the density. In fact, from the variations of the density over the azimuthal angles, we don’t expect this symmetrization to introduce larger errors than at most a factor of 1.5.
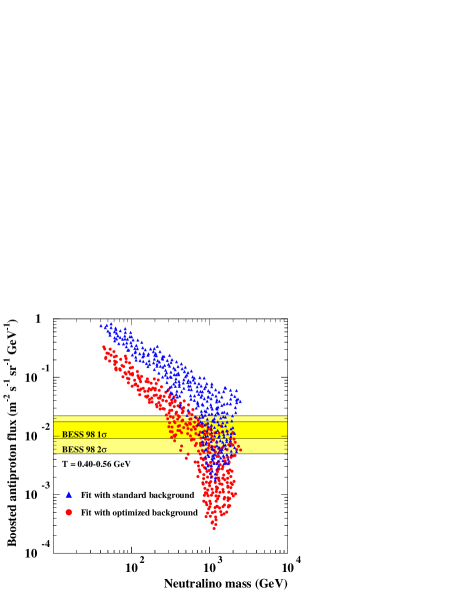
We have chosen to primarily compare with BESS (Balloon-borne Experiment with a Superconducting Spectrometer) data from 1998 [25], where we have chosen the bin at 0.40–0.56 GeV. The reason we choose the BESS 98 data is that for these data the solar modulation parameter is relatively low ( MV) and the reason we choose a low-energy bin is that here the signal is expected to be relatively high compared to the background.
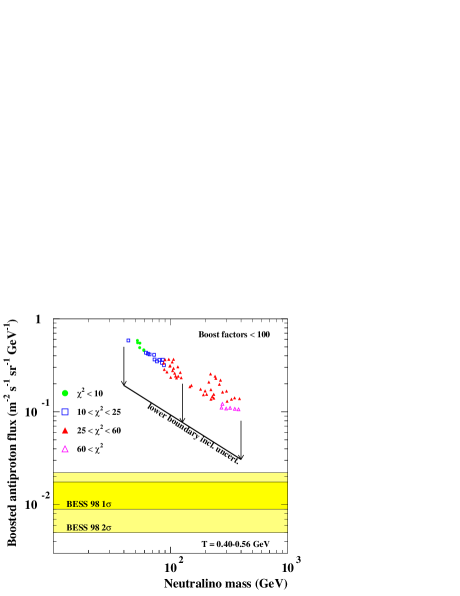
Applying the same boost factors for the antiproton fluxes as obtained from the fit to EGRET data we show in Fig. 3a the expected antiproton flux from both the fit with the standard background and the fit with the optimized background. The models with low masses, that have low clearly overproduces antiprotons by a large amount. In Fig. 3b we show (for the standard background) the antiproton flux, but coded with . We have here also chosen to impose a cut on the boost factor, to only allow models with reasonably low boost factors. To be conservative, we have allowed the boost factor to be as high as 100, which is higher than expected from recent analyses (see e.g. [26, 27]). It is fairly evident that all the models with good fits to the EGRET data give far too high antiproton fluxes.
We have also compared with a set of mSUGRA rates (the same ones used in [28]). The mSUGRA models show the same general pattern as the MSSM models (i.e. similar boost factors needed, similar best-fit etc.) so we do not show these figures here. The model proposed by de Boer et al. in [1] also has the same phenomenological properties as our MSSM models. Hence, our MSSM models should be representative as a fair sample of what you could expect for supersymmetric neutralino dark matter. In fact, since antiprotons and gamma rays are so strongly correlated in general, our results should be valid for more general WIMPs as well.
Other dark matter candidates, like Kaluza Klein (KK) dark matter, would also give a similar behavior since the gamma rays and antiprotons are so correlated. However, for e.g. KK dark matter from Universal Extra Dimensions [29] we would not improve the fits to EGRET data as only heavier models are favored by the relic density constraint.
4.3 Antiproton propagation uncertainties
Of course, it is a well-known fact that the antiproton flux from dark matter annihilations is beset with large uncertainties relating to unknown diffusion parameters combined with uncertainties in the halo distribution. As an example, in [30] it is pointed out that the estimated flux may vary by almost a factor 10 up or down, for models that predict the measured B/C ratio (i.e., the relation between secondary and primary cosmic rays) within the uncertainties.
Hence, it might seem that the models producing too many antiprotons in Fig. 3 are not really excluded if the uncertainties of the antiproton propagation are included. However, the results of a factor of around 50 uncertainty in [30] are only valid for a relatively smooth halo profile, so we need to investigate this in some more detail for the de Boer et al. profile. To do that, we will recalculate the antiproton fluxes with the propagation code in [30] and with propagation parameters chosen to be as extreme as we can allow from other cosmic ray data (mainly B/C).
The main reason for the large uncertainties found in [30] is a degeneracy (for the secondary signal) between the height of the diffusion box and the diffusion parameter. If we increase the height of the diffusion box, we would get a larger secondary signal because cosmic rays can propagate longer in the diffusion box before escaping. This can be counterbalanced by increasing the diffusion coefficient to make the cosmic rays diffuse away faster from the galactic disc. Hence, for the secondary signal, which originates in the galactic disc, we can get acceptable fits by changing these parameter. For the dark matter signal though, the effect of these changes is different. If we increase the height of the diffusion box, we also increase the volume in which annihilations occur, and the total flux increases more than is counterbalanced by an increase in the diffusion coefficient. In [30] they then found that for a NFW (or isothermal) profile, the different acceptable configurations of diffusion height and diffusion coefficient would cause an increase/decrease of up to a factor of 10 compared to the median value.
| case | |||||
|---|---|---|---|---|---|
| [] | [kpc] | [km/sec] | [km/sec] | ||
| max | 0.46 | 0.0765 | 15 | 5 | 117.6 |
| med | 0.70 | 0.0112 | 4 | 12 | 52.9 |
| min | 0.85 | 0.0016 | 1 | 13.5 | 22.4 |
Let us now focus on the de Boer et al. profile. The most important parts for the antiproton signal are the rings that decay exponentially with the height above the galactic plane. Hence, this source distribution is much more concentrated to the galactic disc than a smooth halo profile is. We therefore expect a more modest change of the fluxes with the extreme values of the diffusion parameters than found in [30]. As a complement to our calculations with DarkSUSY, we have derived the antiproton fluxes in the de Boer model for the extreme diffusion parameters given in [30] and which we recall in Table 2. This calculation has been done with the propagation code in [30].
For illustration, we show in Fig. 4 the full yield of primary antiprotons for a selected supersymmetric configuration for which the agreement with the EGRET data is very good – of order 3 (neutralino mass of 50.1 GeV and derived boost factor of 69). For the sake of completeness, we have taken into account tertiary antiprotons as in [31] and computed the effect of diffusive reacceleration with the help of the same Crank-Nicholson scheme as in [32]. Solar modulation has been modeled with the simple force–field approximation where a Fisk parameter of MV has been assumed. The red solid curve in Fig. 4 corresponds to the median cosmic ray configuration of table 2. The yellow band is delimited by the extreme configurations and gives an indication on how well the flux of neutralino induced antiprotons can be derived in the case of the de Boer et al. dark matter distribution. For the maximal cosmic ray model, we observe an increase in the antiproton flux by a factor of 2.5 whereas for the minimal configuration, we find a decrease of a factor of 2.6 – both at energies lying between 0.4 and 0.6 GeV. The total width corresponds therefore to an overall factor of to be compared to a factor of in the case of an NFW dark matter halo. As expected, the uncertainties are much smaller in the de Boer et al model compared to more conventional halo profile. Again, the main reason for this is that the dark matter in the de Boer model is located much closer to the galactic plane and its distribution is reminiscent of the gaseous disc of the Milky Way that is responsible for the conventional secondary background. The latter is featured in Fig. 4 as the narrow green band that has been derived in [32] from the observed B/C ratio. From this calculation we also get an estimate of the possible uncertainties arising from different propagation codes. In Fig. 4, the long–dashed black curve has been computed with the DarkSUSY package using a typical cosmic ray propagation (as described in [28]). Because diffusive reacceleration has not been implemented in that case, the flux falls more steeply close the neutralino mass. Notice however that it is fairly similar to the red solid line, calculate with the propagation code in [30]. We can therefore conclude that diffusive reacceleration does not substantially modify the shape of the antiproton spectrum – especially in the energy range of interest. We also note that the two different propagation codes, DarkSUSY and the code of [30], gives very good agreement and should not constitute any additional theoretical error.
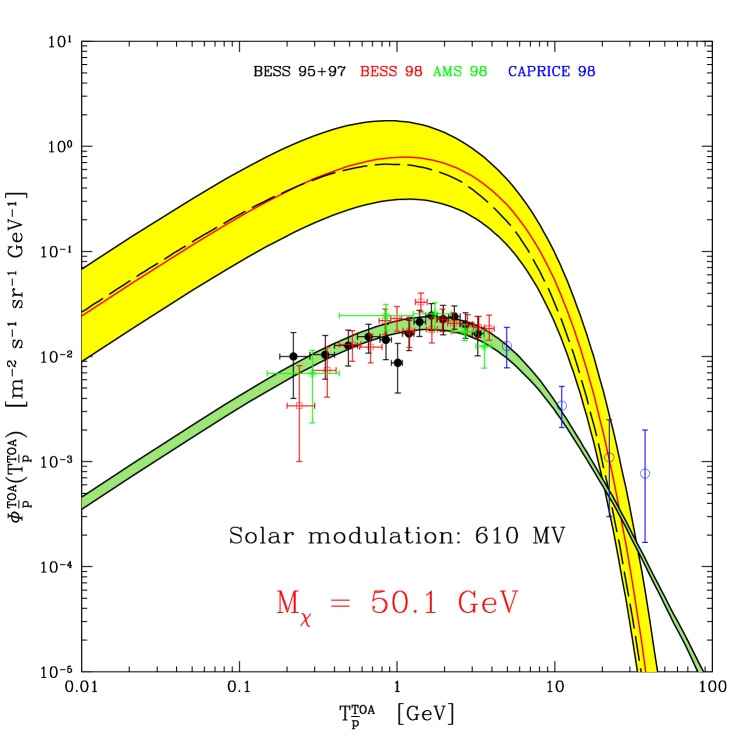
Notice finally that the primary yellow uncertainty band is at least an order of magnitude above the secondary green component. The latter alone can already account for the antiproton observations as is clear in Fig. 4. We conclude that the supersymmetric model that has been selected here because it provides a good fit to the EGRET excess should be excluded as it by far overproduces antiprotons. In Fig. 4 we also compare with the BESS data at other energies than our previously selected energy bin. It should be evident from the figure that the model overproduces antiprotons at essentially every measured energy.
We have here compared with one example model, but this argument can be made more general. In Fig. 3b we show with a solid line how far down we could shift the models down by going to the extreme minimal model. As can be seen, the antiprotons are still overproduced by a factor of 2–10 for the models with good fits to EGRET data. It is therefore difficult to see how the dark matter interpretation of the EGRET data could be compatible with the antiproton measurements.
4.4 Other antiproton uncertainties
Above we mentioned the antiproton uncertainties coming from our lack of knowledge of the propagation model. We also have uncertainties arising from the assumptions in the approach of de Boer et al. E.g., the boost factor is assumed to be independent of position in the Galaxy. This is probably not a very well-justified assumption as we would expect the boost factor to depend on the formation history of that particular region in the Galaxy. If the boost factors do depend on the position in the Galaxy, then the boost factors for the flux at reception at Earth can be different for gamma rays and antiprotons since the signal in general come from different parts of the Galaxy (the gamma signal can e.g. be dominated by annihilation at the galactic center, whereas the antiprotons could come from a more nearby structure). We will here investigate what the uncertainties on the boost of the antiproton flux as seen at the Earth could be if we relax the assumption of space-independent boost factors.
In particular, galactic tidal interactions should destroy clumps[33] in the inner (older) parts of the Milky Way and especially in the inner ring, which is the most prominent feature in the de Boer model when it comes to the fits to the gamma-ray fluxes. On the other hand, the antiprotons that are detected at the Earth originate from a broad region of the Milky Way halo. A significant portion is produced in the inner ring, but a substantial part comes also from the outskirts where clumps have survived. The correct effective boost factor which should have been implemented in the antiproton calculations should therefore probably be larger than the value derived from assuming a spatially constant boost factor.
We can quantify these uncertainties though. If we take away the inner ring, the antiproton fluxes goes down a factor of 2.0. If we take away the outer ring, the antiproton fluxes go down by a factor of 1.4. And, finally, if we would take away the smooth triaxial halo, the antiproton fluxes would go down by a factor of 2.2. Hence, we can conclude that the antiproton fluxes at the Earth are dominated by annihilation in the inner ring and the smooth triaxial halo. Since the antiprotons coming from the inner ring originate in the same place as the gamma rays that dominate the flux in region A, the boost factor derived from the gamma flux should be very close to the effective boost factor for these antiprotons. As noted above, this makes up half of the antiproton flux at Earth. For the other half, coming mostly from the triaxial smooth halo, our use of the same effective boost factor as derived from gamma rays from region A is most likely not correct. However, as noted above, we would expect the boost factor to be larger in these less dense regions, so our (and de Boer’s) assumption of space independent boost factors would lead to an underestimate of the antiproton flux.
Another argument – slightly more technical – points in the same direction. The local boost factor of a clump of mass is defined [34] with respect to some value of reference through the relation
| (3) |
where is the dark matter density inside the substructure. If large boost factors are needed to explain the EGRET data, this means that the dark matter is tightly packed even inside the inner ring. That region is already fairly dense with a density of reference GeV cm-3. On the contrary, antiprotons originate from a larger domain where the neutralino density is certainly smaller on average than inside the inner ring. If the clumps have basically the same mass and density profile all over the Milky Way halo – which is probably correct in the case where very small substructures dominate, as they should have survived the galactic tides – the product remains constant. We are forced to the conclusion that the actual effective boost value which should be used for antiprotons is once again larger than in the case of the EGRET data. Therefore assuming identical effective boost factors (as seen at Earth) for the photon and antiproton flux is very conservative. The lower antiproton limit featured in Fig. 3b should actually be shifted upwards, even further above the BESS 98 stripes.
5 Comparison with direct detection
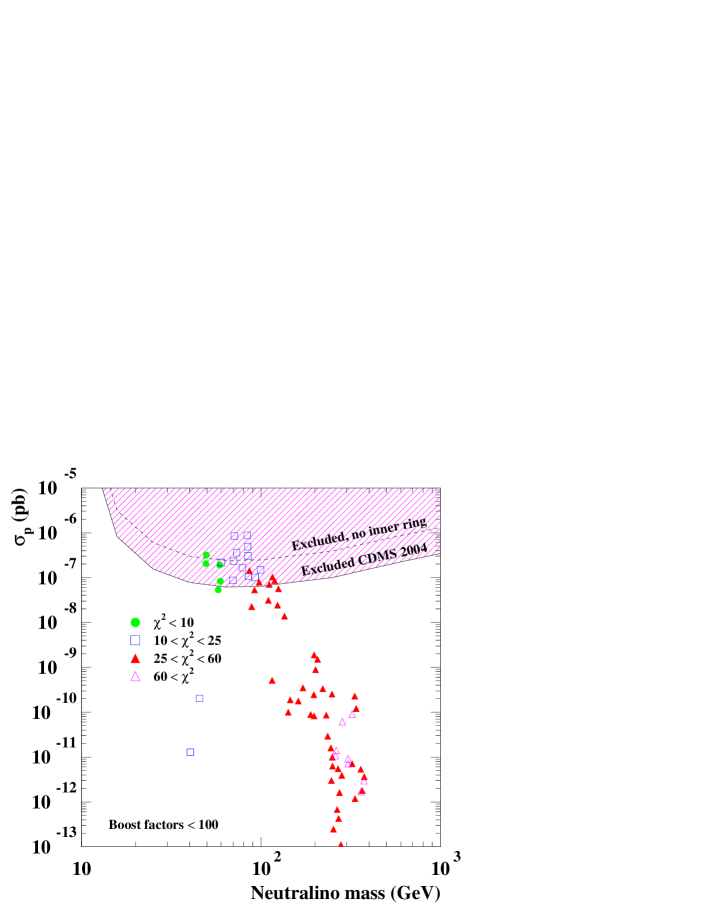
With the enhanced dark matter densities in the de Boer et al. model one may wonder if these models wouldn’t have been seen already in direct detection experiments. To make a simple estimate of this, we plot the scattering cross section on protons versus mass in Fig. 5. We compare with the latest CDMS results [35], but since those results apply for a local dark matter density of GeV/cm3, we have rescaled the limits with the local density in the de Boer et al. model. To be more specific, we have lowered the limits by , which is the ratio of the local dark matter density in the de Boer et al. model and a ‘standard’ halo model. As can be seen, most models would seem to be excluded by the latest CDMS results [35]. However, in deriving these limits, a standard gaussian velocity distribution has been assumed. This is most probably a reasonable approximation for the triaxial halo in the de Boer et al. model, but most of the local density comes from the inner ring, where not much is known about the velocity. If the inner ring would rotate along with the Galaxy, we expect lower rates than indicated in the figure since the relative velocity between the dark matter and us would be lower. However, if it counter-rotates, we would expect even higher rates. If we would be conservative and assume that the inner ring would produce no significant rates in direct detection experiments, the limits from CDMS would be reduced by a factor of (as the local density from the smooth halo is 0.5 GeV/cm3 in the de Boer et al. model). In Fig. 5 we indicate this exclusion limit with a dashed line. As can be seen, some of the models of them would then fall below the exclusion limit, but some would still be above.
Hence, one can conclude that the de Boer et al. models produce significant rates in direct detection experiments, and some of the good models are already excluded even if uncertainties of the velocity distributions are taken into account. However, we cannot exclude all of the good models, due to these uncertainties, but many of the models giving the best fits are well within reach with future improved direct detection experiments.
6 Discussion
We have here investigated the idea put forward by de Boer et al. that the observed EGRET excess of diffuse gamma rays could be due to dark matter annihilation in the Milky Way. This is an interesting idea, but as far as we can see the model does not seem very plausible when other constraints are taken into account. The strongest constraint is probably the antiproton flux, which would be overproduced far above the flux measured by BESS. Even if the uncertainties of the antiproton flux are included, the antiproton flux is still more than a factor of 2–10 above the BESS measurements. From the analysis in this paper one also find (see, Fig. 3b) that models that would be compatible with the antiproton data would always have very bad fits to the EGRET data (reduced 60/6). Actually, the optimized background model in [13] would produce a much better fit (reduced 22/6 ; which can also be read of at the high-mass end in Fig. 2b, where the signal does not contribute much to the fits). Hence, the models with acceptable antiproton fluxes are not very interesting as they give worse fits to the gamma excess than the more conventional models.
Other objections to the model come from astrophysics. E.g., the density in the disc in the de Boer model is a little bit too high to be compatible with stellar motions in the solar neighborhood. This could of course be circumvented by adjusting the densities in the de Boer et al. model to have a dip at our location in the solar system. Such fine tunings are not very appealing though, especially as the model already as it stands has a local minimum at the solar neighborhood. One has to be careful interpreting these results on the disc surface density though as there are large uncertainties and model dependencies. To be conservative, we interpret these too high disc surface mass densities as a hint of problems with the model. The actual density profiles of the rings (exponential fall-off away from the disc) is also not what you expect from dark matter. In fact, we believe that the de Boer et al. model is most likely a fit of the baryonic matter distribution of the Galaxy, and not the dark matter density. One could also wonder if the background models could be improved further and provide a even better fit to the EGRET data. In fact, the optimized background model in [13] already gives a good fit to the EGRET data – especially when conventional/larger uncertainties of 15% for EGRET’s observed gamma fluxes are adopted (reduced 5/6). This optimized model was accomplished by tuning the electron and proton injection spectrum without violating any of the cosmic ray constraints, such as B/C. Hence, there is no real need for dark matter to explain the EGRET data. New experiments are on their way though with GLAST flying in 2007 and with new and better data, we will hopefully get a better understanding of the gamma-ray sky and if there are any (clear) signals of dark matter out there.
M.G. would like to thank C. Flynn and J. Holmberg for useful discussions regarding the local galactic surface density. L.B. and J.E want to thank I. Moskalenko and W. de Boer for useful discussions and are grateful to the Swedish Science Research Council (VR) for support. J.E. also thanks A. Strong and O. Reimer for discussions. P.S. acknowledges a support from the French programme national de cosmologie PNC.
References
- [1] W. de Boer, C. Sander, V. Zhukov, A. V. Gladyshev and D. I. Kazakov, The supersymmetric interpretation of the EGRET excess of diffuse galactic gamma rays, Phys. Lett. B 636, 13 (2006) [arXiv:hep-ph/0511154].
- [2] W. de Boer, C. Sander, A. V. Gladyshev and D. I. Kazakov, EGRET excess of diffuse galactic gamma rays as tracer of dark matter, Astron. & Astrophysics 444, 51 (2005) [arXiv:astro-ph/0508617].
- [3] W. de Boer, Evidence for dark matter annihilation from galactic gamma rays?, New Astron. Rev. 49, 213 (2005) [arXiv:hep-ph/0408166].
- [4] W. de Boer, M. Herold, C. Sander and V. Zhukov, Indirect evidence for neutralinos as dark matter, Eur. Phys. J. C 33, S981 (2004) [arXiv:hep-ph/0312037].
- [5] S. D. Hunter et al., EGRET Observations of the Diffuse Gamma-Ray Emission from the Galactic Plane, Astrophys. J. 481, 205 (1997)
- [6] L. Bergström, P. Ullio and J. H. Buckley, Observability of gamma rays from dark matter neutralino annihilations in the Milky Way halo, Astropart. Phys. 9, 137 (1998) [arXiv:astro-ph/9712318].
- [7] P. Gondolo, WIMP annihilations and the galactic gamma-ray halo, Prepared for 2nd International Conference on Dark Matter in Astro and Particle Physics (DARK98), Heidelberg, Germany, 20-25 Jul 1998
- [8] A. Cesarini, F. Fucito, A. Lionetto, A. Morselli and P. Ullio, The galactic center as a dark matter gamma-ray source, Astropart. Phys. 21, 267 (2004) [arXiv:astro-ph/0305075].
- [9] D. D. Dixon et al., Evidence for a Galactic gamma ray halo, New Astron. 3, 539 (1998) [arXiv:astro-ph/9803237].
- [10] S. Rudaz and F. W. Stecker, Cosmic Ray Anti-Protons, Positrons And Gamma-Rays From Halo Dark Matter Annihilation, Astrophys. J. 325, 16 (1988).
- [11] L. Bergström, J. Edsjö and P. Ullio, Possible Indications of a Clumpy Dark Matter Halo, Phys. Rev. D 58, 083507 (1998) [arXiv:astro-ph/9804050].
- [12] J. F. Navarro, C. S. Frenk and S. D. M. White, A Universal Density Profile from Hierarchical Clustering, Astrophys. J. 490, 493 (1997) [arXiv:astro-ph/9611107].
- [13] A. W. Strong, I. V. Moskalenko and O. Reimer, Diffuse Galactic continuum gamma rays. A model compatible with EGRET data and cosmic-ray measurements, Astrophys. J. 613, 962 (2004) [arXiv:astro-ph/0406254].
- [14] M. Juric et al., (The SDSS Collaboration) The Milky Way Tomography with SDSS, arXiv:astro-ph/0510520.
- [15] J.N. Bahcall, Astrophys. J. 276, 156 (1984).
- [16] V. I. Korchagin, T. M. Girard, T. V. Borkova, D. I. Dinescu and W. F. van Altena, Local Surface Density of the Galactic Disk from a 3-D Stellar Velocity Sample, Astronomical Journal, 126, 2896 (2003) [arXiv:astro-ph/0308276].
- [17] J. Holmberg and C. Flynn, The local surface density of disc matter mapped by Hipparcos, Mon. Not. Roy. Astron. Soc. 352, 440 (2004) [arXiv:astro-ph/0405155].
- [18] O. Bienayme, C. Soubiran, T. V. Mishenina, V. V. Kovtyukh and A. Siebert, Vertical distribution of Galactic disc stars: III. The Galactic disc surface mass density from red clump giants, arXiv:astro-ph/0510431.
- [19] J. Holmberg and C. Flynn, The local density of matter mapped by Hipparcos, Mon. Not. Roy. Astron. Soc. 313, 209 (2000) [arXiv:astro-ph/9812404].
- [20] H. J. Newberg et al., The Ghost of Sagittarius and Lumps in the Halo of the Milky Way, Astrophys. J. 569, 245 (2002) [arXiv:astro-ph/0111095].
- [21] H. J. Rocha-Pinto, S. R. Majewski, M. F. Skrutskie and J. D. Crane, The Galactic Anticenter Stellar Stream, Astrophys. J. 594, L115 (2003) [arXiv:astro-ph/0307258].
- [22] S. M. Fall and G. Efstathiou, Formation And Rotation Of Disc Galaxies With Haloes, Mon. Not. Roy. Astron. Soc. 193, 189 (1980).
- [23] P. Gondolo, J. Edsjö, P. Ullio, L. Bergström, M. Schelke and E. A. Baltz, DarkSUSY: Computing supersymmetric dark matter properties numerically, JCAP 0407, 008 (2004) [arXiv:astro-ph/0406204].
- [24] J. A. Esposito et al., In-Flight Calibration of EGRET on the Compton Gamma-Ray Observatory, Astrophys. J. 123, 203 (1999).
- [25] T. Maeno et al. [BESS Collaboration], Successive measurements of cosmic-ray antiproton spectrum in a positive phase of the solar cycle, Astropart. Phys. 16, 121 (2001) [arXiv:astro-ph/0010381].
- [26] V. Berezinsky, V. Dokuchaev and Y. Eroshenko, Destruction of small-scale dark matter clumps in the hierarchical structures and galaxies, Phys. Rev. D 73, 063504 (2006) [arXiv:astro-ph/0511494].
- [27] L. Pieri, E. Branchini and S. Hofmann, Dim Light From Clumpy Halos, Phys. Rev. Lett. 95, 211301 (2005) [arXiv:astro-ph/0505356].
- [28] J. Edsjö, M. Schelke and P. Ullio, Direct versus indirect detection in mSUGRA with self-consistent halo models, JCAP 0409, 004 (2004) [arXiv:astro-ph/0405414].
- [29] T. Appelquist, H. C. Cheng and B. A. Dobrescu, Bounds on universal extra dimensions, Phys. Rev. D 64, 035002 (2001) [arXiv:hep-ph/0012100].
- [30] F. Donato, N. Fornengo, D. Maurin, P. Salati and R. Taillet, Antiprotons in cosmic rays from neutralino annihilation, Phys. Rev. D 69, 063501 (2004) [arXiv:astro-ph/0306207].
- [31] L. Bergström, J. Edsjö and P. Ullio, Cosmic antiprotons as a probe for supersymmetric dark matter ?, Astrophys. J. 526, 215 (1999) [arXiv:astro-ph/9902012].
- [32] F. Donato, D. Maurin, P. Salati, A. Barrau, G. Boudoul and R. Taillet, Antiprotons from spallations of cosmic rays on interstellar matter, Astrophys. J. 563, 172 (2001) [arXiv:astro-ph/0103150].
- [33] V. Berezinsky, V. Dokuchaev and Y. Eroshenko, Phys. Rev. D 68, 103003 (2003) [arXiv:astro-ph/0301551].
- [34] J. Lavalle, J. Pochon, P. Salati and R. Taillet, Clumpiness of dark matter and positron annihilation signal: Computing the odds of the galactic lottery, arXiv:astro-ph/0603796.
- [35] D. S. Akerib et al. [CDMS Collaboration], First results from the cryogenic dark matter search in the Soudan Underground Lab, Phys. Rev. Lett. 93, 211301 (2004) [arXiv:astro-ph/0405033].