Magnetic Fields in the Center of the Perseus Cluster
Abstract
We present Very Long Baseline Array (VLBA) observations of the nucleus of NGC 1275, the central, dominant galaxy in the Perseus cluster of galaxies. These are the first observations to resolve the linearly polarized emission from 3C 84, and from them we determine a Faraday rotation measure (RM) ranging from 6500 to 7500 rad m-2 across the tip of the bright southern jet component. At 22 GHz some polarization is also detected from the central parsec of 3C 84, indicating the presence of even more extreme RMs that depolarize the core at lower frequencies. The nature of the Faraday screen is most consistent with being produced by magnetic fields associated with the optical filaments of ionized gas in the Perseus Cluster.
1 Introduction
The Perseus Cluster, A426, is the most X-ray luminous cluster in the nearby universe, and the prototypical “cooling core” cluster. In these cooling core clusters the radiative cooling time of the X-ray emitting gas is considerably shorter than the age of the universe, so to maintain equilibrium the gas must flow into the center of the cluster, or another source of energy is required to re-heat the gas. Since massive flows of material are not observed, the emerging solution to the energy deficit is the active galaxy that is almost always (Burns 1990) present at the center of massive clusters. Shocks and ripples are clearly evident in the deep Chandra image of Perseus (Fabian et al. 2005, 2006), and could provide steady heating of the center of the cluster (Fabian et al. 2005). In Perseus the AGN manifests itself directly as a bright radio source known as Perseus A or 3C 84, associated with the galaxy NGC 1275. 3C 84 is one of the brightest compact radio sources in the sky and has been studied in some detail (Vermeulen et al. 1994; Taylor & Vermeulen 1996; Silver et al. 1998; Walker et al. 2000). In particular it is known to undergo bursts of activity (Kellermann & Pauliny-Toth 1968; Taylor & Vermeulen 1996) that could also drive the observed shocks and sound waves through the cluster.
Faraday rotation measure (RM) observations with the Very Large Array (VLA) of radio galaxies embedded in clusters of galaxies have been used to elicit information about the magnetic field strength and topology associated with the hot cluster gas (Taylor et al. 1994; Carilli & Taylor 2002). These magnetic fields then play an important role in modifying the energy transport and dissipation in the center of the cluster (Fabian et al. 2005). Comparisons between the inferred cooling flow rates (in the absence of re-heating) and the maximum Faraday rotation measure indicate a correlation, and there is some evidence that magnetic fields are enhanced at the centers of clusters (Feretti et al. 1999; Vogt & Enßlin 2005). Given the high density of gas at the center of the Perseus cluster the Faraday rotation measures towards 3C 84 are expected to be well over 1000 rad m-2 (Taylor et al. 1994). Unfortunately such high RMs, and the correspondingly large RM gradients are difficult to measure due to cancellation of the linearly polarized signal within the telescope beam (typically 0.5″for VLA observations). Another problem with obtaining polarimetric measurements of 3C 84 with the VLA is the high dynamic range imposed by the 20 Jy peak flux density at centimeter wavelengths and arcsecond resolution. In order to overcome these limitations we have used simultaneous multi-frequency observations of 3C 84 at high angular resolution taken using the Very Long Baseline Array.
Throughout this paper we assume = 71 km s-1 Mpc-1 so that 1″ = 0.35 kpc at the redshift of NGC 1275 (0.0176; Huchra et al. (1999)).
2 VLBA Observations
Observations were centered on 4.8 GHz, 8.4 GHz, 15.1 GHz, and 22.2 GHz with the VLBA on 26 October 2004 and 11 November 2004 using the VLBA111The National Radio Astronomy Observatory is operated by Associated Universities, Inc., under cooperative agreement with the National Science Foundation.. In both cases, 3C 84 was being used as the leakage term calibrator for observations of Compact Symmetric Objects (Gugliucci et al. 2005). Six scans of typically 2 minutes duration were obtained at each frequency band. Each frequency band was separated into four IFs, and these IFs were paired for the purpose of imaging the total intensity except at 22.2 GHz where all four IFs were averaged. For the purposes of determining the polarization and subsequently the RMs each IF was imaged separately in Stokes Q and U. Observational parameters are presented in Table 1.
Amplitude calibration of the data was derived from system temperatures and antenna gains. Fringe-fitting was performed with the AIPS task FRING on 3C 84. The leakage, or D-term solutions were determined with the AIPS task LPCAL on 3C 84. Absolute electric vector position angle (EVPA) calibration was determined using the EVPAs of J1310322 and BL Lac listed in the VLA Monitoring Program222http://www.vla.nrao.edu/astro/calib/polar/ (Taylor & Myers 2000). Note that the EVPAs were corrected for each of the four IFs separately.
3 Chandra Observations
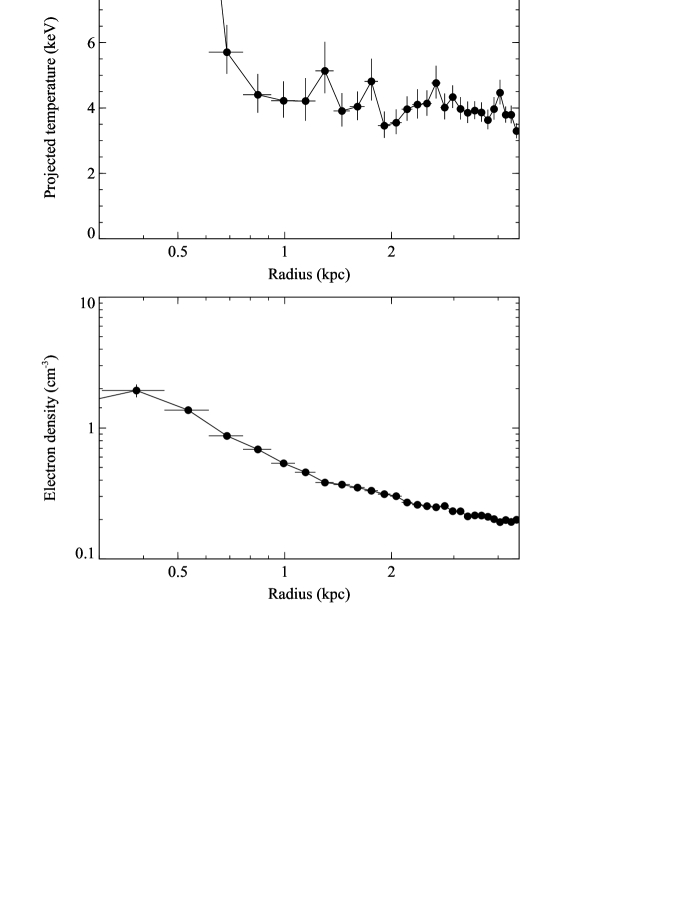
We used recent deep Chandra observations (Fabian et al. 2006) of the Perseus cluster to model the central density profile. In Fig. 1 we show the deprojected density profile and the projected temperature profile. Within the central 0.8 kpc (2.2″) the profile is severely affected by the nucleus so that the temperatures and densities are not representative of the properties of the intracluster medium (ICM). We estimate an average central density over the inner 2 kpc to be 0.3 cm-3.
4 Results
We formed total intensity images of 3C 84 between 5 and 22 GHz. Images of similar quality are readily available in the literature (Vermeulen et al. 1994; Walker et al. 2000), so we do not reproduce them here. Instead we provide a brief summary of source properties (position, flux density, size, distance, etc.) in Table 2, and we concentrate here on the polarimetry results.
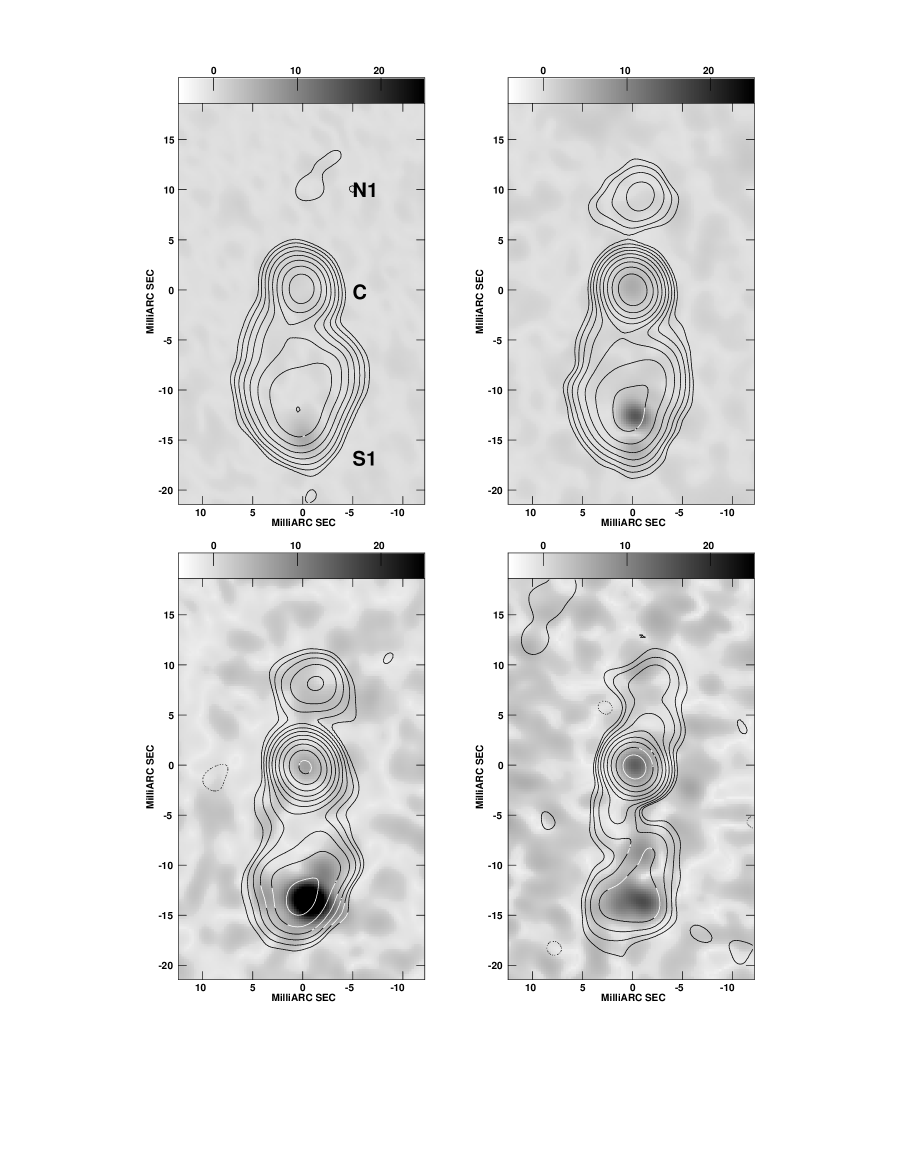
We formed linear polarization images at constant resolution (see Fig. 2) for the purpose of comparing the polarization properties of 3C 84 as a function of frequency. The resolution in Fig. 2 is set by the 5 GHz observations and the higher frequencies have been tapered to provide matching resolution. Linear polarization is detected on November 11 from the bright jet component S1 in 3C 84 at 5, 8, 15 and 22 GHz at a level of 0.8 to 7.5% increasing with frequency. Furthermore, there is some suggestion at 8.4 GHz and above that the polarization is extended. Similar results were obtained on October 26, but the leakage calibration was not as good at this epoch, so for the remainder of the discussion we focus on the November 11 results.
The detection of core polarization is less than 0.1% for all frequencies except for 22 GHz for which it is 0.2%. At this level the 14 mJy of linearly polarized flux density could well be significant. There is also some suggestion of polarization at 22 GHz in between the core and the end of the bright inner emission (component S1).
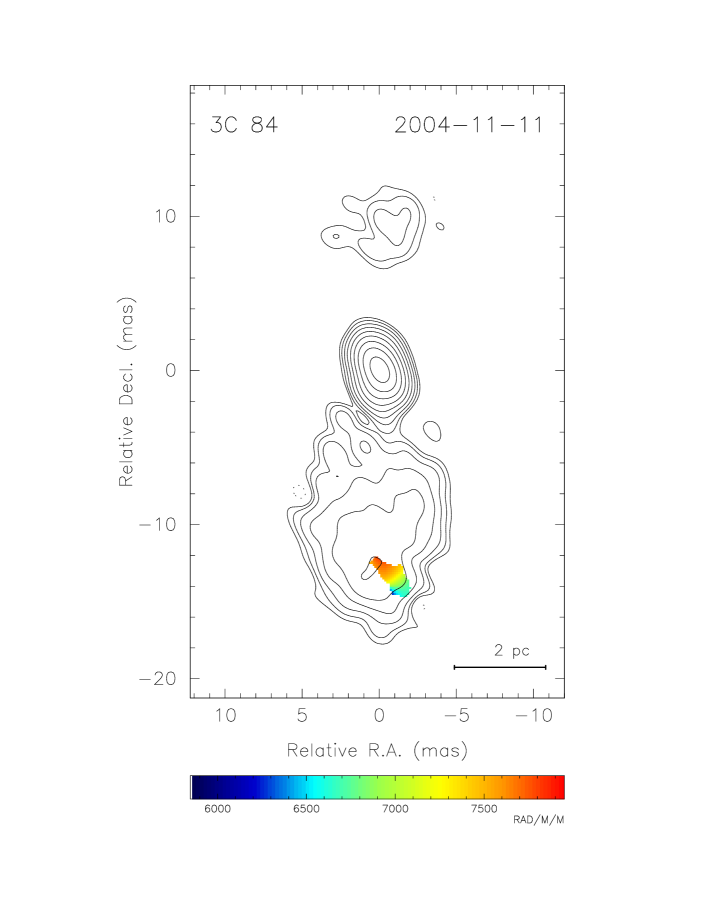
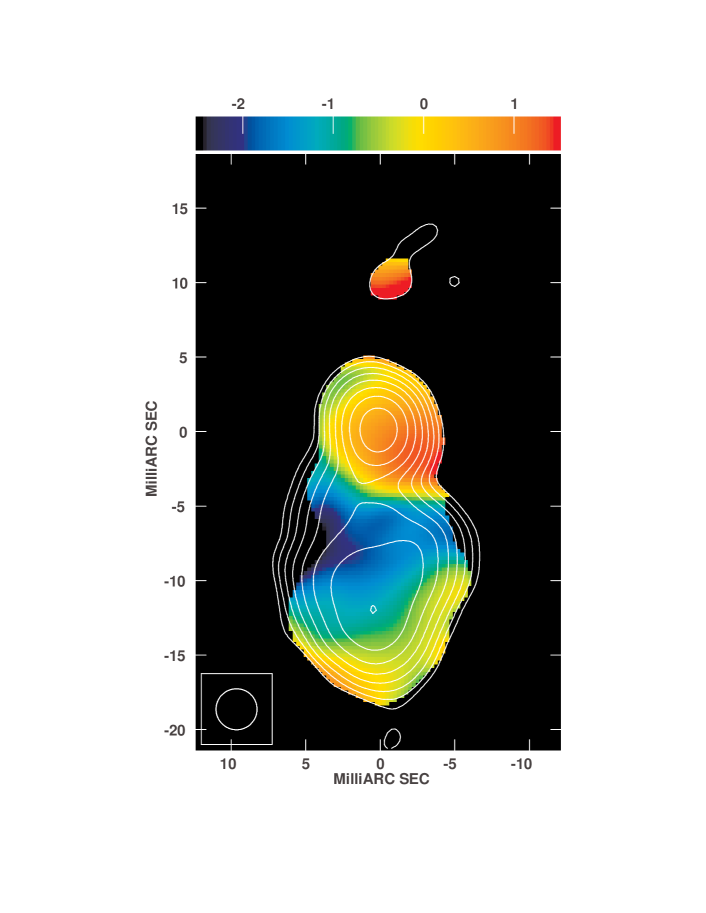
In Fig. 3 we present the RM image, a pixel-by-pixel fit to the polarization angle as a function of the square of the wavelength (). Since the 5 GHz observations were only weakly polarized and did not resolve S1, we have not included them in the fit. The 8 frequencies included in the fit were: 8.114, 8.184, 8.421, 8.594, 14.906, 14.972, 15.269, 15.368, and 22.233 GHz. The 15 and 22 GHz observations were tapered to match the 8.4 GHz resolution of 1.8 1.3 mas2. Pixels were blanked if the statistical error in polarization angle exceeded 5 degrees at any frequency. A representative fit at the peak of the polarized flux density of S1 is shown in Fig. 4. The systematic uncertainties in the polarization angle measurements were assumed to be 3 degrees.
The rotation measure image (Fig. 3) shows a gradient of about 1000 rad m-2 pc-1 across component S1 in the southern jet component. The statistical error in the RM determinations are 60 rad m-2, so it is likely that this gradient is real. It is possible that spectral effects (see Fig. 6) and substructure at the high frequencies cause some departures from a law. There is significant depolarization (9.5% at 15.3 GHz to 3.5% at 8.2 GHz at 1.5 mas resolution) in the southern hot spot. This depolarization, and that seen between 5 and 22 GHz in a larger beam, are consistent with beamwidth depolarization by the observed RM gradient.
It is worth noting that the RM decreases with increasing distance from the center of the lobe, i.e., the gradient slopes down in the direction of the edge of the lobe. This indicates that the density and/or the field strength decreases towards the edge. This situation is reminiscent of that in M87 where no polarization is detected in the bright inner few parsecs (Zavala & Taylor 2002), and is most naturally explained by a radial falloff in the density. Polarization is not expected from the counterjet in 3C 84, both because it is fainter, and because it is behind a denser Faraday screen.
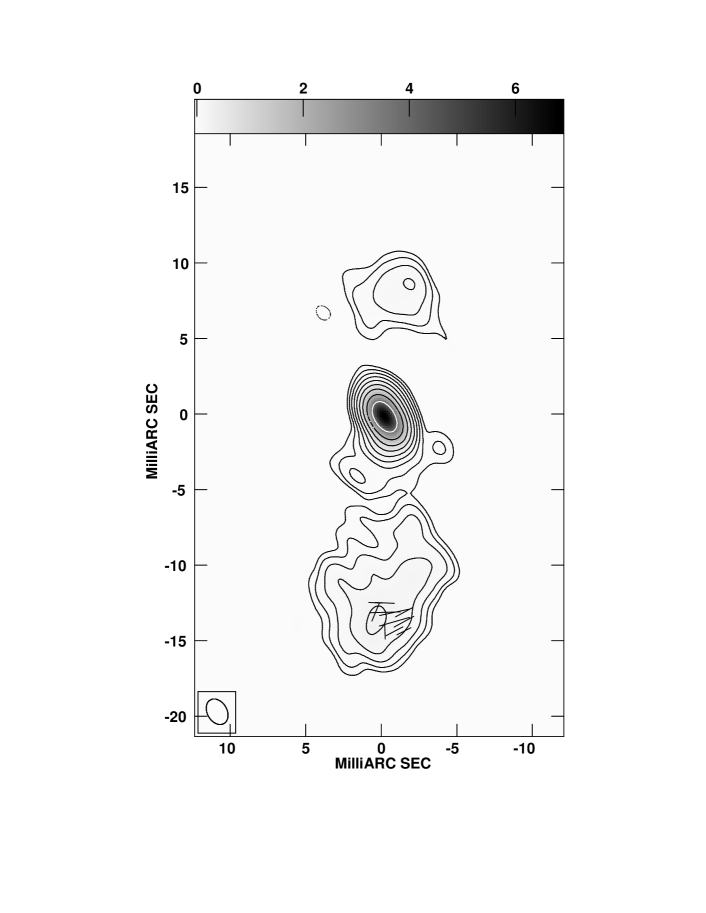
The RM corrected plot of the projected magnetic field orientation of the linearly polarized flux at 15 GHz is shown in Fig 5. The intrinsic magnetic field in the southern jet component S1 appears to be predominantly perpendicular to the jet axis, as expected if the field is enhanced by compression. The polarization angle of the core is uncertain given that the RM of the core is not well determined and is likely to be well in excess of 10000 rad m-2.
We note that Homan & Wardle (2004) found strong circular polarization in the central parsec of 3C 84, reaching +3% at 15 GHz. They speculate that the circular polarization may be produced by Faraday conversion of linear to circular polarization. No circular polarization was detected by Homan & Wardle (2004) from the bright southern jet at 15 or 22 GHz, and the linear polarization from the central parsec was found to be less than 1%.
5 Discussion
5.1 Magnetic Fields in Perseus
For a refractive medium in the presence of magnetic fields the intrinsic polarization angle, , is observed as such that
| (1) |
where is the observed wavelength. The rotation measure, RM, is related to the electron density, , the net line of sight magnetic field in the environment, , and the path length, , through the plasma, by the equation
| (2) |
where units are in cm-3, G, and kiloparsecs. Our best estimate from §3 for is 0.3 cm-3. We assume a path length of 2 kpc, which probes the highest density gas in the cluster, and is typical of RM scale sizes in other cooling core clusters (Carilli & Taylor 2002). Assuming a constant magnetic field orientation, we find a magnetic field strength of 15 G. This is only the component along the line-of-sight, so correcting by a factor of we estimate a field strength of 25 G.
Field strengths calculated with these parameters can be compared to the strength of a magnetic field that has the same pressure as a gas of the same ne and a temperature of 5 107 K using
| (3) |
In the central ( kpc) region of the Perseus cluster we find this gives 300 G, so the magnetic pressure from the estimated field strength of 25 G is two orders of magnitude less than the thermal pressure ( dyn cm-2). This result is similar to that found in other cooling core clusters.
A difficulty with producing the RMs in 3C 84 in the ICM is that the observed gradient of 10% of the RM on scales of 1 pc is hard to reconcile with fields organized on kpc scales.
5.2 The high-velocity system
Emission- and absorption-line studies have highlighted the existence of a high-velocity system (at 8200 km s-1) at approximately the same position on the sky as NGC 1275 (which has a systemic velocity of km s-1). This system is likely to be associated with a spiral galaxy falling into the Perseus cluster at 3000 km s-1. Recently Gillmon, Sanders, & Fabian (2004) have shown through the study of the X-ray absorption that this system is not interacting with the body of NGC 1275 and that they are separated by at least 57 kpc.
Can this spiral galaxy be responsible for the observed rotation measures? The hot component of its ISM is not likely to produce the observed RMs, as the required density (assuming a of 3 G, a path length of 10 kpc and a temperature of K) is 0.3 cm-3, about two orders of magnitudes larger than one would infer from a simple pressure equilibrium argument with the neutral component of the ISM, whose density and temperature were estimated by Momjian, Romney, & Troland (2002). The possibility that a very compact H II region belonging to the high-velocity system might be responsible for the observed RMs cannot be completely excluded, even though the probability of finding such a region directly along our line-of-sight to the core of NGC 1275 is very small.
5.3 The ionized filaments
The filamentary structure of ionized gas associated with NGC 1275, instead, might well produce the observed RMs: the H observations performed by Conselice, Gallagher, & Wyse (2001) showed the presence of unresolved features with size less than 230 pc and lower bound electron densities of cm-3. Densities measured in the [SII] lines in the central kiloparsecs are 270 cm-3 (Johnstone & Fabian 1988; Heckman et al. 1989), and the optical filaments are thought to be in equipartition with the ICM with pressures of dyn cm-2. Comparing the central surface brightness in H with emission from gas at the X-ray pressure (Fabian et al. 2003) near the center of the cluster gives a depth of 0.06 pc for a temperature of 104 K and a uniform covering fraction, . If the filaments are more filamentary than sheet-like, then the depth of the H increases in proportion to 1/, but it becomes difficult with a small covering factor to produce coherent rotation measures across the radio source. Also, if the surface brightness of the H line rises close to the nucleus where it is unresolved, then this can increase the estimate of the depth. Observations in the Pa line (Wilman et al. 2005) indicate that the surface brightness does rise by one to two orders of magnitude within the inner 150 pc. This increases the above estimate for the depth of the filaments from the H line to at least 1 parsec.
The small size of the ionized filaments could explain the 10% gradient in the RM on scales of a parsec. Assuming a constant gradient we might use this to estimate a scale size for the RMs of 10 parsecs. Assuming that the scale size along the line-of-sight is similar to that in the plane of the sky leads to an estimate for the Faraday depth of 10 pc.
With the above density and path length (10 pc) and the observed RM we obtain a lower limit for of 4 G, and hence a magnetic pressure of dyn cm-2, nearly three orders of magnitude below the thermal pressure. If the filaments are as small as 1 pc (with a uniform covering factor, ), then the field strength required to produce the observed RMs is G, but the magnetic pressure is still less than the thermal pressure by a factor of 4.
It is also possible that the radio source is interacting with the ionized gas and that the densities are enhanced at the southern edge of the expanding source, which appears reminiscent of a bow-shock. Locally higher densities would further reduce the strength of the magnetic fields required to produce the observed RMs. Similar magnitude RMs have been detected in a few other well studied radio galaxies (e.g., M87, 3C120 Zavala & Taylor (2002)), and attributed to ionized gas in close proximity to the radio emission. Baum et al. (2005) have shown that there is no significant column density of more neutral gas along the line of sight to the nucleus from the lack of any strong Ly absorption.
We note that the observed decrease in fractional polarization with wavelength can be attributed to gradients in the Faraday screen.
6 Conclusions
We find substantial Faraday Rotation Measures of 7000 rad m-2 toward 3C 84. RMs as large or larger than this have been suspected for some time due to the low observed polarization from this bright radio galaxy. The Faraday screen is most likely to be associated with the ionized gas that also produces spectacular filaments of H emission in the Perseus cluster. This gas may well have magnetic fields organized on small enough scales ( 10 pc), to produce the observed gradient in the RM.
Our current measurements provide only a few very closely spaced lines-of-sight through the cluster. To establish the scale size over which the magnetic fields are organized, and to look for correlations with the cavities seen in the X-ray emission, we would like to be able to sample the RM distribution in the Perseus cluster on scales out to many 10s kiloparsecs. There is fairly strong radio emission on these scales, but detecting the polarization is challenging. To determine RMs in larger regions we have to have greater sensitivity to extended emission than the VLBA provides. But increasing the beam size means more susceptibility to RM gradients within the beam. It also means that the flux within the central resolution element goes up (quite dramatically when components C and S1 merge) so the required dynamic range increases as well. Errors in the leakage calibration are typically 0.5% for individual antennas and will average out over an array by where N is the number of elements in the array; errors are further reduced away from the image center by an additional factor of (Roberts et al. 1994). These errors scale with the total intensity so that a point source of 10 Jy produces a linear polarization noise floor of 5 mJy/beam for the VLBA and 2 mJy/beam for the VLA.
An array like the proposed EVLA phase 2 with 35 antennas, excellent sensitivity, and sub-arcsecond resolution could have a good chance of detecting polarization from a larger region across 3C 84 at high frequencies. The EVLA phase 1 currently under construction has less resolution than desired, but if the errors in the leakage terms can be reduced below 0.5%, then it might be possible for some regions where the gradient happens to be low to be measured. This will also become easier in time so long as 3C 84 continues to fade at centimeter wavelengths (Aller et al. 2003).
Future VLBA observations of 3C 84 to look for changes in the RM distribution with time could provide additional information about the nature of the Faraday screen.
References
- Aller et al. (2003) Aller, M. F., Aller, H. D., & Hughes, P. A. 2003, ApJ, 586, 33
- Baum et al. (2005) Baum, S. A., Laor, A., O’Dea, C. P., Mack, J., & Koekemoer, A. M. 2005, ApJ, 632, 122
- Burns (1990) Burns, J. O. 1990, AJ, 99, 14
- Carilli & Taylor (2002) Carilli, C. L., & Taylor, G. B. 2002, ARA&A, 40, 319
- Conselice, Gallagher, & Wyse (2001) Conselice, C. J., Gallagher, J. S. III, & Wyse, R. F. G., 2001, AJ, 122, 2281
- Fabian et al. (2003) Fabian, A. C., Sanders, J. S., Crawford, C. S., Conselice, C. J., Gallagher, J. S., & Wyse, R. F. G. 2003, MNRAS, 344, L48
- Fabian et al. (2005) Fabian, A. C., Sanders, J. S., Taylor, G. B., & Allen, S.W. 2005, MNRAS, 360, L20
- Fabian et al. (2005) Fabian, A. C., Reynolds, C. S., Taylor, G. B., & Dunn, R. J. H. 2005, MNRAS, 363, 891
- Fabian et al. (2006) Fabian, A. C., Sanders, J. S., Taylor, G. B., & Allen, S.W., Crawford, C.S., Johnstone, R.M., & Iwasawa, K. 2006, MNRAS, submitted
- Feretti et al. (1999) Feretti, L., Dallacasa, D., Govoni, F., Giovannini, G., Taylor, G. B., & Klein, U. 1999, A&A, 344, 472
- Gillmon, Sanders, & Fabian (2004) Gillmon, K., Sanders, J. S., & Fabian, A. C., 2004, MNRAS, 348, 159
- Gugliucci et al. (2005) Gugliucci, N. E., Taylor, G. B., Peck, A. B., & Giroletti, M. 2005, ApJ, submitted
- Heckman et al. (1989) Heckman, T. M., Baum, S. A., van Breugel, W. J. M., & McCarthy, P. 1989, ApJ, 338, 48
- Homan & Wardle (2004) Homan, D. C., & Wardle, J. F. C. 2004, ApJ, 602, L13
- Huchra et al. (1999) Huchra, J. P., Vogeley, M. S., & Geller, M. J. 1999, ApJS, 121, 287
- Johnstone & Fabian (1988) Johnstone, R. M., & Fabian, A. C. 1988, MNRAS, 233, 581
- Kellermann & Pauliny-Toth (1968) Kellermann, K. I., & Pauliny-Toth, I. I. K. 1968, ARA&A, 6, 417
- Momjian, Romney, & Troland (2002) Momjian, E., Romney, J. D., & Troland, T. H., 2002, ApJ, 566, 195
- Roberts et al. (1994) Roberts, D. H., Wardle, J. F. C., & Brown, L. F. 1994, ApJ, 427, 718
- Silver et al. (1998) Silver, C. S., Taylor, G. B., & Vermeulen, R. C. 1998, ApJ, 502, 229
- Taylor et al. (1994) Taylor, G. B., Barton, E. J., & Ge, J. 1994, AJ, 107, 1942
- Taylor & Vermeulen (1996) Taylor, G. B., & Vermeulen, R. C. 1996, ApJ, 457, L69
- Taylor & Myers (2000) Taylor, G. B. & Myers, S. T. 2000 VLBA Scientific Memo 26, National Radio Astronomy Observatory
- Vermeulen et al. (1994) Vermeulen, R. C., Readhead, A. C. S., & Backer, D. C. 1994, ApJ, 430, L41
- Vogt & Enßlin (2005) Vogt, C., & Enßlin, T. A. 2005, A&A, 434, 67
- Walker et al. (2000) Walker, R. C., Dhawan, V., Romney, J. D., Kellermann, K. I., & Vermeulen, R. C. 2000, ApJ, 530, 233
- Wilman et al. (2005) Wilman, R. J., Edge, A. C., & Johnstone, R. M. 2005, MNRAS, 359, 755
- Zavala & Taylor (2002) Zavala, R. T., & Taylor, G. B. 2002, ApJ, 566, L9

| Source | Date | Freq. | Time | Bandwidth | Peak | rms |
|---|---|---|---|---|---|---|
| (GHz) | (min) | (MHz) | (mJy/beam) | (mJy/beam) | ||
| (1) | (2) | (3) | (4) | (5) | (6) | (7) |
| 3C84 | 20041026 | 4.6 | 11 | 16 | 3200 | 0.52 |
| 20041026 | 5.0 | 11 | 16 | 3560 | 0.96 | |
| 20041026 | 8.2 | 10 | 16 | 7390 | 1.20 | |
| 20041026 | 8.5 | 10 | 16 | 7620 | 1.21 | |
| 20041026 | 14.9 | 10 | 16 | 8960 | 2.27 | |
| 20041026 | 15.3 | 10 | 16 | 8910 | 2.25 | |
| 20041026 | 22.2 | 10 | 32 | 5990 | 7.63 | |
| 3C84 | 20041111 | 4.6 | 13 | 16 | 3120 | 0.31 |
| 20041111 | 5.0 | 13 | 16 | 3520 | 0.39 | |
| 20041111 | 8.2 | 12 | 16 | 7430 | 0.56 | |
| 20041111 | 8.5 | 12 | 16 | 7600 | 0.36 | |
| 20041111 | 14.9 | 13 | 16 | 8750 | 1.38 | |
| 20041111 | 15.3 | 13 | 16 | 8750 | 1.37 | |
| 20041111 | 22.2 | 14 | 32 | 5940 | 1.36 |
Table 2. Source Properties
| Property | 3C 84 |
|---|---|
| core RA (J2000) | 03h19m48s. 1601 |
| Dec. (J2000) | 41°30′42″. 104 |
| Gal. long. () | 150.58∘ |
| Gal. lat. () | 13.26∘ |
| radial velocity | 5264 11 km s-1 |
| distance from cluster center | 0.0 Mpc |
| luminosity distance | 75.4 Mpc |
| core flux density (5 GHz) | 3.1 0.16 Jy |
| core power (5 GHz) | 2.1 1024 W Hz-1 |
| largest angular size | 200″ |
| largest physical size | 70 kpc |
| total flux density (5 GHz) | 23.3 Jy |
| total power (5 GHz) | 1.6 1025 W Hz-1 |