Accretion in the -Oph pre-main sequence stars ††thanks: Based on observations collected at the European Southern Observatory, Chile. Program 073.C-0179.
Abstract
Aims. The aim of this paper is to provide a measurement of the mass accretion rate in a large, complete sample of objects in the core of the star forming region Oph.
Methods. The sample includes most of the objects (104 out of 111) with evidence of a circumstellar disk from mid-infrared photometry; it covers a stellar mass range from about 0.03 to 3 M⊙ and it is complete to a limiting mass of 0.05 M⊙. We used J and K-band spectra to derive the mass accretion rate of each object from the intensity of the hydrogen recombination lines, Pa or Br. For comparison, we also obtained similar spectra of 35 diskless objects.
Results. The results show that emission in these lines is only seen in stars with disks, and can be used as an indicator of accretion. However, the converse does not hold, as about 50% of our disk objects do not have detectable line emission. The measured accretion rates show a strong correlation with the mass of the central object () and a large spread, of two orders of magnitude at least, for any interval of M⋆. A comparison with existing data for Taurus shows that the objects in the two regions have similar behaviour, at least for objects more massive than M⊙. The implications of these results are briefly discussed.
Key Words.:
Stars: formation - Accretion, accretion disks1 Introduction
Accretion disks are common around young stars of all mass, from M⋆3 M⊙ down to very low mass objects and brown dwarfs. They form during the collapse of the molecular core, from which the star is born, and last well beyond this initial phase, when the core has dispersed and the star has acquired most of its final mass. The accretion disks are the birthplace of planets, whose formation and evolution are controlled by the disk physics.
Even if accretion disks have been part of the accepted paradigm of star formation for many years, many of their physical properties are poorly known, and the physical mechanism of angular momentum transfer, which determines the disk evolution, is still unclear. The physical quantity that controls the accretion phase is the mass accretion rate through the disk . This quantity can be derived only indirectly, by fitting models to observed quantities such as the UV excess emission and/or the profiles and intensity of lines believed to form in the accreting gas. Measurements of are now available for a large number of stars in Taurus (e.g., Muzerolle et al. Mea05 (2005) and references therein). The results have shown that is a strong function of the mass of the central object, roughly , and that a large dispersion is present (about two orders of magnitude) for objects with the same M⋆. Both results are a challenge for accretion disk models, as discussed, e.g., by Muzerolle et al. (Mea03 (2003)) and Natta et al. (Nea04 (2004)).
Measurements of accretion rates in other star forming regions are scarce in comparison, mostly limited to very low mass objects (Muzerolle et al. Mea03 (2003), Mea05 (2005)). In a study of very low mass objects and brown dwarfs in Ophiuchus, Natta et al. (Nea04 (2004)) found that they are actively accreting with higher by at least one order of magnitude than objects of similar mass in Taurus. This could be due to a difference in age, since the Ophiuchus BDs are very young objects, younger than their Taurus counterparts, but could also be due to different environmental conditions.
While it is clearly necessary to improve the physical models of accretion disks, at the same time it is important to study large and if possible complete samples of stars in a variety of star forming regions, differing in age and global properties.
We report in this paper the results of a project aimed at measuring the mass accretion rate of a large sample of pre-main sequence objects, ranging from a few solar masses to few tens of Jupiter masses, in the star forming region Oph. The core of Oph is perfectly suited for such a study, as it is rich in pre-main sequence stars, which include intermediate mass objects, T Tauri stars (TTS) and brown dwarfs (BDs). Its stellar content has been studied, e.g., by Luhman & Rieke (LR99 (1999); LR99 in the following, and references therein to previous work), Natta et al. (Nea02 (2002)) and, more recently, by Wilking et al. (Wea05 (2005)). Moreover, Oph is very different from Taurus, younger and more compact, and it will allow us to explore the accretion properties of pre-main sequence stars under different conditions, following the results of Natta et al. (Nea04 (2004)).
Ophiuchus has been observed in two mid-IR bands with ISO by Bontemps et al. (BKA01 (2001); BKA01 in the following), who detected 199 sources in the Oph core. Of these, 111 were classified, on the basis of their IR colors, as Class II objects, i.e., visible young stellar objects with evidence of disks. They provide a sample of systems with disks complete to a limiting mass of about 0.05 M⊙. In a spectroscopic study of the very low luminosity objects of the BKA01 sample, Natta et al. (Nea02 (2002)) confirmed that they were BDs with mid-IR excess, very likely from a circumstellar disk; as mentioned, these BDs show significant differences in accretion properties from their analogs in Taurus.
The disadvantage of observing Oph is its high extinction, which makes veiling measurements in the UV and visual impossible except for a few objects. The most effective way to determine for the Ophiuchus sample is therefore to use the luminosity of hydrogen recombination lines, such as Pa and/or Br. The relation between IR line luminosity and accretion luminosity, independently measured from the UV excess, was established by Muzerolle et al. (Mea98b (1998)) for TTS, and by Calvet et al. (Cea04 (2004)) for intermediate mass objects. Natta et al. (Nea04 (2004)) extended it to very low mass objects, where was determined by fitting the observed H profiles with the predictions of magnetospheric accretion models.
In this paper, we present the results of a spectroscopic IR survey of Ophiuchus objects. In Sec. 2, we describe the properties of the observed sample, which includes almost all (104 out of 111) the Class II objects and a subset (35 objects out of 77) of the diskless systems (Class III), also from the BKA01 survey, that we will use for comparison. The observations, data reduction and method of analysis are discussed in Sec. 3. The results are presented in Sec. 4 and discussed in Sec. 5. Sec. 6 summarizes our conclusions.
2 Characteristics of the observed sample
2.1 The sample
The most complete survey of young stellar objects in the Oph Main Cloud (L 1688) is that obtained in two mid-IR bands (6.7 and 15.3 m) with ISOCAM (BAK01). Based on the near and mid-IR colors, the objects were divided in Class I (accreting protostars), Class II and tentative Class II (pre-main sequence stars with IR excess typical of disks, like classical T Tauri stars or CTTS), and Class III/tentative Class III (objects with colors typical of stellar photospheres, like weak-line T Tauri stars or WTTS). BAK01 estimate that their Class II sample of 111 objects is complete to a limiting luminosity L⋆0.03 L⊙, corresponding approximately to 0.05 M⊙. The Class III sample is only complete to 0.2 L⊙ (about 0.15 M⊙). Note that not all the Class III objects have been confirmed as Oph members. Barsony et al. (BRM05 (2005)) have recently confirmed the accuracy of the ISOCAM results with ground-based 10m observations of a large subset of the BKA01 sources.
Our sample includes 104 of the 111 Class II/tentative Class II objects (Class II for simplicity in the following) listed by BAK01 in the Oph core. Most of the spectra (96) were obtained in the J band; the remaining 8, of objects too weak in J, in the K band; one object has been observed at both wavelengths. As a comparison sample, we observed 35 of the 77 Class III and tentative Class III (in the following, Class III) objects, 31 in the J band and 4 in K. The objects and their properties are listed in Tables C.1 and C.2 111All the tables are available in electronic form only..
2.2 Stellar parameters
The stellar properties (i.e., spectral type, luminosity, mass and radius) of the BAK01 sample are well known only for a handful of objects. The main difficulty comes from the large uncertainties that affect spectral types, due to the combination of high extinction and large veiling, even at near-IR wavelengths (e.g., LR99 and references therein; Doppman et al. Dea03 (2003); Wilking et al. Wea05 (2005)). LR99, using K-band low resolution spectra, provide spectral types for 37 of our Class II objects. However, 23 of them have uncertainties of almost one spectral class.
Given the uncertainties, and considering that most of our objects do not have any spectral classification, we have decided to adopt a statistical approach, following BAK01.
First, we compute the extinction toward each object from the observed (J-H)-(H-K) colors, as given by 2MASS 222This publication makes use of data products from the Two Micron All Sky Survey, which is a joint project of the University of Massachusetts and the Infrared Processing and Analysis Center/California Institute of Technology, funded by the National Aeronautics and Space Administration and the National Science Foundation. , corrected to CIT system, adopting the Ophiuchus extinction law of Kenyon et al. (KLB98 (1998)) and the locus of CTTS defined by Meyer et al. (MCH97 (1997)). The result can be expressed as:
| (1) |
This relation gives the correct reddening also for objects with no excess in the near infared, as long as they have Teff K (spectral type later than K2), which applies to the majority of our sample. However, for diskless objects of earlier spectral type it will underestimate AJ and thus the inferred L⋆ significantly. We will come back to this point in §4.1.
The stellar luminosity is computed from the J magnitude and AJ, using a bolometric correction similar to that adopted by BAK01:
| (2) |
where L⋆, are in units if L⊙ and . Eq.(2) assumes that the J-band disk emission is negligible in comparison to the photospheric one. If this is not the case, the equation overestimates L⋆. A recent work by Cieza et al. (Cea05 (2005)) suggests that classical TTS have a J-band excess of mag on average, so that L⋆ derived from the J magnitude is higher than the true one by about 30%. We have checked that, if such a correction applies to objects of all masses, none of our conclusions will change. Our values of L⋆ are in agreement with LR99 estimates always within a factor of 2, and generally much better. We have also compared the luminosities derived in this way with the results obtained by Natta et al. (Nea02 (2002)) from near-infrared J,H,K low resolution spectroscopy for a group of 10 BDs; also in this case, the results are within a factor of 2, with the exception of one object (Oph-ISO 033), for which we underestimate the luminosity by almost one order of magnitude. This discrepancy has no impact on the results of this paper.
When only H and K magnitudes were available (17 Class II and 1 Class III objects), we estimated the stellar luminosity using eq.(2) and (4) of BKA01.
There are 5 objects (4 Class II and 1 Class III) that have companions clearly seen in our spectra, but which are not resolved in the 2MASS photometry. All the companions have a good detection of the continuum; the flux ratio between the primary and the secondary is always larger than a factor of 3. Two of the companions (Oph-ISO 068b and Oph-ISO 072b) have been detected in the K-band Oph multiplicity survey of Ratzka et al. (Ratzka05 (2005)), with flux ratios to the primary of 0.19 and 0.16, respectively. We have accordingly not corrected the 2MASS magnitudes of the primaries for the contribution of the companions, because the corrections to the derived parameters would have been within the uncertainties. The secondary components have no detectable Pa emission, and we will omit them from our analysis in the following; their properties are summarized in Table C.3.
To determine stellar radii and masses, we make the assumption that the star formation in Ophiuchus is coeval, and that all the objects lie on a single isochrone in the HR diagram. With this assumption, we can derive stellar mass, temperature and radius from the measured L⋆. This procedure is reasonable for the Ophiuchus core, whose age estimates range between 0.5 and 1 Myr, with very few stars older than that (BAK01; LR99). In the following, we adopt the D’Antona and Mazzitelli (DM97 (1997) and 1998 web updates; DM98 in the following ) evolutionary tracks for an age of 0.5My. The uncertainties introduced by the assumption of coeval star formation and the differences expected if other evolutionary tracks were used are discussed in Appendix A.
The values of the stellar parameters are given in Tables C.1 and C.2.
3 Observations and data analysis
3.1 Observations and data reduction
Near infrared moderate resolution J and K band spectroscopic observations of all targets in our sample were obtained at the ESO Observatories in Chile. The objects were either observed using the SofI instrument at the NTT 3.6m telescope (June 2004, Visitor Mode) or the ISAAC instrument at the Antu 8.2m VLT unit telescope (Spring 2004, Service Mode), as specified in Tables C.1 and C.2. Detailed descriptions of both these instruments are available on the ESO web pages 333http://www.ls.eso.org/lasilla/sciops/ntt/sofi/and http://www.eso.org/instruments/isaac/. For all the objects that were observable at J-band, with SofI we used the 0.6 arcsecond slit and the Blue low resolution grims, resulting in a spectral resolution of approximately and a spectral coverage from to m; with ISAAC we employed the short-wavelength low resolution spectral mode with central wavelength m and slit width, giving a spectral resolution of and a spectral coverage limited to the J-band. A number of objects were only observable at K-band, for these we either used the SofI Red low resolution grism with similar spectral resolution as for the Blue grism observations and spectral coverage from to m, or the ISAAC short wavelength low resolution mode with central wavelength m, which offers a similar spectral resolution as the J-band observations and a spectral coverage limited to the K-band. Integration times varied from about 0.5 to 2 hours on source, depending on the expected brightness of the objects and observing conditions (in Visitor Mode).
During the Visitor Mode observations at the NTT telescope, we acquired several telluric standard stars per night at varying airmasses; each Observing Block from our programme executed in Service Mode at the VLT was preceded or followed by a telluric standard observed with the same instrument mode and at a similar airmass as our target stars. Spectroscopic flat fields and arcs were obtained during daytime either before or after our observations. Standard methods were employed to calibrate our data. We did not attempt to obtain flux calibrated spectra; all our spectra are wavelength calibrated using OH airglow lines and corrected on an arbitrary intensity scale for telluric absorption and instrument response using the telluric standard star observations.
Correction for telluric absorption and instrumental response was obtained observing at similar airmasses early type stars (early B or O) of known spectral type from the telluric standards lists of ISAAC 444http://www.eso.org/instruments/isaac/tools/spectroscopic _standards.html. These stars all have Pa or Br absorption which were manually removed from the spectra before applying the correction.
Most of the spectra are of excellent quality; the detection limits of the Pa or Br equivalent width are in general of yhe order of 0.5–1Å. Variations around this limit are mainly related to the signal to noise ratio achieved on the photospheric continuum of the individual objects. The signal to noise ratio depends on the telescope/instrument used, the observing conditions, the integration time and the apparent magnitude of the object. It is not necessarily a function of the object intrinsic luminosity because the extinction can be very different and because we tried as much as possible to observe two objects at the same time by properly aligning the slit, so that some relatively bright source near a faint one may have been observed with ISAAC and a long integration time. However, most of the lower luminosity objects have been observed with ISAAC and, expecting lower line intensities, with a higher signal to noise ratio; thus, the line detection limits for low luminosity objects are generally lower than for intermediate luminosity ones.
3.2 Method
The luminosity of Pa and Br are computed from the measured equivalent widths of the emission lines and the broad-band J and K fluxes, corrected for extinction, determined as described in §2.2. No correction for underlying photospheric absorption was applied, since the expected equivalent width is small ( Å; Wallace et al. Wea00 (2000)) for objects with Teff K, which represent the quasi-totality of our sample (see Table C.1 and would not change the results.
There are 12 Class II (11 of them have no Pa detection) for which it was not possible to determine line fluxes, due to lack of J magnitudes; they will not be included in the following discussion. Similarly, we will not consider further the one Class II (Oph-ISO 035) with weak Pa in absorption.
The accretion luminosity of each Class II object is deived from the empirical correlation between Lacc and the luminosity of Pa or Br, derived by Natta et al. (Nea04 (2004)) and Calvet et al. (Cea04 (2004)), respectively (see also Muzerolle et al. Mea98b (1998)):
| (3) |
| (4) |
These relations have been calibrated using accretion luminosities derived by fitting the measured veiling (for T Tauri stars) and/or Hα profiles with the predictions of magnetospheric accretion models; the objects used for the calibration cover the mass range from M⊙ to brown dwarfs. The mass accretion rate is then computed from Lacc (). The results are given in Table C.1.
The reliabilty of our procedure was verified by applying it to a sample of well studied pre-main sequence stars, covering roughly the same range of masses, for which reliable values of the stellar parameters (i.e., mass and radius) and of the accretion rate could be found in the literature. Using literature measurements of the Pa intensity and of L⋆, we derived for each object mass and accretion rate as done for the Ophiuchus objects, and compared them to the “real” values. Details can be found in the Appendix B.
We have applied a similar procedure to the Class III objects; the results are shown in Table C.2.
4 Results
4.1 Equivalent Widths
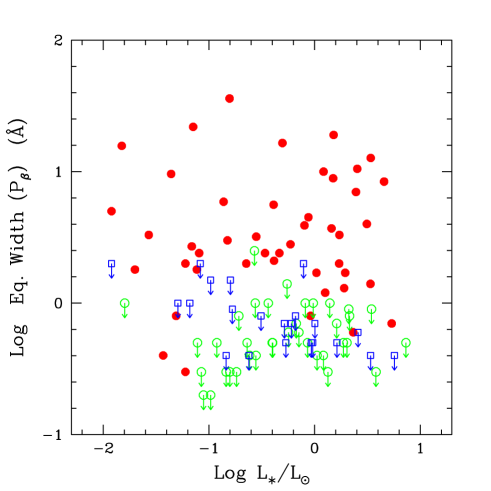
Emission in the near-IR hydrogen recombination lines has been detected in 45% of Class II sources, 46 of the 96 observed in Pa and 1 out of 9 observed in Br. In contrast, no Class III source shows emission in these hydrogen lines; 8 Class III objects have Pa or Br in absorption and for the others we do not see the lines. The measured equivalent widths are given in Table C.1 and C.2. Fig. 1 shows the Pa equivalent width as function of L⋆.
Six Class III objects have Pa in absorption with equivalent widths 1 Å, i.e., larger than one can expect in late-type stars (Wallace et al. Wea00 (2000)). They are likely earlier type stars, and this is certainly the case of Oph-ISO 180, which is classified A7 by Wilking et al. (Wea05 (2005)) and of Oph-ISO 113, earlier than F8 according to LR99. For these six stars, as already mentioned, the method used to estimate AJ and all the derived stellar parameters is not correct; therefore, we omit their stellar parameters from Table C.2.
The comparison between the Class II and Class III samples clearly shows that emission in the near-IR hydrogen lines, in contrast to that in optical lines such as H is restricted to objects with circumstellar disks, and can therefore be used as a reliable accretion indicator. However, one should keep in mind that the opposite is not necessarily true, as about 50% objects with disks have no detected emission.
The fraction of Class II objects with detected Pa emission varies from 56% for L⋆ L⊙to 42% for L⊙. Very low luminosity objects (7 objects with L⋆ L⊙) have a marginally higher detection rate (57%), due in part to the sensitivity limit of our measurements, which is higher for lower luminosity objects (see Sec.3.1), but also due to the incompleteness of the BKA01 survey for very low luminosity sources, which are detected only when they have a large mid-IR excess, very likely indicative of higher accretion rates.
4.2 Accretion Luminosity
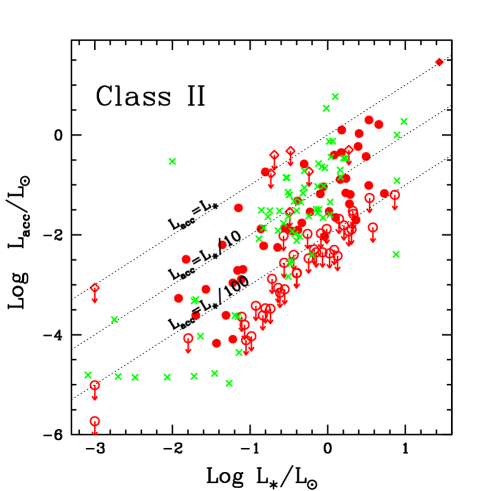
Fig. 2 shows the accretion luminosity of Class II objects computed from the IR line luminosity as a function of L⋆.
For any given L⋆, there is a large range of measured Lacc (about 50), which does not seem to vary significantly with L⋆; because of our sensitivity limit, this is probably just a lower limit to the actual range of Lacc. One can also see that for the majority of objects Lacc/L⋆0.1, but there is a significant fraction of cases with LaccL⋆.
4.3 Mass accretion rate
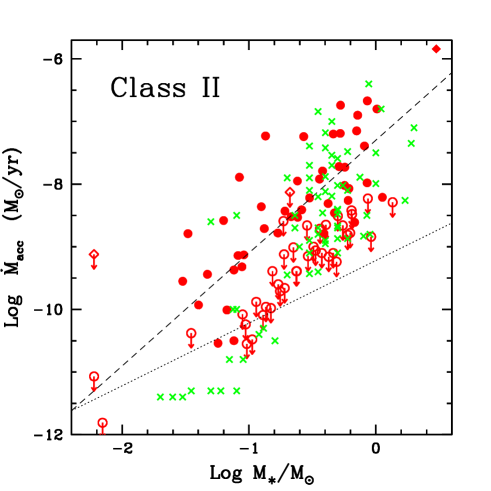
Fig. 3 shows the mass accretion rate of Class II sources as function of M⋆. There is a clear trend of increasing with increasing M⋆. Not including upper limits, we find using ASURV (Feigelson and Nelson FN85 (1985)) M⋆1.8±0.2; the slope does not change if we include the upper limits in the analysis.
Superimposed on this trend, there is a large spread of for any value of M⋆, of two orders of magnitude at least. Within statistical fluctuations, the objects are distributed quite uniformly in this range.
5 Discussion
The results summarized in Fig. 3 describe the accretion properties of the largest sample of Class II stars in any single star-forming region studied so far. The sample contains more than hundred objects with evidence of disks, and is complete in the mass interval from 0.03 to about 3 M⊙. The corresponding accretion rates vary from to M⊙/yr, with a strong dependence of on M⋆ (). For any M⋆, there is a large dispersion of values of , of two orders of magnitude at least, which does not seem to change with M⋆. Note that the real spread is likely bigger, because of the many upper limits in our survey.
5.1 Ophiuchus and Taurus
One of the aims of our study was to compare the accretion properties in Ophiuchus with those of objects in Taurus. The Taurus results are shown by crosses in Fig. 2 and 3. The accretion luminosity and mass accretion rate have been derived from the UV and optical veiling and/or by fitting with magnetospheric accretion models the H profile. This second method is the only possible one for very low mass objects and BDs, since veiling cannot be detected below a limiting value M⊙/yr. The results are from Gullbring et al. (Gea98 (1998)), Muzerolle et al. (Mea98b (1998), Mea03 (2003), Mea05 (2005)), White & Ghez (WG01 (2001)), White & Basri (WB03 (2003)), and Calvet et al. (Cea04 (2004)); note that, for homogeneity, we have re-determined M⋆ using DM98 tracks for all objects.
The methods used to derive Lacc and in the two regions are therefore different, since in Ophiuchus is derived from the luminosity of the hydrogen recombination lines. However, the relations (eq. 3 and 4) we used have been “calibrated” mostly using Taurus objects (see, e.g., Muzerolle et al. Mea98b (1998), Calvet et al. Cea04 (2004), Natta et al. Nea04 (2004)), so that we do not expect any systematic difference in the Ophiuchus-Taurus comparison due to the different methods.
The two figures show that the accretion properties of the two star forming regions are very similar. Muzerolle et al. (Mea05 (2005)) derive M⋆2.1 for their sample (mostly in Taurus, with additional brown dwarfs from other star-forming regions), neglecting upper limits. Within the errors, this relation is identical to what we obtain in Ophiuchus. If we concentrate on Fig. 3, we can see that not only the slope of the relation of with M⋆, but also the range of values is very similar. In particular, the two samples have similar values of the maximum for any given M⋆, and similar spread of values, at least for M⋆ M⊙.
For lower M⋆, most Taurus BDs have very low accretion rates, 1–2 orders of magnitude lower than similar objects in Ophiuchus. As already discussed, the fact that we do not find these very low accretors in Ophiuchus most likely reflects the incompleteness of the BAK01 sample at very low masses, and selects objects with comparatively strong mid-IR fluxes. Natta et al. (Nea02 (2002)) showed that the BAK01 sample of brown dwarfs has relatively large luminosity, and is probably very young. As discussed in Sec. 4.1, a fraction larger than for more luminous objects has detected Pa. All this indicates that there may be low BDs which are missing from the Ophiuchus sample. It is, in a way, more surprising that very few, if any, of the brown dwarfs in Taurus have high , while higher mass objects in the two regions have very similar accretion properties. It is possible that this difference between the two regions at the very low end of the M⋆ distribution contains important information, that needs further investigation. This is, however, beyond the scope of this paper.
5.2 Variability
All pre-main sequence stars are variable objects, and, in particular, all the accretion indicators in TTS and BDs show large variability.
Variability does not affect the correlation of with M⋆, as the Oph sample is sufficiently large that individual fluctuations cannot change it. It may be more important when we consider the spread of values for any given M⋆. Recently, Scholz & Jayawardhana (SJ05 (2005)) have studied the variability of accretion indicators (mostly Hα) for six young brown dwarfs; they claim that the accretion rate in some of their objects varies by at least one order of magnitude, and that this variability may account for the large spread in the – M⋆ correlation.
We have estimated the magnitude of the spread in for individual objects by looking at the results of Gatti et al. (Gea06 (2006)), who have recently obtained J-band spectra of a small (14 objects) subset of our Ophiuchus sample. The Gatti et al. sample includes both TTS and BDs, observed one to two years later than the spectra discussed in this paper. The two data sets show variations in the Pa equivalent width of a factor of two at most (in both directions), with only one exception, where the Pa equivalent width has increased by a factor of three over the time interval between the two sets of observations. For the same objects, we have also looked in the literature for variations of the broad-band J magnitude, used to compute the line flux (Sec.3.2). The variation of , computed taking the maximum variations in the J magnitude and in the Pa equivalent width, is of a factor . This is much smaller than the dispersion of points in Fig. 3 and would not change significantly any of our conclusions.
A detailed analysis of the variability of the IR emission lines and continuum, in analogy to what has been done for Hα (e.g., Johns-Krull & Basri JKB97 (1997)), is certainly needed. However, from the results obtained so far, it seems unlikely that the dispersion of values can be accounted for by variability alone, and that, if averaged over a sufficiently long period of time, one would find that all the Oph stars of a given mass accrete at the same rate.
5.3 Viscous disks
The dependence on M⋆ is difficult to understand in terms of disk physics, as discussed, e.g., by Muzerolle et al. (Mea03 (2003)), Natta et al. (Nea04 (2004)), Calvet et al. (Cea04 (2004)). In a standard steady accretion disk model, is proportional to the disk mass divided by the time scale for viscous evolution. In an -disk (Shakura & Sunyaev SS73 (1973)), the viscosity depends on the ratio , where is the keplerian angular velocity and the sound speed; then, , where and are disk mass and temperature, respectively. With the further assumptions that (e.g., Natta et al. Nea_PPIV (2000)), and that the disk heating is dominated by the stellar irradiation, this gives, to zero order, . For PMS stars, the relation between Teff and M⋆ is rather shallow (approximately for M⋆0.1 M⊙, and much flatter for lower masses; see, e.g., DM98) and we expect to increase roughly as , with . The relation will be even flatter if the contribution of the stellar radiation to the disk heating is negligible.
It is possible that (or, more generally, the efficiency of momentum transfer) depends, in turn, on M⋆. If viscosity is the result of magneto-rotational instabilities (MRI) (see, e.g., Balbus & Hawley BH91 (1991)), the disk gas should be sufficiently ionized. Muzerolle et al. (Mea03 (2003)) suggest that the steep correlation of with M⋆ can be explained if the disk ionization is controlled by the X-ray radiation from the star, since the X-ray luminosity is not constant over the mass spectrum, but is observed to increase with M⋆.
X–ray observations of Ophiuchus have been recently carried out with Chandra and XMM satellites by Imanishi et al. (ima_01 (2001)) and Ozawa et al. (ozawa (2005)). Both studies detected a significant fraction of Class II sources (70 and 48 % respectively); they found that the X–ray spectral properties, as well as the relationship between LX and Lbol of class II sources are similar to those of class III sources, but did not investigate the behaviour of X–ray luminosity with stellar mass. To our knowledge, the only study addressing the relation between mass and X-ray luminosity for young stars over a large range of luminosities and masses is in Orion. The COUP Chandra observations of Orion show that scales approximately as M⋆1.1-1.4 in the interval 0.1–2 M⊙ (Preibisch et al. Pea05 (2005)). However, it is not clear that this variation of is sufficient to produce the observed –M⋆correlation, and more detailed MRI models, which include X-ray ionization, are required. If the X-ray emission of the central star is controlling accretion, the large spread of observed in the COUP data could also explain the large spread of for any given M⋆.
Viscous disk models predict that decreases with time (e.g., Hartmann et al. Hea98 (1998)). Calvet et al. (CHS_PPIV (2000)) estimate , with a large uncertainty, from a sample of TTS in Taurus, Chamaeleon and Ophiuchus. Neither the similarity of accretion rates between Ophiuchus and Taurus nor the very large spread observed in both regions support age as a main factor in the determination of . If the Calvet et al. (CHS_PPIV (2000)) rate is correct, the difference in age between Taurus and Ophiucus should give on average a difference in of a factor , of which we have no evidence. In addition, the Ophiuchus range of more than two orders of magnitude corresponds to an age range of at least a factor 20, much too large when compared to the HR location of the objects (see, e.g., LR99).
The time evolution of viscous disks is influenced by the presence of close companions (see Calvet et al. CHS_PPIV (2000)). Companions truncate the circumstellar disk at a radius which depends on the binary separation. As the disk evolves, more and more matter expands outside the truncation radius, with the effect of decreasing the disk mass and . A sample of objects with the same initial value of but companions at different distances will show with time an increasing spread of values.
This effect, however, is not seen in the Taurus TTS (White & Ghez WG01 (2001)), where the accretion rate is similar for single and primary stars with companions as close as 10 AU. At the age of Ophiuchus, only very close companions have had time to reduce by a significant factor (separation 30 AU or arcsec for an age of years according to Calvet et al. CHS_PPIV (2000)). There have been a number of multiplicity surveys of Ophiuchus, some capable of detecting very close binaries. Three Class II objects (i.e., objects with a mid-IR detected circumstellar disk) have companions closer than arcsec (Barsony et al. BKM03 (2005); Ratzka et al. Ratzka05 (2005)); one has detected Pa, while in the other two cases the line has not been detected. The observational evidence of a correlation between the accretion rate and the presence of very close companions is clearly inconclusive. At this stage, it cannot be quantitatively confirmed nor dismissed, and should be investigated further.
5.4 Initial conditions
Although all the effects discussed so far can play a role and need further investigation, it is possible that differences in the initial conditions, i.e., in the physical properties of the molecular cores from which the star+disk system forms, determine the TTS disk properties, and in particular the behaviour of disussed in this paper.
The self-similar viscous disk models of Hartmann et al. (Hea98 (1998)) show that the accretion rate is proportional to the disk mass at t=0, i.e., when accretion onto the disk stops, and, in the early phases ot the evolution, to its t=0 outer radius, which in turns depend on the core properties. Alexander & Armitage (AA06 (2006)) have started exploring how this can introduce a M⋆2 correlation at a later time.
More realistic models that follow the formation and evolution of circumstellar disks (Hueso & Guillot HG05 (2005)) illustrate clearly how different core properties (in particular, different rotation velocities) can create a large spread of for objects with the same M⋆ and age.
Models that compute the evolution of disks starting from the core infall phase over a large range of parameters are required, if we want to estimate the effect of the initial conditions on the relation of with M⋆ and on its scatter. The observations presented in this paper, and the similar results for Taurus, provide an excellent test of such models. Note that the the fact that disk accretion properties in Taurus and Ophiuchus are very similar, while the two regions have large differences in their environment, should put strong constraints on these models, which will be interesting to explore fully.
6 Summary and conclusions
In this paper, we report the results of a near-IR spectroscopic survey of a large sample of very young objects in the Oph core. The sample includes all Class II objects, i.e., objects with evidence of circumstellar disks from mid-IR photometry (BKA01). This sample covers the mass range between about 0.03 to 3 M⊙; according to BKA01, it is complete to a limiting magnitude of about 0.03 L⊙, or 0.05 M⊙. We have also observed a significant fraction of Class III objects, i.e., with no mid-IR excess emission, covering a similar range of luminosities.
In contrast to the Balmer lines, the near-IR hydrogen recombination lines are seen in emission only in Class II objects. Of all our Class III sample, none has detected Pa emission. This confirms our assumption (Natta et al. Nea04 (2004)) that the near-IR lines can provide an immediate indication of the accreting properties of young stars, even when only relatively low resolution spectra are available.
We have derived the mass accretion rate from the luminosity of the hydrogen recombination lines, mostly from Pa but in few cases from Br. In total, we obtain measurements of for 45 Class II objects, and upper limits for 39.
Our results show that increases sharply with M⋆(). We also find a large range of values of for any given value of M⋆ (a spread of roughly two order of magnitudes, independent of M⋆). As discussed in the text, this is likely a lower limit to the true dispersion.
When compared to accretion measurements in Taurus (see Muzerolle et al. Mea05 (2005) and references therein), we find that the two regions look very similar, at least for objects with M⋆ M⊙. For both Taurus and Ophiuchus, the dependence of on M⋆, the upper envelope of the distribution (i.e., the largest values of that any object of a given mass seems able to sustain), and the range of values for any given M⋆, are very similar. At lower mass, the accretion rates of the Ophiuchus objects are much larger than their Taurus analogs.
The observed behaviour of does not have an obvious explanation. The correlation of with M⋆ may be due to a dependence of the disk physics on the properties of the central star. Muzerolle et al. (Mea03 (2003)) suggest as a cause the effect of the X-ray emission from the central star on the disk ionization and angular momentum transfer. It is also possible that the correlation reflects the properties of the pre-stellar cores, from which the star and disk form. Both possibilities need to be explored further.
The large spread of values of for any M⋆ may be a side-product of the same mechanisms that produce the correlation between these two quantities, as discussed in Sec.5. In addition, other effects may play an important role, for example the dynamical action of close companions, or the intrinsic variability of the accretion process.
Acknowledgements.
It is a pleasure to acknowledge the continuous, competent and friendly support of the ESO staff during the preparation and execution of the Visitor and Service Mode observations at La Silla and Paranal observatories. We whish to thank an anonymous referee for very useful comments. This project was partially supported by MIUR grants 2002028843/2002 and 2004025227/2004.Appendix A Testing the assumption of coeval star formation
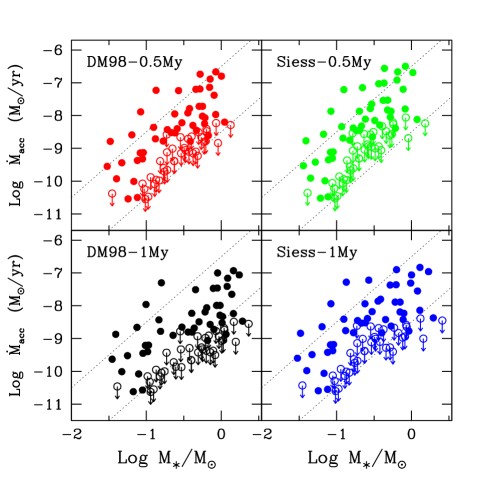
The assumption of coeval star formation, albeit quite reasonable for a region like Oph, introduces errors in our results. The same is true of the choice of any specific set of evolutionary tracks. However, it turns out that both kinds of errors are unimportant, when dealing with a large sample of objects as in our case.
Fig. 4 shows the analog of Fig. 3, reproduced on the top-left panel, computed using the DM98 isochrone for 1 My and the evolutionary tracks of Siess (Siess00 (2000)) for 0.5 My and 1 My, respectively. Older tracks give slightly lower values of , especially for more massive objects, while the range of M⋆ remains practically the same. Adopting different evolutionary tracks does not change the results. The main consequence of assuming coeval star formation is to reduce slightly the real spread of for any given value of M⋆.
Appendix B Taurus: a test of the method
A validation of the method used to compute the two quantities and M⋆and an estimate of the errors can be obtained by applying the same procedure to a sample of objects with known stellar parameters and accretion rates.
The only sample for which this is possible is Taurus, which has been studied extensively over a large range of masses We have taken all the Taurus objects for which we could find in the literature reliable stellar parameters and accretion rates, measured from veiling and/or by fitting the observed H profiles with magnetospheric accretion models (Muzerolle et al. Mea98a (1998), Mea03 (2003), Mea05 (2005), Calvet et al. Cea04 (2004)). For those with published Pa fluxes or equivalent widths, we have followed the same procedure used for the Oph sample. We have first computed Lacc from L(Pa), and determined the stellar parameters M⋆/R⋆ and M⋆ from L⋆, assuming coeval star formation at 1 My and the DM98 evolutionary tracks. is then derived from Lacc and M⋆/R⋆.
The results are summarized in the Fig. 5. The top panel shows the complete sample of Taurus objects for which we could find measurements of in the literature. The squares are those for which also Pa data exist; because none of the BDs in Taurus has a published J-band spectrum, we have added the BDs in Ophiuchus and Chamaeleon for which Natta et al. (Nea04 (2004)) have measured from model fitting of the H profiles. The bottom panel shows the same plot when both M⋆ and are derived from the observed L⋆ and Pa luminosity, as for the Oph stars.
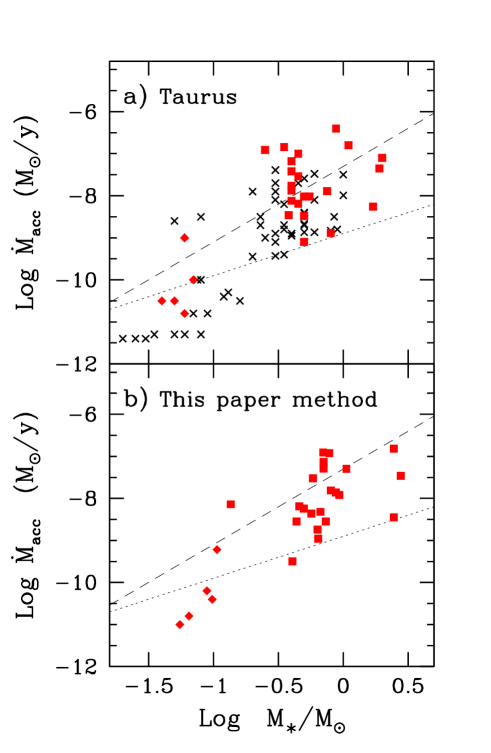
The results indicate that our procedure does not introduce systematic trends in the results. The trend of increasing sharply with M⋆ is reproduced in our method, and also the range of for a given M⋆ is similar, even if, as expected, the assumption of coeval star formation underestimates its spread slightly.
Appendix C Tables
Tables are available in electronic form only.
References
- (1) Alexander R.D., Armitage P.J. 2006, ApJL, accepted (astro-ph/0602059)
- (2) Balbus S.A., Hawley J.F. 1991, ApJ 376, 214
- (3) Barsony M., Koresko C., Matthews K. 2003, ApJ 591, 1064
- (4) Barsony M., Ressler M.E., Marsh K.A. 2005, ApJ 630, 381
- (5) Bontemps S., André Ph., Kaas A.A., et al. 2001, A&A 372, 173
- (6) Calvet N., Hartmann L., Strom S.E. 2000, in “Protostars and Planets IV”, eds Mannings, V., Boss, A.P., Russell, S.S., (Tucson: University of Arizona Press) p. 377
- (7) Calvet N., Muzerolle J., Briceño C.,Hernàndez J., Hartmann L., Saucedo J.L., Gordon K.D. 2004, AJ 128, 1294
- (8) Cieza L.A., Kessler-Silacci J.E., Jaffe D.T., Harvey P.M., Evans N.J.II 2005, ApJ, 635, 422
- (9) D’Antona F., Mazzitelli I. 1997, Mem.S.A.It. 68, 807
- (10) Doppmann G.W., Jaffe D.T., White R.J. 2003, AJ 126, 3043
- (11) Feigelson E. D., Nelson P. I. 1985, ApJ 293, 192
- (12) Gatti T., Testi L., Natta A., Randich S. 2006, in preparation
- (13) Greene T.P., Lada C.J. 1997, AJ 114, 2157
- (14) Gullbring E., Hartmann L., Briceño C., Calvet N. 1998, ApJ 492, 323
- (15) Hartmann L., Calvet N., Gullbring E., D’Alessio P. 1998, ApJ 495, 385
- (16) Hueso R., Guillot T. 2005, A&A 442, 703
- (17) Imanishi, K., Koyama, K., Tsuboi, Y. 2001, ApJ, 557, 747
- (18) Johns-Krull Ch., Basri G. 1997, ApJ474, 433
- (19) Kenyon S.J., Lada E.A., Barsony M. 1998, AJ 115, 252
- (20) Luhman K.L., Rieke G.H. 1999, ApJ 525, 440
- (21) Meyer M.R., Calvet N., Hillenbrand L.A. 1997, AJ 114, 288
- (22) Muzerolle J., Calvet N., Hartmann L. 1998, ApJ 492, 743
- (23) Muzerolle J., Hartmann L., Calvet N. 1998, AJ 116, 2965
- (24) Muzerolle J., Calvet N., Briceño C., Hartmann L., Hillenbrand L. 2000, ApJ 535, L47
- (25) Muzerolle J., Hillenbrand L., Calvet N., Briceño C., Hartmann L. 2003, ApJ 592, 266
- (26) Muzerolle J., Luhman K.L., Briceño C., Hartmann L., Calvet N. 2005, ApJ 625, 906
- (27) Natta A., Grinin V.P., Mannings V. 2000, in “Protostars and Planets IV”, eds Mannings, V., Boss, A.P., Russell, S.S., (Tucson: University of Arizona Press) p. 559
- (28) Natta A., Testi L., Comerón F., Oliva E., D’Antona F., Baffa C., Comoretto G., Gennari S., 2002, A&A 393, 597.
- (29) Natta A., Testi L.,Muzerolle J., Randich S., Comerón F., Persi P. 2004, A&A 424, 603
- (30) Ozawa, H., Grosso, N., Montmerle, T. 2005, A&A, 438, 661
- (31) Shakura N.I., Sunyaev R.A. 1973, A&A 24, 337
- (32) Siess L., Dufour E., Forestini M. 2000, A&A 358, 593
- (33) Preibisch Th., Kim Y.-C., Favata F., Feihelson E.D., Flaccomio E. et al. 2005, ApJS 160, 401
- (34) Ratzka T., K hler R., Leinert Ch. 2005, A&A 437, 611
- (35) Scholz A., Jayawardhana R. 2005, ApJ in press (astro-ph/0510629)
- (36) Wallace L.W., Meyer M.R., Hinkle K., Edwards S. 2000, ApJ 535, 325
- (37) White R.J., Basri G. 2003, ApJ 582, 1109
- (38) White R.J., Ghez A. 2001, ApJ 556, 265
- (39) Wilking B.A., Meyer M.R., Robinson J.G., Greene Th. 2005, AJ 130, 1733
[x]clccccccccccccccl
Class II Objects
(1) (2) (3) (4) (5) (6) (7) (8) (9) (10) (11) (12) (13) (14) (15) (16) (17)
# Object Coordinates J H K AJ Lg L∗ Lg Teff Lg M∗ EW (Paβ)Inst. L(Paβ) Lacc Other
(ISO#) (J2000.0) (mag) (mag) (L⊙) (K) (M⊙) (Å) (L⊙) (L⊙) (M⊙/y) Names
continued.
\endhead\endfoot
1 Oph-ISO 001 16 25 36.74 -24 15 42.40 10.42 9.04 8.38 1.8 0.21 3.59 -0.26 -0.7S -4.27 -1.81 -8.66 IRS2
2 Oph-ISO 002+ 16 25 38.12 -24 22 36.30 12.84 10.75 9.54 3.1 -0.23 3.53 -0.52 -2.8S -4.07 -1.54 -8.22 B162538-242238
3 Oph-ISO 003 16 25 39.58 -24 26 34.90 11.89 10.05 8.95 2.5 -0.10 3.55 -0.44 -3.9S -3.81 -1.18 -7.92 IRS3
4 Oph-ISO 006 16 25 56.16 -24 20 48.20 9.15 8.14 7.52 0.5 0.18 3.59 -0.28 -19.0 S -2.87 0.10 -6.74 SR4/IRS12
5 Oph-ISO 009 16 26 1.37 -24 25 20.40 14.43 12.44 11.24 2.8 -1.07 3.45 -1.03 -0.3I -5.74 -3.80 -10.24 SKS1-4
6 Oph-ISO 012 16 26 4.58 -24 17 51.50 15.79 13.41 12.19 4.2 -1.05 3.45 -1.02 -0.2I -5.96 -4.11 -10.55 B162604-241753
7 Oph-ISO 013 16 26 7.04 -24 27 24.20 15.35 12.38 10.64 5.2 -0.38 3.51 -0.62 -2.1S -4.34 -1.90 -8.53 B162607-242725
8 Oph-ISO 017 16 26 10.33 -24 20 54.80 14.37 10.85 8.47 5.8 0.33 3.61 -0.19 -0.8 S-4.11 -1.58 -8.48 GSS26
9 Oph-ISO 019 16 26 16.84 -24 22 23.20 11.03 9.13 8.20 3.1 0.54 3.64 -0.06 -0.9S -3.87 -1.26 -8.23 GSS29/EL18
10 Oph-ISO 020 16 26 17.06 -24 20 21.60 9.65 8.61 8.06 0.8 0.10 3.58 -0.33 -1.2S -4.15 -1.65 -8.46 DoAr24/GSS28
11 Oph-ISO 023 16 26 18.82 -24 26 10.50 14.84 13.20 12.14 1.8 -1.69 3.42 -1.40 -1.8 I -5.59 -3.61 -9.93 SKS1-BDN04
12 Oph-ISO 024 16 26 18.87 -24 28 19.70 12.58 9.93 8.07 3.7 0.18 3.59 -0.28 -8.9 I -3.20 -0.35 -7.19 VSSG1
13 Oph-ISO 026 16 26 20.97 -24 8 51.90 10.88 9.87 9.50 1.0 -0.33 3.52 -0.59 -2.4 I -4.23 -1.76 -8.41 RBR15
14 Oph-ISO 030 16 26 21.53 -24 26 1.00 12.57 11.52 10.92 0.7 -1.22 3.44 -1.12 -0.3 I -5.95 -4.09 -10.50 GY5
15 Oph-ISO 032 16 26 21.90 -24 44 39.80 12.34 11.48 10.86 0.0 -1.43 3.43 -1.24 -0.4I -6.01 -4.17 -10.54 GY3
16 Oph-ISO 033 16 26 22.27 -24 24 7.10 16.45 15.09 13.94 0.6 -2.95 3.37 -2.16 -0.7 I-7.15 -5.73 -11.81 GY11
17 Oph-ISO 035 16 26 22.96 -24 28 46.10 14.93 12.80 11.53 3.2 -1.12 3.45 -1.06 +0.6 I – – – GY15
18 Oph-ISO 036 16 26 23.36 -24 20 59.80 8.97 7.50 6.57 1.5 0.73 3.66 0.05 -0.7 S -3.80 -1.17 -8.21 GSS31/GY20A
19 Oph-ISO 037 16 26 23.58 -24 24 39.50 15.05 12.25 10.22 3.9 -0.82 3.46 -0.88 -3.0 S -4.58 -2.22 -8.71 LFAM3/GY21
20 Oph-ISO 038 16 26 23.68 -24 43 13.90 9.39 8.40 7.85 0.6 0.13 3.58 -0.31 -0.3S -4.72 -2.42 -9.24 DoAr25/GY17
21 Oph-ISO 039 16 26 24.04 -24 24 48.10 11.12 8.72 7.32 3.9 0.86 3.68 0.13 -0.5S -3.83 -1.20 -8.29 S2/GY23
22 Oph-ISO 040 16 26 24.07 -24 16 13.50 10.00 8.09 6.68 2.0 0.53 3.63 -0.07 -12.7 S -2.72 0.30 -6.67 EL24
23 Oph-ISO 041 16 26 25.28 -24 24 45.00 16.28 13.10 11.07 5.3 -0.74 3.46 -0.83 -0.3I -5.50 -3.48 -9.98 GY29
24 Oph-ISO 043 16 26 27.54 -24 41 53.50 14.04 11.42 9.98 4.6 -0.09 3.55 -0.44 -1.0S -4.39 -1.97 -8.71 GY33
25 Oph-ISO 046 16 26 30.47 -24 22 57.10 16.31 12.55 9.98 6.3 -0.30 3.52 -0.57 -16.5I -3.37 -0.58 -7.24 VSSG27/GY51
26 Oph-ISO 051 16 26 36.83 -24 15 51.90 12.66 10.83 9.59 2.1 -0.61 3.48 -0.75 -0.4 S-5.27 -3.16 -9.71 B162636-241554
27 Oph-ISO 052 16 26 37.79 -24 23 0.70 15.74 12.91 11.11 4.5 -0.86 3.46 -0.90 -5.9 I -4.32 -1.88 -8.36 VSSG4/GY81
28 Oph-ISO 053 16 26 38.60 -24 23 10.00 15.29 12.89 11.63 4.2 -0.84 3.46 -0.89 -0.3I -5.59 -3.61 -10.09 GY84
29 Oph-ISO 056 16 26 41.26 -24 40 18.00 10.77 9.77 9.27 0.8 -0.40 3.51 -0.63 -0.5S -4.98 -2.77 -9.39 WSB37/GY93
30 Oph-ISO 062 16 26 42.86 -24 20 29.90 10.50 8.77 7.88 2.5 0.53 3.63 -0.07 -1.4 S -3.68 -1.01 -7.98 GSS37/GY110
31 Oph-ISO 063 16 26 42.89 -24 22 59.10 15.33 12.82 11.44 4.3 -0.80 3.46 -0.87 -0.3I -5.50 -3.47 -9.96 GY109
32 Oph-ISO 067 16 26 45.03 -24 23 7.70 13.25 10.60 8.96 4.2 0.09 3.57 -0.33 -10.0S -3.23 -0.40 -7.20 GSS39/GY116
33 Oph-ISO 068+ 16 26 46.43 -24 12 0.10 9.68 8.31 7.49 1.4 0.37 3.61 -0.17 -0.6 S -4.19 -1.70 -8.61 VSS27
34 Oph-ISO 072+ 16 26 48.98 -24 38 25.20 13.50 11.44 9.98 2.5 -0.81 3.46 -0.87 -36.0 S -3.49 -0.74 -7.23 WL18/GY129
35 Oph-ISO 078 16 26 54.44 -24 26 20.70 14.70 11.69 10.01 5.5 0.02 3.57 -0.37 -0.4I -4.69 -2.37 -9.16 VSSG5/GY153
36 Oph-ISO 079 16 26 54.77 -24 27 2.20 0.00 14.87 12.87 6.0 -1.24 3.44 -1.13 -3.0I – – – GY154
37 Oph-ISO 083 16 26 56.66 -24 13 53.80 12.26 10.31 9.25 3.0 -0.06 3.56 -0.42 -4.5S -3.71 -1.04 -7.79 B162656-241353
38 Oph-ISO 084 16 26 57.33 -24 35 38.80 0.00 15.09 12.81 7.1 -0.99 3.45 -0.98 -5.0I – – – WL21/GY164
39 Oph-ISO 086 16 26 58.40 -24 21 30.00 16.01 13.11 11.46 5.1 -0.72 3.47 -0.82 -0.8S -5.06 -2.88 -9.39 IRS26/GY171
40 Oph-ISO 087 16 26 58.64 -24 18 34.70 15.45 13.01 11.48 3.7 -1.09 3.45 -1.04 -2.4 I -4.92 -2.69 -9.13 B162658-241836
41 Oph-ISO 088a 16 26 58.51 -24 45 36.90 9.75 8.16 7.06 1.5 0.40 3.62 -0.14 -10.5S -2.92 0.03 -6.90 SR24N/GY168
42 Oph-ISO 088b 16 26 58.44 -24 45 31.90 10.37 8.63 7.55 2.1 0.39 3.62 -0.15 -7.0S -3.11 -0.23 -7.15 SR24S/GY167
43 Oph-ISO 089 16 26 59.05 -24 35 56.90 16.05 13.35 11.82 4.7 -0.93 3.46 -0.94 -0.5I -5.45 -3.42 -9.88 WL14/GY172
44 Oph-ISO 092 16 27 2.34 -24 37 27.20 14.16 10.48 8.06 6.3 0.66 3.65 0.01 -8.4 S -2.79 0.21 -6.80 WL16/GY182
45 Oph-ISO 093 16 27 3.01 -24 26 14.70 0.00 15.65 12.56 10.6 -0.24 3.53 -0.53 -20.0S – – – GY188
46 Oph-ISO 094 16 27 3.59 -24 20 5.40 17.24 14.91 13.56 3.7 -1.90 3.41 -1.53 -5.0 I -5.34 -3.27 -9.55 B162703-242007
47 Oph-ISO 095 16 27 4.11 -24 28 29.90 16.90 13.09 10.86 7.2 -0.15 3.54 -0.48 -0.6I -4.67 -2.35 -9.06 WL1/GY192
48 Oph-ISO 098 16 27 4.57 -24 27 15.70 16.48 13.03 11.22 6.8 -0.17 3.54 -0.49 -0.7I -4.62 -2.29 -9.00 GY195
49 Oph-ISO 102 16 27 6.60 -24 41 48.80 12.43 11.40 10.77 0.6 -1.22 3.44 -1.12 -2.0 I -5.12 -2.96 -9.37 GY204
50 Oph-ISO 103 16 27 6.78 -24 38 15.00 0.00 14.30 10.97 11.6 0.71 3.66 0.04 -0.6I – – – WL17/GY205
51 Oph-ISO 105 16 27 9.10 -24 34 8.10 12.55 10.19 8.91 4.0 0.29 3.60 -0.21 -1.7 I -3.82 -1.19 -8.07 WL10/GY211
52 Oph-ISO 106 16 27 9.07 -24 12 0.80 12.41 10.73 9.80 2.3 -0.44 3.50 -0.65 -1.0S -4.71 -2.40 -9.01 B162708–241204
53 Oph-ISO 107 16 27 9.35 -24 40 22.40 0.00 13.55 11.30 7.0 -0.30 3.52 -0.56 -1.3I – – – GY213
54 Oph-ISO 110 16 27 10.28 -24 19 12.70 8.74 7.51 6.72 0.9 0.58 3.64 -0.04 -0.3I -4.30 -1.85 -8.84 SR21/VSSG23
55 Oph-ISO 112 16 27 11.18 -24 40 46.70 0.00 12.88 10.20 8.9 0.57 3.64 -0.04 -17.9 I – – – GY224
56 Oph-ISO 115 16 27 12.13 -24 34 49.10 15.62 13.11 11.49 3.7 -1.16 3.45 -1.08 -2.7 I -4.94 -2.71 -9.14 WL11/GY229
57 Oph-ISO 116 16 27 13.73 -24 18 16.90 12.26 10.25 9.29 3.4 0.15 3.58 -0.30 -1.0S -4.18 -1.68 -8.51 B162713-241818
58 Oph-ISO 117 16 27 13.82 -24 43 31.70 13.32 11.23 9.98 3.1 -0.47 3.50 -0.67 -2.4 S -4.36 -1.92 -8.52 GY235
59 Oph-ISO 118 16 27 14.51 -24 26 46.10 0.00 15.34 12.26 10.5 -0.11 3.55 -0.45 -20.0I – – – IRS33/GY236
60 Oph-ISO 120 16 27 15.45 -24 26 39.80 17.42 13.46 10.79 6.8 -0.57 3.49 -0.73 -2.5 I-4.43 -2.02 -8.59 IRS34/GY239
61 Oph-ISO 121a 16 27 15.88 -24 38 43.40 13.89 11.26 9.59 4.1 -0.25 3.53 -0.53 -0.6 S-4.76 -2.47 -9.15 WL20/GY240A
62 Oph-ISO 121b 16 27 15.70 -24 38 43.40 13.57 10.87 9.48 5.0 0.31 3.60 -0.20 -0.5S -4.33 -1.89 -8.78 WL20/GY240B
63 Oph-ISO 123 16 27 17.59 -24 5 13.70 12.73 11.49 10.73 1.0 -1.15 3.45 -1.08 -21.9I -4.02 -1.46 -7.89 ISO 1627176-240519
64 Oph-ISO 124 16 27 17.57 -24 28 56.30 0.00 14.42 11.58 9.5 0.03 3.57 -0.37 -10.0I – – – IRS37/GY244
65 Oph-ISO 128 16 27 18.49 -24 29 5.90 14.61 11.50 9.68 5.5 0.08 3.57 -0.34 -0.4S -4.63 -2.30 -9.10 WL4/GY247
66 Oph-ISO 129 16 27 19.22 -24 28 43.90 0.00 14.66 11.49 10.9 0.33 3.61 -0.19 -30.0I – – – WL3/GY249
67 Oph-ISO 132 16 27 21.47 -24 41 43.10 15.22 11.25 8.48 6.6 0.32 3.61 -0.19 -0.9S -4.06 -1.52 -8.42 IRS42/GY252
68 Oph-ISO 138 16 27 26.22 -24 19 23.00 16.40 14.24 12.93 3.1 -1.79 3.42 -1.46 -1.0I -5.94 -4.07 -10.38 B162726-241925
69 Oph-ISO 140 16 27 26.49 -24 39 23.10 15.69 12.07 9.95 6.7 0.16 3.58 -0.29 -3.7 S -3.60 -0.89 -7.72 GY262
70 Oph-ISO 142 16 27 27.38 -24 31 16.60 12.35 10.38 9.32 3.0 -0.07 3.55 -0.43 -0.5S -4.67 -2.35 -9.10 VSSG25/GY267
71 Oph-ISO 144 16 27 28.45 -24 27 21.00 15.74 12.31 10.10 5.8 -0.26 3.53 -0.54 -1.4I -4.40 -1.98 -8.66 IRS45/GY273
72 Oph-ISO 147 16 27 30.18 -24 27 43.40 15.32 11.52 9.02 6.6 0.27 3.60 -0.22 -0.5S -4.36 -1.93 -8.81 IRS47/GY279
73 Oph-ISO 151 16 27 30.84 -24 24 56.00 12.70 10.95 10.07 2.6 -0.40 3.51 -0.62 -0.5S -4.97 -2.76 -9.39 GY284
74 Oph-ISO 154 16 27 32.85 -24 32 34.80 16.19 12.74 10.96 6.9 -0.01 3.56 -0.39 -1.0S -4.32 -1.88 -8.65 GY291
75 Oph-ISO 155 16 27 33.11 -24 41 15.30 11.32 9.13 7.81 3.2 0.49 3.63 -0.09 -4.0 S -3.26 -0.43 -7.39 GY292
76 Oph-ISO 160 16 27 37.42 -24 17 54.90 14.15 12.76 11.95 1.5 -1.57 3.43 -1.33 -3.3I -5.22 -3.09 -9.44 B162737-241756
77 Oph-ISO 163 16 27 38.32 -24 36 58.60 11.38 9.43 8.27 2.7 0.23 3.59 -0.25 -2.0 S -3.80 -1.16 -8.02 IRS49/GY308
78 Oph-ISO 164 16 27 38.63 -24 38 39.20 13.27 11.93 11.08 1.2 -1.31 3.44 -1.17 -0.8I -5.60 -3.61 -10.01 GY310
79 Oph-ISO 165 16 27 38.94 -24 40 20.70 16.54 13.91 12.29 4.2 -1.35 3.44 -1.20 -9.6I -4.56 -2.20 -8.58 GY312
80 Oph-ISO 166 16 27 39.43 -24 39 15.50 10.75 9.21 8.46 2.2 0.24 3.59 -0.25 -3.3 I -3.58 -0.87 -7.73 GY314
81 Oph-ISO 168 16 27 40.29 -24 22 4.00 8.44 7.67 7.21 0.0 0.28 3.60 -0.22 -1.3S -3.96 -1.38 -8.26 SR9/GY319/IRS52
82 Oph-ISO 170 16 27 41.61 -24 46 44.70 17.20 15.33 13.55 1.0 -3.07 3.36 -2.23 -3.0I -6.63 -5.01 -11.07 B162741-244645
83 Oph-ISO 171 16 27 41.75 -24 43 36.10 0.00 14.88 12.29 8.5 -0.50 3.50 -0.68 -4.0I – – – GY323
84 Oph-ISO 172 16 27 42.70 -24 38 50.60 13.24 11.44 10.54 2.8 -0.56 3.49 -0.72 -1.0S -4.82 -2.56 -9.12 GY326
85 Oph-ISO 175 16 27 45.79 -24 44 53.90 17.38 14.54 12.46 4.0 -1.82 3.42 -1.48 -15.7 I -4.77 -2.49 -8.79 GY344
86 Oph-ISO 176 16 27 46.29 -24 31 41.20 13.83 12.21 11.32 2.2 -1.11 3.45 -1.05 -0.5I -5.62 -3.64 -10.08 GY350
87 Oph-ISO 177 16 27 47.09 -24 45 35.10 15.75 12.81 11.13 5.2 -0.55 3.49 -0.72 -0.4I -5.21 -3.09 -9.66 GY352
88 Oph-ISO 178 16 27 49.78 -24 25 22.00 12.78 11.12 10.16 2.2 -0.65 3.48 -0.77 -2.0S -4.60 -2.25 -8.78 GY371
89 Oph-ISO 185 16 27 55.25 -24 28 39.60 13.04 11.59 10.79 1.7 -0.98 3.45 -0.97 -0.2I -5.90 -4.03 -10.48 GY397
90 Oph-ISO 187 16 27 55.58 -24 26 17.90 10.14 9.33 8.90 0.2 -0.39 3.51 -0.62 -5.6S -3.91 -1.32 -7.95 SR10/GY400
91 Oph-ISO 190 16 28 3.56 -24 34 38.60 0.00 15.24 13.20 6.1 -1.37 3.44 -1.21 -5.0I – – – GY450
92 Oph-ISO 193 16 28 12.72 -24 11 35.60 13.61 12.02 11.09 1.9 -1.11 3.45 -1.05 -1.8 I -5.07 -2.89 -9.32 B162812-241138
93 Oph-ISO 194 16 28 13.79 -24 32 49.40 12.35 10.89 10.10 1.8 -0.64 3.48 -0.77 -0.5S -5.19 -3.06 -9.60 B162813-243249
94 Oph-ISO 195 16 28 16.73 -24 5 14.30 10.98 9.57 8.86 1.8 -0.04 3.56 -0.41 -0.8 S -4.44 -2.03 -8.79 ISO 1628168-240519
95 Oph-ISO 196 16 28 16.51 -24 36 58.00 11.31 10.08 9.32 0.9 -0.55 3.49 -0.72 -3.2S -4.31 -1.86 -8.43 WSB60/B162816-243657
96 Oph-ISO 199 16 28 45.60 -24 28 19.00 9.21 8.41 8.00 0.2 0.02 3.57 -0.38 -1.7 S -4.06 -1.53 -8.31 SR13
# Object Coordinates J H K AJ Lg L∗ Lg Teff Lg M∗ EW (Brγ) Inst.L(Brγ) Lacc Other
(ISO#) (J2000.0) (mag) (mag) (L⊙) (K) (M⊙) (Å) (L⊙) (L⊙) (M⊙/y) Names
97 Oph-ISO 059 16 26 31.04 -24 31 5.20 14.96 12.32 10.86 4.6 -0.49 3.50 -0.68 -0.6 S-4.06 -1.54 -8.13 WL7/GY98
98 Oph-ISO 070+ 16 27 41.61 -24 46 44.70 17.20 15.33 13.55 1.0 -3.07 3.36 -2.23 -1.2S -4.06 -3.06 -9.12 WL2/GY128
99 Oph-ISO 075 16 26 51.97 -24 30 39.50 0.00 16.52 13.46 10.4 -0.69 3.47 -0.80 -3.9S -4.06 -0.40 -6.92 GY144
100 Oph-ISO 076 16 26 53.47 -24 32 36.20 0.00 16.24 13.12 10.7 -0.48 3.50 -0.67 -3.0S -4.06 -0.32 -6.92 GY146
101 Oph-ISO 085 16 26 58.28 -24 37 41.00 0.00 0.00 14.41 -1.0 -0.48 3.50 -0.67 -8.0S – – – CRBR51
102 Oph-ISO 093 16 26 31.04 -24 31 5.20 0.00 15.65 12.56 10.6 -0.24 3.53 -0.53 -0.7S -4.06 -0.73 -7.41 GY188
103 Oph-ISO 108 16 27 9.43 -24 37 18.80 16.79 11.05 7.14 10.5 1.44 3.76 0.48 -1.3 S -4.06 1.46 -5.84 EL29/GY214
104 Oph-ISO 139 16 27 26.29 -24 42 46.10 0.00 15.18 12.66 8.2 -0.73 3.46 -0.82 -2.8S -4.06 -0.77 -7.27 GY260
105 Oph-ISO 161 16 27 37.25 -24 42 38.00 0.00 14.52 11.46 10.5 0.27 3.60 -0.22 -0.8 S-4.06 -0.30 -7.17 GY301
[x]clccccccccccccccl
Class III Objects
(1) (2) (3) (4) (5) (6) (7) (8) (9) (10) (11) (12) (13) (14) (15) (16) (17)
# Object Coordinates J H K AJ Lg L∗ Lg Teff Lg M∗ EW (Paβ) Inst.L(Paβ) Lacc Other
(ISO#) (J2000.0) (mag) (mag) (L⊙) (K) (M⊙) (Å) (L⊙) (L⊙) (M⊙/y) Names
\endfirstheadcontinued.
\endhead\endfoot
1 Oph-ISO 005 16 25 50.53 -24 39 14.50 9.98 8.82 8.33 1.4 0.21 3.59 -0.26 -0.5S -4.42 -2.01 -8.86 IRS10
2 Oph-ISO 011 16 26 3.29 -24 17 46.50 10.67 9.58 9.12 1.2 -0.18 3.54 -0.49 -0.8 I -4.57 -2.22 -8.92 VSSG19
3 Oph-ISO 014 16 26 7.64 -24 27 41.40 14.68 11.85 10.41 5.4 -0.03 3.56 -0.40 -0.5S -4.64 -2.31 -9.07 B162607-242742
4 Oph-ISO 016 16 26 9.31 -24 34 12.10 7.74 6.95 6.50 – – – – +5.7S – – – SR3
5 Oph-ISO 018 16 26 15.81 -24 19 22.10 14.03 11.40 10.03 4.8 -0.02 3.56 -0.40 -0.5S -4.63 -2.29 -9.06 SKS1-7
6 Oph-ISO 028 16 26 21.02 -24 15 41.50 12.78 10.38 9.27 4.5 0.41 3.62 -0.14 -0.6S -4.16 -1.66 -8.58 B162621-241544
7 Oph-ISO 044 16 26 28.48 -24 15 41.20 15.31 12.37 10.78 5.4 -0.29 3.52 -0.56 -0.7S -4.73 -2.43 -9.09 B162628-241543
8 Oph-ISO 064 16 26 43.76 -24 16 33.30 12.98 10.76 9.60 3.8 0.00 3.56 -0.38 -0.7S -4.46 -2.07 -8.84 VSSG11
9 Oph-ISO 066 16 26 44.30 -24 43 18.00 10.99 10.02 9.57 0.7 -0.51 3.49 -0.69 -0.8 S -4.87 -2.62 -9.20 GY112
10 Oph-ISO 069 16 26 47.05 -24 44 29.90 12.33 11.12 10.56 1.3 -0.83 3.46 -0.89 -0.4S -5.47 -3.44 -9.92 GY122
11 Oph-ISO 073 16 26 49.23 -24 20 2.90 12.20 9.85 8.69 4.2 0.53 3.63 -0.07 -0.4 S -4.23 -1.75 -8.72 VSSG3
12 Oph-ISO 074 16 26 51.12 -24 20 50.50 13.81 11.48 10.21 – – – – +1.5S – – – IRS20/GY143
13 Oph-ISO 082 16 26 56.92 -24 28 37.10 17.46 14.75 12.81 3.8 -1.94 3.41 -1.55 -2.0I -5.77 -3.85 -10.12 GY163
14 Oph-ISO 091 16 27 1.62 -24 21 37.00 14.25 11.07 9.39 6.1 0.49 3.63 -0.09 +0.9S – – – VSSG8/GY181
15 Oph-ISO 113 16 27 11.68 -24 23 42.00 14.21 11.62 10.11 – – – – +4.0S – – – IRS32/GY228
16 Oph-ISO 114 16 27 11.71 -24 38 32.10 0.00 15.06 11.06 16.2 1.71 3.79 0.64 -8.0I – – – WL19/GY227
17 Oph-ISO 135 16 27 22.91 -24 17 57.40 13.33 10.76 9.45 – – – – +1.3S – – – WSSG22
18 Oph-ISO 148 16 27 31.06 -24 34 3.20 13.43 11.36 10.39 3.6 -0.27 3.53 -0.55 -0.5S -4.86 -2.61 -9.28 GY283
19 Oph-ISO 152+ 16 27 32.68 -24 33 23.90 16.15 12.74 10.90 6.6 -0.10 3.55 -0.45 -2.0S -4.10 -1.58 -8.31 GY289
20 Oph-ISO 156 16 27 35.26 -24 38 33.40 11.28 10.23 9.67 0.8 -0.62 3.48 -0.76 -0.4S -5.27 -3.17 -9.71 GY295
21 Oph-ISO 158 16 27 36.52 -24 28 33.30 11.99 11.38 11.15 0.0 -1.29 3.44 -1.16 -1.0S -5.48 -3.46 -9.86 GY297
22 Oph-ISO 169a 16 27 41.49 -24 35 37.70 14.30 11.83 10.56 4.4 -0.30 3.52 -0.57 +0.7 S – – – GY322
23 Oph-ISO 169b 16 27 41.64 -24 35 41.10 14.74 12.48 11.26 3.8 -0.78 3.46 -0.85 -0.9S -5.06 -2.89 -9.38 GY322
24 Oph-ISO 180 16 27 49.87 -24 25 40.20 9.44 8.12 7.30 – – – – +6.3 S – – – VSSG14/GY372
25 Oph-ISO 181 16 27 50.51 -24 39 3.10 14.47 12.74 11.85 – – – – +5.5S – – – GY373
26 Oph-ISO 183 16 27 51.92 -24 46 29.60 14.05 11.61 10.37 4.3 -0.22 3.53 -0.52 -0.7 S -4.66 -2.34 -9.03 GY377
27 Oph-ISO 186 16 27 55.65 -24 44 50.90 12.34 11.15 10.47 1.0 -0.98 3.45 -0.97 -1.5 S -5.03 -2.84 -9.29 GY398
28 Oph-ISO 189 16 27 57.87 -24 36 2.20 15.37 12.98 11.83 4.4 -0.79 3.46 -0.86 -1.5 S -4.86 -2.61 -9.10 GY412
29 Oph-ISO 192 16 28 5.78 -24 33 55.00 16.75 14.00 12.56 5.1 -1.08 3.45 -1.04 -2.0 I -4.99 -2.79 -9.23 GY472
30 Oph-ISO 197 16 28 21.71 -24 42 47.10 16.83 14.03 12.44 4.9 -1.18 3.45 -1.10 -1.0 I -5.39 -3.32 -9.74 B162821-244246
31 Oph-ISO 198 16 28 32.66 -24 22 44.90 8.73 7.48 6.85 1.3 0.76 3.67 0.07 -0.4 S -4.02 -1.47 -8.52 SR20
# Object Coordinates J H K AJ Lg L∗ Lg Teff Lg M∗ EW (Brγ) Inst.L(Brγ) Lacc Other
(ISO#) (J2000.0) (mag) (mag) (L⊙) (K) (M⊙) (Å) (L⊙) (L⊙) (M⊙/y) Names
32 Oph-ISO 047 16 26 31.04 -24 31 5.20 14.96 12.32 10.86 4.6 -0.49 3.50 -0.68 -1.0S -4.71 -1.34 -7.93 IRS14/GY54
33 Oph-ISO 113 16 27 11.68 -24 23 42.00 14.21 11.62 10.11 – – – – +5.6S – – – IRS32/GY228
34 Oph-ISO 157 16 27 35.67 -24 45 32.62 12.71 11.47 10.88 1.4 -0.95 3.46 -0.96 -1.0 S -5.54 -2.08 -8.54 GY296
35 Oph-ISO 179 16 27 49.97 -24 44 17.00 13.85 11.97 10.94 2.8 -0.84 3.46 -0.89 -0.7 S -5.37 -1.94 -8.42 GY370
Caption of Tables Accretion in the -Oph pre-main sequence stars
††thanks:
Based on observations collected at the European Southern Observatory, Chile. Program 073.C-0179. and Accretion in the -Oph pre-main sequence stars
††thanks:
Based on observations collected at the European Southern Observatory, Chile. Program 073.C-0179..
Column 1: running number;
Column 2: ISOCAM number from BKA01;
a + sign marks objects with a companion not resolved in the
2MASS photometry;
Column 3 and 4: J2000 coordinates
Column 5,6,7: 2MASS J, H, K photometry;
Column 8: J–band extinction;
Column 9,10,11: stellar luminosity, effective temperature and mass, determined as described in the text;
Column 12: line equivalent width: negative values for emission lines;
Column 13: instrument used in the observations: S=SOFI/NTT, I=ISAAC/UT1;
Column 14: line luminosity;
Column 15,16: accretion luminosity and mass accretion rate;
Column 17: other names.
| (1) | (2) | (3) | (4) | (5) | (6) | (7) | (8) |
|---|---|---|---|---|---|---|---|
| # | Object | Coordinates | Separation | EW | Line | Other | |
| (ISO#) | (J2000.0) | (arcsec) | (Å) | Names | |||
| 1 | Oph-ISO 002b | 16 25 38.12 | -24 22 36.30 | 1.8 | -1.0 | Paβ | B162538-242238 |
| 2 | Oph-ISO 068b | 16 26 46.43 | -24 12 0.10 | 3.6 | -0.3 | Paβ | VSS27 |
| 3 | Oph-ISO 070b | 16 27 41.61 | -24 46 44.70 | 4 | +2.5 | Brγ | WL2/GY128 |
| 4 | Oph-ISO 072b | 16 26 48.98 | -24 38 25.20 | 3.6 | -1.0 | Paβ | WL18/GY129 |
| 5 | Oph-ISO 152b | 16 27 32.68 | -24 33 23.90 | 3 | -4.0 | Paβ | GY289 |