ENERGETICS AND DYNAMICS OF AN IMPULSIVE FLARE ON MARCH 10, 2001
Abstract
We present the H observations from ARIES, Nainital of a compact and impulsive solar flare occurred on March 10, 2001 and associated with a CME. We have also analysed HXT, SXT/Yohkoh observations as well as radio observations from Nobeyama Radio Observatory to derive the energetics and dynamics of this impulsive flare. We co-align the H, SXR, HXR, MW and magnetogram images within the instrumental spatial resolution limit. We detect a single HXR source in this flare, which is found spatially associated with one of the H bright kernel. The unusual feature of HXR and H sources, observed for the first time, is the rotation during the impulsive phase in clockwise direction. We propose that the rotation may be due to asymmetric progress of the magnetic reconnection site or may be due to the change of peak point of the electric field. In MW emission we found two sources, one is main source which is at the main flare site and another is remote source located in South-West direction. It appears that the remote source is formed by the impact of accelerated energetic electrons from the main flare site. From the spatial co-relation of multi-wavelength images of the different sources we conclude that this flare has three-legged structure.
Appl. Opt.
Ramesh Chandra
Aryabhatt Research Institute of Observational Sciences
Manora Peak, Naini Tal263 129,
INDIA.
Phone: +91-05942-235583, 235136
Fax: +91-05942-235136
email: ramesh@upso.ernet.in
1 Introduction
H, microwave (MW), hard X-ray (HXR) and magnetogram observations are extremely important to understand the energetics and dynamics of the solar flares. The HXR are produced through electron ion bremsstrahlung. The MW emission is the gyro-synchrotron radiation caused by high energy electrons accelerated in the corona, while the H comes from the thermal plasma heated in the chromosphere by the precipitating electrons. Many studies based on H, HXR and MW observations (Marsh and Hurford, 1980; Kundu, Bobrowky, and Rust 1983; Gary and Hurford, 1990; Nishio, 1997; Hanaoka, 1996, 2000 and references therein) have focused on whether the locations of MW and HXR sources coincide with those of H kernels. During the impulsive phase of three flares (Marsh and Hurford, 1980) microwave emission was dominated by a compact source located between the H kernels. In the post impulsive phase, the MW source was larger and elongated in a direction consistent with the orientation of the magnetic field lines joining the H kernel (Marsh and Hurford, 1980). Nishio et al. (1997) analysed 14 impulsive solar flares to study the spatial correlation and suggested that in the majority of impulsive flare events two loops interact with each other, releasing magnetic energy and producing energetic electrons. Hanaoka (1996, 2000) studied spatial correlation of different energy emissions in many flares using H, Yohkoh HXT/SXT, MW and magnetogram data. In many cases he found that the magnetic field of the flare loops show a bipolar + remote unipolar structure, rather than a quadrapole structure.
A compact and impulsive flare associated with CME occurred on 10 March 2001 during the peak of Solar cycle 23 (Uddin , 2004, hereafter referred as paper I). This flare (1B/M6.7) occurred in NOAA AR 9368 (N27,W42) and was well observed by ARIES, Nainital, India, Yohkoh, SOHO missions and Nobeyama Radio Observatory, Japan. In paper I we studied the unusual behavior of the H morphology associated with the sigmoid shaped filament and mass motion that played a role in producing compact and impulsive flare, which was driven by CME. This flare was also studied earlier by Liu, Ding, and Fang (2001), St. Cyr , (2001) and Ding , (2003). This flare is identified as an electron-rich event in the energetic particle events of the IMP 8 data for cycle 23 (St. Cyr et al., 2001). This flare also showed enhanced emission at continuum near the Ca II 8542 A line. This emission lasted about 30 s, showing a good time correlation with the peak of microwave radio flux at 7.58 GHz and thereby was classified as type I white light flare (St. Cyr , 2001; Liu, Ding, and Fang (2001) and Ding , 2003).
In order to study the energy build-up, energy release and particle acceleration the simultaneous multi-wavelength observations of a flare are recently analyzed by many investigators (Gary and Hurford, 1990; White , 1992; Rolli, Wulser, and Magun, 1998; Jain , 1983; Kundu and White, 2001; Joshi, Chandra, and Uddin, 2003). Multi-wavelength observations of bursts at millimeter and microwave frequencies were analysed by White , 1992 and Lin , (1992). Based on the similarity of the time profiles of MW and HXR emission special attention was paid (Kundu, 1961, Crannell 1991) to understand the flare evolution processes in these two wavebands. However, in order to understand the principal mechanisms of energy release in these two wavebands as well as in H it is rather more important to establish the spatial relationship of the energy sources in these wavebands. Nevertheless, this requires high spatial resolution in both wavelength regimes (Kundu , 1989 and Nitta , 1991). On the other hand spectral information is also crucial to determine the mechanisms that operate for the X-ray and radio emissions. Therefore, the main purpose of this investigation is to study the spatial correlation of the energy release sources in H, MW, SXR and HXR emission by overlaying the images obtained in these wavelengths. Simultaneously we also study the temporal and spectral observations in these wavebands to understand the energetics and dynamics of the flare sources.
In preview to above goals we carried out the detailed study of the 10 March 2001 flare. In section 2, we present the observations, while in section 3 data analysis and results are presented. We discuss our result in section 4 and conclude in section 5.
2 Observations
We used following observational data set for the current investigation:
1. The H observations were made at Aryabhatta Research Institute of Observational Sciences (ARIES), Nainital using 15 cm f/15 Coude telescope and Lyot filter centered at H line. The image size was enlarged by a factor of 2 using Barlow lens. The H images were recorded by a 16-bit 385 576 pixels CCD camera of Wright Instruments having a pixel of 22 micron2. The resolution of the image is 1 arcsec per pixel.
2. Soft X-ray data from SXT onboard Yohkoh (Tsuneta , 1991). The SXT provides soft X-ray images with a resolution of 2.5 arcsec per pixel and temporal resolution of 2 sec during the flare.
3. Hard X-ray data from HXT onboard Yohkoh, which is a Fourier synthesis type telescope (Kosugi , 1991). HXT provides observations in four energy bands i.e. L (14-23 keV), M1(23-33 keV), M2 (33-53 keV) and H (53-93 keV). Its angular and temporal resolution are 5 arcsec and 0.5 sec respectively during the flare.
4. Magnetograms from full disk Michelson Doppler Imager (MDI) onboard SOHO mission. MDI takes full disk magnetogram on a 1024 X 1024 CCD array with a spatial resolution of 2 arcsec per pixel (Scherrer , 1995), and temporal resolution of 90 minute.
5. The radio data from Nobeyama Radioheliograph (Nakajima , 1994; Takano , 1997). The Radioheliograph has angular resolution of 10 arcsec and 5 arcsec at 17 and 34 GHz respectively.
To understand the spatial relationship between different sources in this investigation we co-align the SXR, HXR and MW data with the H data. The co-alignment of SXR, HXR and MW data were achieved by referring to relative position from the solar disk center of each field of view. As for the H observations, we needed to get such a position information through the comparison between them and white light images from SOHO/MDI of same observation time. The accuracy of this co-alignment are better than 5 arcsec.
All the data analysis has been done by the Solarsoft and IRAF software tools.
3 Analysis and Results
3.1 H OBSERVATIONS
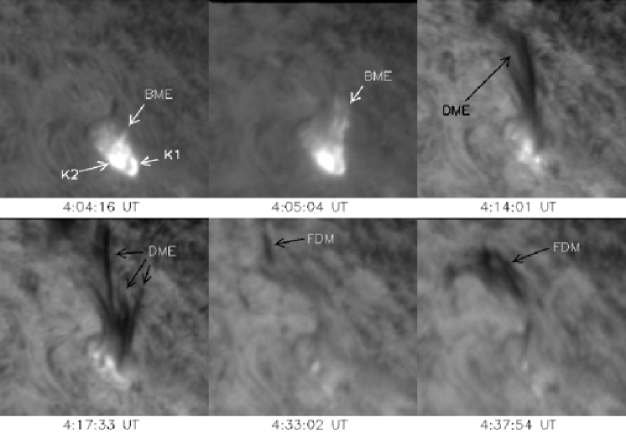
In Figure 1 we show the sequence of H filtergrams that indicate the evolution of the flare and bright and dark mass ejections associated with the flare activity. We noticed considerable pre-flare activity in the filament such as twisting motion and perhaps rising up as shown earlier by Singh and Gupta (1995) and recently by Sterling et al (2001), pre flare plage brightening as discussed earlier by Jain (1983) and Priest (1984). The pre-flare brightening started around 03:39:35 UT.
The disruption of the H filament channel, which is connected to the sigmoid filament was noticed between 03:54:06 - 03:54:51 UT in the following part of the active region. The filament channels are the primary consistents of a chromospheric coronal environment in which the filaments are supported by magnetic fields and a single filament channel may survive successive eruptions and reformation of its filament (Gaizauskas et al. 1997; Gaizauskas, Mackay, and Harvey, 2001).
The MDI magnetograms and H observations of the active region showed that the positive parasitic polarity emerged near the following sunspot, where the flare occurred (paper I). The flare started around 04:01:11 UT as a two small bright kernels K1 and K2 (cf. Figure 1). The intensity of both kernels rapidly increased. However, the kernels were confined in small area and the flare was compact but impulsive as discussed in paper I.
Figure 2 illustrate the evolution of flare during the impulsive phase. Inspection of these H contours of the flare we noticed that the H source is rotating in the clockwise direction as we have seen in HXR data (c.f. subsection 3.3). The rotation in the source is very interesting feature of this flare.
During the peak phase around 04:04:16 UT bright material ejected, which we call as bright mass ejecta (BME). We estimated the initial velocity of BME 600 km sec-1 when it started from North-West direction of the flare location. Around 04:06:27 UT the BME was followed by dark mass ejecta (DME), which, however, was moving with a slower speed of about 400 km sec-1 in the early stage and then speed decayed exponentially very fast. Apparently, the whole flare material erupted away as bright and dark mass ejections. Almost after the decay phase of the flare some dark matter was seen in the form of dark loops like filamentary system, which we call Filamentry Dark Material (FDM) in North-East direction of the flare site. This FDM was perhaps formed due to condensation of the ejected material having speed less than escape velocity. The detailed discussions about BME, DME and their association with CME have been given in paper I.

3.2 SPATIAL CORRELATION OF H, SXR, HXR AND MW SOURCES
In this section we present H images overlaid by contours of SXT/AlMg images, HXT images (L and H band), 17 GHz MW images (I and V) and 34 GHz at different phases of the flare to study the spatial correlation of the energy sources that emitting at different wavebands.
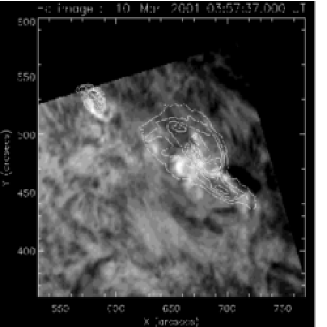
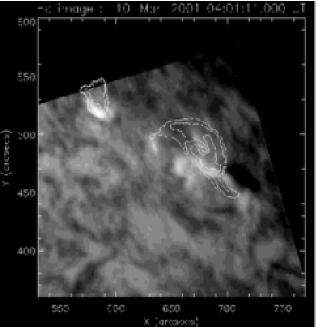

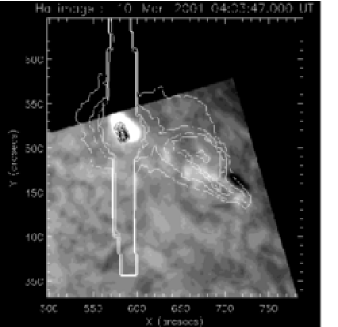
Figure 3 shows SXT/AlMg images (contours) overlaid on the H images (grey scale) within instrumental spatial resolution limit at 03:57:37 UT (about 3 minute before the flare onset) and at 04:01:11 UT (near the flare onset) respectively. In the precursor phase there was plage brightening near the leading spot group as well as at the flare location. It may be noted that the bright SXR sources (contours) were also present on both locations before flare (cf, Figure 3, left) in consistent to H morphology described in former section 3.1 and discovered earlier by Jain (1983). The H image taken at the onset of the flare at 04:01:11 UT (cf, Figure 3, right) showed enhanced emission in H as well as in SXR (contours) in the following spots of the active region. This overlaid plot suggests that SXR brightening is above the H brightening in the coronal loops and they are very extended sources while H sources are very compact as observed by us.
We show in Figure 4 (left and right) overplots of H, SXR (white contours) and HXR (L and H band - black contours) at 04:03:47 UT during impulsive phase of the flare. This Figure shows unambiguously that HXR sources (both L and H bands) are compact with respect to SXR source and their positions coincide with the H flare emission sources (kernels K1 and K2).
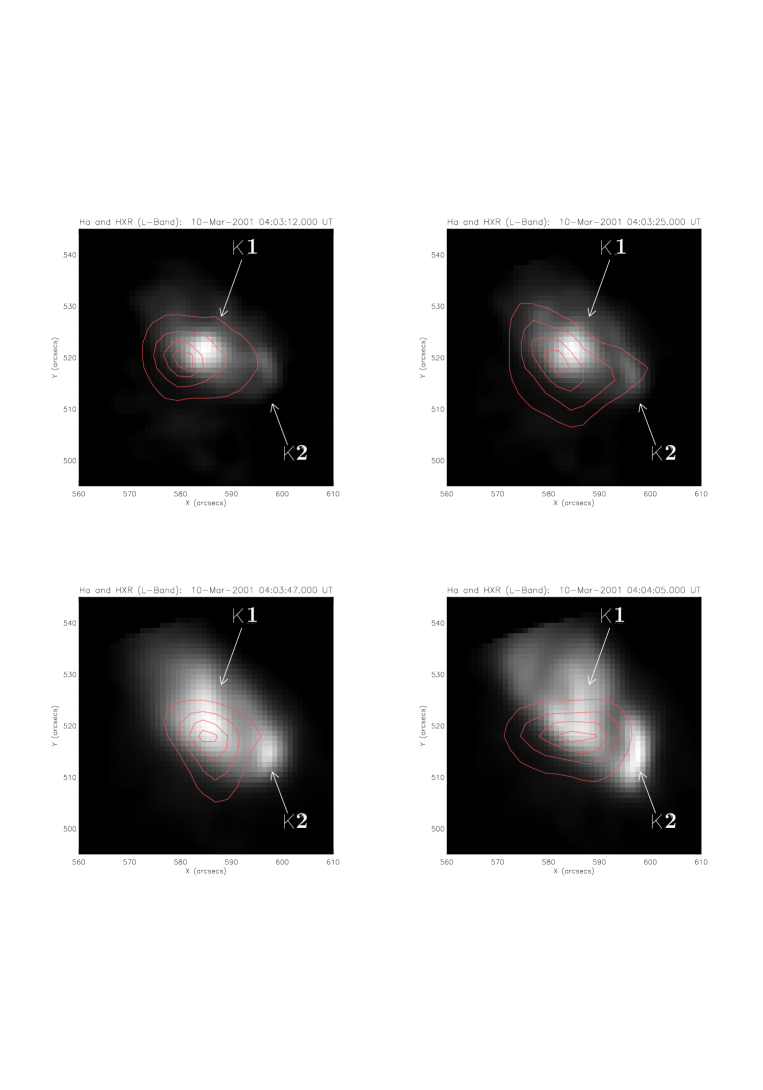
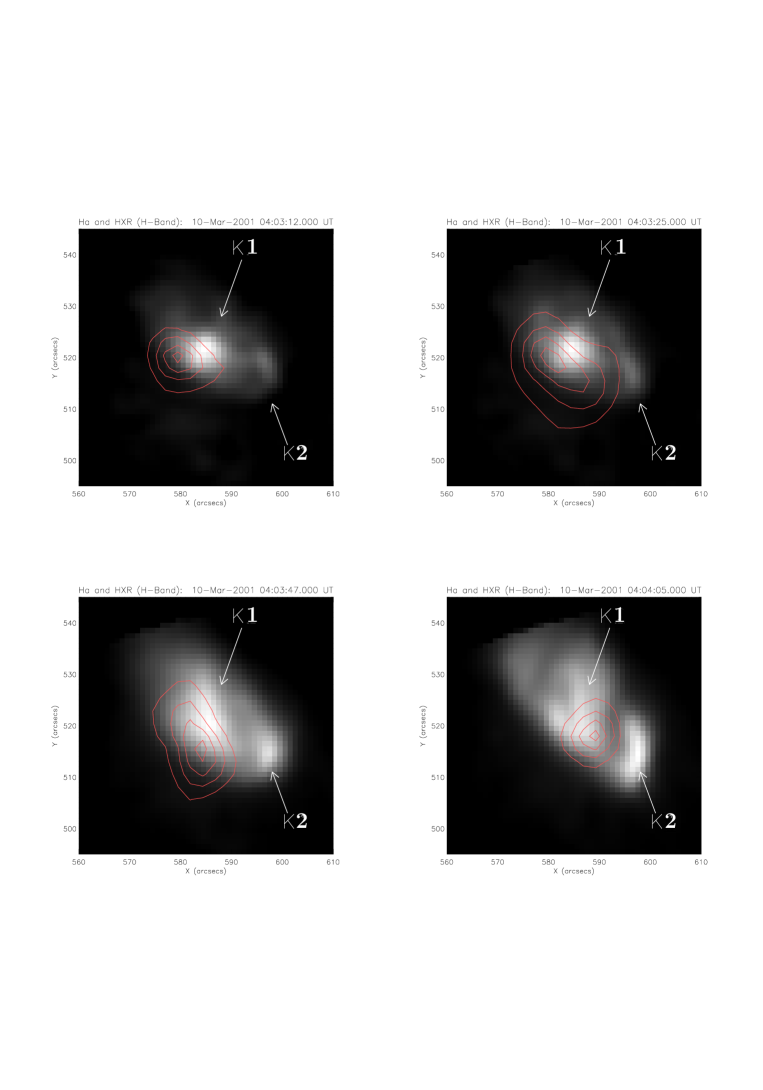
In order to understand better spatial correlationship of H, HXR and MW sources we selected smaller area 5050 arcsec squire of the flaring region to overlaid HXT (L and H) and MW (I and V) images on H flare images. These overlaid images showed spatial correlation more precisely. The overlaid images (contours) of HXT L and H band on H image (gray scale) have been shown in Figure 5, 6 and 7. The overlaid HXT L and H band images on H at 04:03:12 UT, 04:03:25 UT, 04:03:47 UT and 04:04:05 UT showed temporal evolution of the spatially correlated energy release sources in these two wavebands.
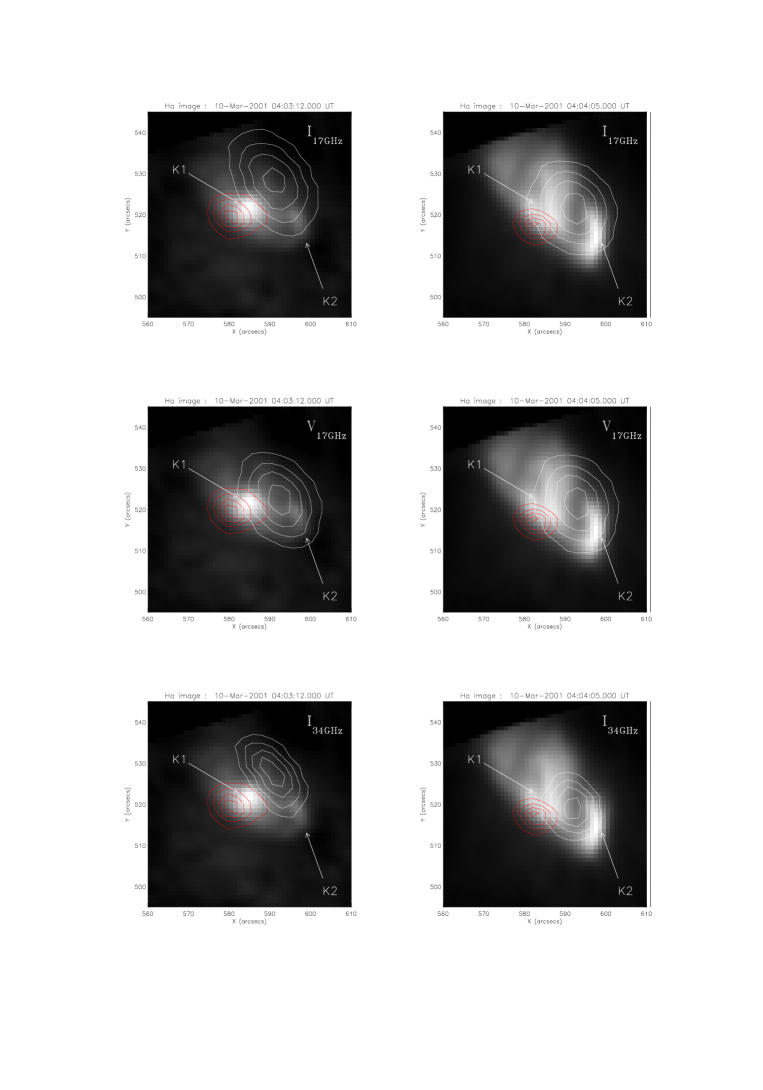
In Figure 7 at 04:03:12 and 04:04:05 UT we have plotted HXT L band image (red contour) and 17 GHz MW I and V sources (white contours) on the H images (gray scales). In this Figure we also present the overlaid images of H (gray scales), HXR L band image (red contour) and 34 GHz I image (white contours). In 34 GHz we have better spatial resolution than 17 GHz. The 17 GHz (V) sources in middle panel of Figure 7 were almost located at the same positions. This indicate that there is no significant change in the coronal magnetic polarities.
Our above co-alignment study revealed that compact single HXR source was laid above the H K1 kernel, while the MW source was between the kernel K1 and K2. These sources were very close to each other. The estimated distances between center to center of HXT L band and 17 GHz I sources was 15 arcsec and on the other hand HXT L band and 17 GHz V was 12 arcsec. The distance between the 34 GHz and HXR L band sources was 15 arcsec. The position difference between the MW and HXR sources are may be due to the possibility of projection effects, since different emission sources may come from different height of solar atmosphere. Thus our analysis showed that HXR and MW sources are almost co-align to each other (cf. Figure 7). On the other hand the HXR source was very close to H kernel K1. The above scenario indicates that the energy release site was in the low lying loops and therefore the emission originated from the lower lying loops.
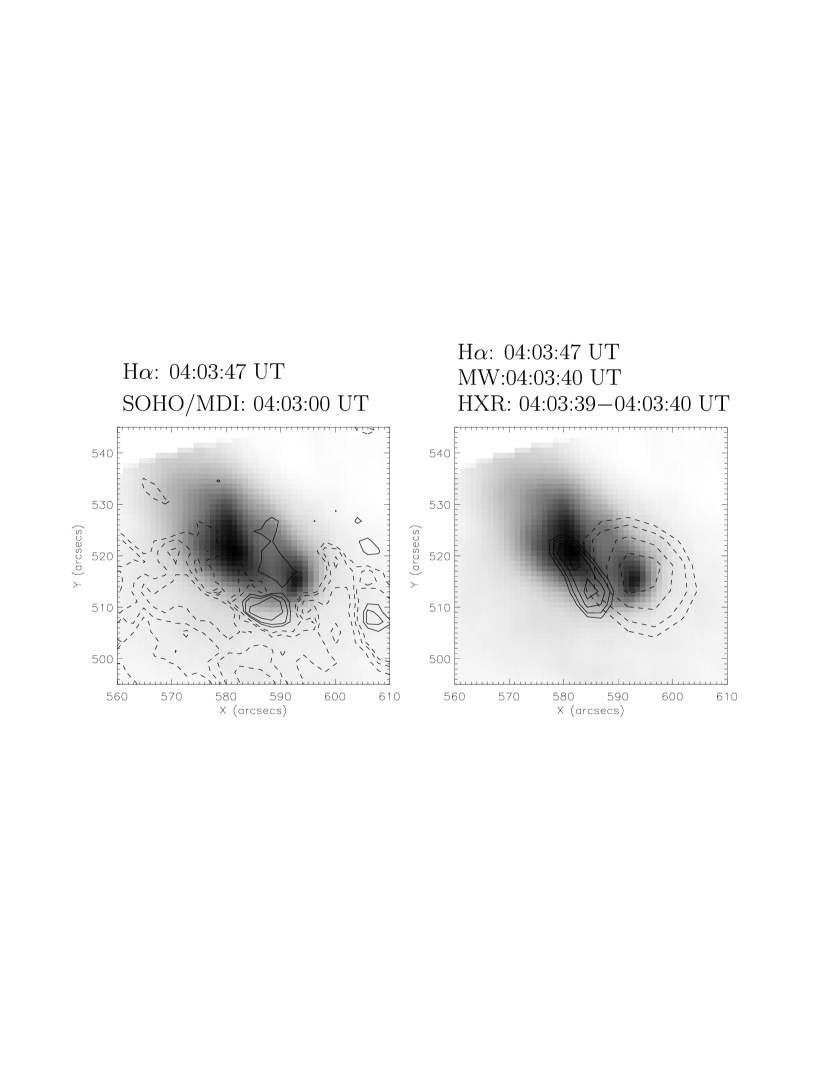
Figure 8 (left) represents the overlaid images of MDI magnetograms contours (solid line N polarity and dotted line S polarity) on H (gray scale). On the other hand, in the right panel we show H image overlaid by image of HXR H band (solid line) and MW 17 GHz (dotted contour). This Figure revealed that this flare has very compact sources in H, HXR and MW emission and they are almost co-aligned. From this Figure it is further clear that magnetic field at the flare location is very complex, viz. the emerging flux of N polarity penetrated into the S polarity, which might have triggered the flare.

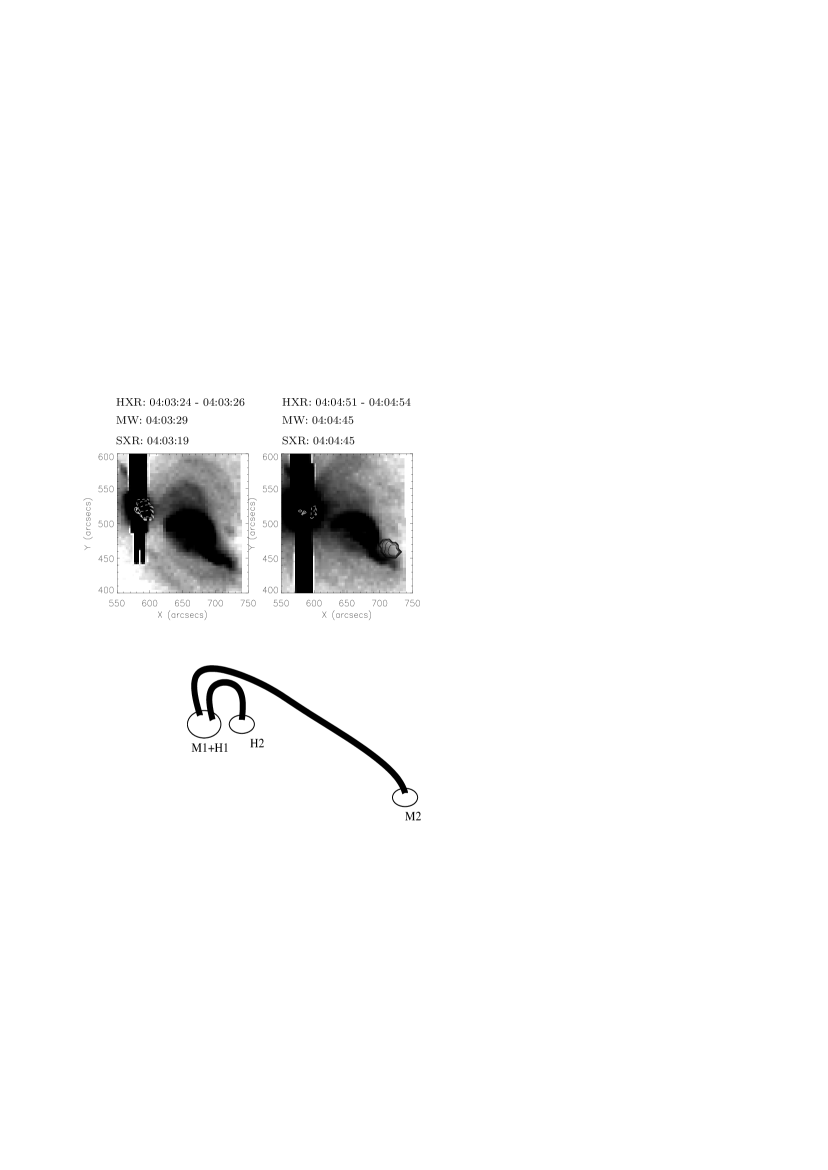
Around 04:03:51 UT a remote brightening (c.f. Figure 12) in MW emission appeared in South-West direction i.e. towards the leading spot, which, however, showed right handed polarization. This implies that the main and the remote MW emission have their source in opposite magnetic polarities. It also seems that this remote source occurred by the impact of accelerated energetic electrons from the reconnection site.
3.3 DYNAMICS OF HARD X-RAY SOURCES
Yohkoh/HXT observed this flare in great detail. The four HXT energy channels L, M1, M2 and H showed strong impulsive burst with almost equal counts 528, 570, 550 and 463 cts/sec/sc respectively, indicating very hard spectrum. The impulsiveness of the flare following Pearson , (1989) and Jain , (2002) in hard X-ray is 6.06 counts sec-2.

In Figure 9 we show the temporal evolution of HXR image (contour) in the M2 and H bands during the impulsive phase of the flare. In all energy bands only single source was seen. We have calculated the size of HXR source using the ellipse fit on source. From this ellipse fit the estimated size of the HXR source was 7.03.8, 6.73.3, 6.53.3 and 6.23.2 arcsec in L, M1, M2 and H energy bands respectively.
Figure 10 shows that the HXR source moves in North-West direction and rotates in clockwise direction. The motion of HXR source in x (West) direction was found more than y (north) direction. To study the motion as well as rotation related to HXR source in Figure 10 we plot the temporal variation of central position of the source and the angle of source from the x-axes in clockwise direction. To determine the centroid location of HXR source, a two-dimensional noncircular gaussian fit was used. The motion in HXR sources is common, which has been studied by several authors (Sakao, 1992; Krucker, Hurford, and Lin, 2003; Bogachev , 2005 and references therein). The rotation of the HXR source in this impulsive flare appears an unusual phenomena and being reported by us for the first time. We have measured average speed and rotation rate of HXR source which is about 100 km sec-1 and 1.5 deg sec-1 respectively.
In Figure 11 we show the X-ray photon spectrum derived by the Yohkoh/HXT data at the maximum of the hard X-ray flare. It may be noted that the spectrum is well fitted by power-law with power law index 2.4 which indicate the very hard spectrum. This result suggests that the HXR emission above 14 keV was produced by non-thermal electron beams. In table I we present the parameters derived from the single power-law fit as shown in Figure 10. In order to derive the plasma parameters we used the following formula:
| (1) |
Where I is the photon flux at an energy E in keV, is power-law index and A1 is a constant. According to thick target model the total energy flux of non-thermal electrons above the cut-off energy E0 is given by the following formula (Croshya, Aschwanden, and Dennis, 1993 and Tomczak, 1999):
| (2) |
Where B is the beta function. In the considered case the calculated total energy flux of non-thermal electrons having energies above 14 keV was 1.1 ergs sec-1.
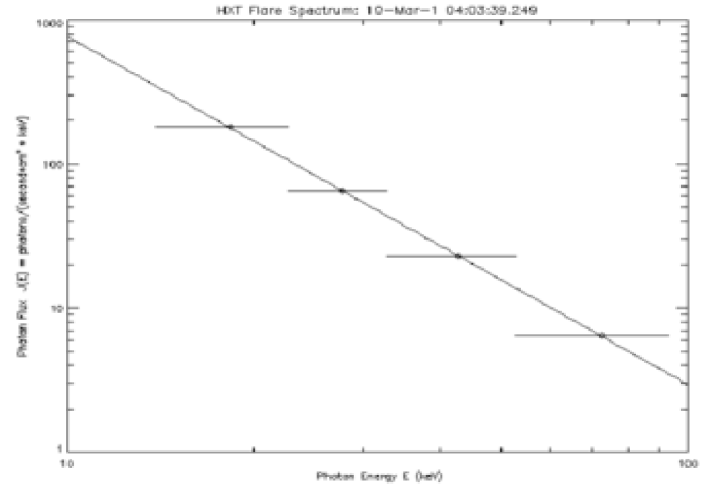
| Power-law Index, | 2.4 |
| Parameter A1 in Eq. 1 | 2.02 105 |
| Total energy flux of non-thermal electrons, | |
| E′(E 14keV)[ergs s-1] | 1.1 1029 |
| Duration of impulsive onset, t [s] | 20 |
| Total energy deposition by the E 14 keV | |
| electrons, (1/2)E′(E 14 keV) t [ergs] | 1.1 1030 |
4 Discussion
From the study of multiwavelength observations of impulsive flare of March 10, 2001 made in H, SXR, HXR and MW we found that this flare was composed of compact sources in H, SXR, HXR and MW emission.
From the co-alignment of H, HXR and MW source it is clear that the HXR source seems to be located near the footpoint on kernel K1. The above topology of the HXR, MW and H emission suggests that the cause for these emissions is energetic electrons. It appears that the emerging flux region (cf. paper I), close to following sunspot, was showing considerable activity and was approaching towards the following sunspot. This caused a disruption of filament channel, which apparently opened up the pre-existing loop system and led the reconnection between low lying loops of EFR and high lying loops of main active region. During this reconnection we feel that electrons were accelerated to very high energies and propagated very fast towards the feet of the low lying loops causing HXR emission as well as H emission. It was also noticed by us and reported in paper I that magnetic field was highly strong and sheared, which suggests that in addition to non-thermal bremsstrahlung also gyro-synchrotron process might be operating causing to MW emission as observed by us associated with this flare. However, from the similar time profile and evolution of HXR and MW emission it seems that these two emissions were produced from the same population of non-thermal electrons and they transferred their energy to the chromospheric material by collision while passing through the chromosphere (Fisher, Canfield, and McClymont, 1985; Brown, 1973 and Jain , 2000, 2005).
The HXR emission was from a single and compact source in all energy bands. According to Sakao et al. 1992 the single HXR source is produced if asymmetry of fluxes from double sources is so large, due to asymmetry in magnetic field strength around the double sources, that the flux from one of the pair of double source is below the dynamic range of Yohkoh/HXT, then the other source would be observed as a single source. In the present flare case, which occurred at N27W42 location it does not appears to us that strong magnetic field asymmetry might be existing in the region. However, Sakao et al. (1992) also suggested some other possibilities such as (1) the separation of double sources is smaller than the spatial resolution of HXT, hence an apparent single source is imaged, and (2) HXR emitted near the top of the flaring loop. Thus, within the spatial resolution limit, we propose that the observed HXR single source may be a double source but it was not resolved.
In HXR source we noticed the motion in the North-West direction. The HXR source motion has been studied earlier by many authors (Krucker, Hurford, and Lin, 2003; Ding , 2003; Sakao , 1994; Sakao , 2000 and references therein). The source motion in M2 and H energy bands was found almost in the same direction. We interpret the HXR source motion as the shifting of the foot points as a function of the reconnection. The HXR source at a foot point is generated as a result of interaction of accelerated electrons with the ambient material near foot point of the loop and the source is progressively changing its location as the newly magnetic field lines get reconnected.
In this impulsive flare we also noticed the rotation in HXR and H source in clockwise direction, which is an unusual feature. To explain this rotation we assume that the pair of two unresolved HXR sources corresponds to the two ends of a series of reconnected magnetic loops. In this situation, one possibility is that the shear angle is different for low lying and high lying loops and the shear angle is changing. Due to this change of shear angle the site of magnetic reconnection will also change and hence the HXR source is rotating. The other possibility of HXR source rotation is that two unresolved HXR foot points may move same direction along the neutral line with different speeds. Such motions are the chromospheric signature of displacement of the particle acceleration region during the impulsive phase ( Bogachev , 2005). The observations by Wang (2003) indicate that an electric field in the corona is not uniform along the reconnecting current layer at the separator. The peak point of the electric field may change its position during the impulsive phase of the flare. Consequently the unresolved HXR sources should move in the same direction along the neutral line and hence the HXR source may be rotating.
From the spatial correlation between different waveband sources we conclude that the analysed flare had the ’three-legged’ structure i.e. it may be considered to be one of the typical configuration of loops as suggested earlier by Hanaoka (1996). Accordingly it might be possible that the disruption of filament channel and the flare were caused as a consequence of interaction between low lying loops of EFR and long high lying loops of pre-existing main active region. Our results suggest such mechanism in consistent to earlier findings of Hanaoka (1996, 1997) and Nishio (1997).
The observations of the flare under study and results obtained from their analysis reveal a scenario as shown in Figure 12. The MW source at the flare site is marked as M1 main source and remote MW source is marked as M2 and unresolved single HXR source is marked as H1 and H2 at the main flare site, which is coinciding with H kernel K1. This cartoon is similar to that of Hanaoka (1996, 1997).
5 Conclusion
We have studied the co-alignment of H, SXR, HXR, MW and Magnetograms of 10 March, 2001 impulsive flare and the main results are as follows:
1. The HXR source was found spatially associated with H bright kernel K1 and MW source seems to be on the loop top.
2. The analysed impulsive flare possibly had three-legged structure.
3. We detect a single HXR source, which showed motion in North-West direction as well as rotation in clockwise direction. We also noticed the clockwise rotation in H. The rotation in the HXR and H sources are an unusual feature of this flare. To explain this rotation we propose the following two possibilities:
(a) The rotation may be result of progressive reconnection of magnetic field lines and thereby continuously changing the magnetic reconnection site.
(b) The peak point of the electric field may change during the impulsive phase, hence the HXR and H sources are rotating.
Acknowledgements.
This work was supported by Japan Society for Promotion of Science (JSPS) and Department of Science and Technology (DST), India under India-Japan Cooperative Science Programme (IJCSP). We are thankful to Prof. Satoshi Masuda, Prof. B. V. Somov, Prof. K. Shibasaki and Prof. T. Sakurai for very useful discussions which help in the interpretations of our results. The authors (R.C. and W.U.) are also thankful to Prof. Ram Sagar for his kind support to carry out this work. Special thanks to the anonymous referee for his/her constructive comments and suggestions which improved the scientific content of the paper significantly.References
- Bogachev et al. (2005) Bogachev, S., Somov, B. V., Kosugi, T. and Sakao, T.: 2005, Astrophys. J. 630, 561.
- Brown et al. (1973) Brown, J. C.: 1973, Solar Phys. 31, 143.
- Crannell et al. (1991) Crannell, C. J., : 1991, BAAS 23, 1056.
- Crosby et al. (1993) Crosby, N. B., Aschwanden M. J. and Dennis B. R.: 1993, Solar Phys. 143, 275.
- Ding et al. (2003) Ding, M. D., : 2003, Astrophys. J. 598, 683.
- Fisher et al. (1985) Fisher, G. H., Canfield, R. C. and McClymont, A. N.: 1985, Astrophys. J. 289, 425.
- Gaizauskas et al. (1997) Gaizauskas, V, Zirker, J. B., Sweetland, C. and Kovacs, A. : 1997, Astrophys. J. 479, 448.
- Gaizauskas et al. (2001) Gaizauskas, V., Mackay, D. H. and Harvey, K. L : 2001, Astrophys. J. 558, 888.
- Gary et al. (1990) Gary, D. E. and Hurford, G. J.: 1990, Astrophys. J. 361, 290.
- Hanoka et al. (1996) Hanoka, Y.: 1996, Solar Phys. 165, 275.
- Hanoka et al. (1997) Hanoka, Y.: 1997, Solar Phys. 173, 319.
- Hanoka et al. (2000) Hanoka, Y.: 2000, Ads. Space Res. 26, 117.
- Jain et al. (1983) Jain, R. : 1983, Ph. D. Thesis, Gujrat University, Ahmedabad, India.
- Jain et al. (2000) Jain, R., : 2000, BASI. 29, 117
- Jain et al. (2000) Jain, R., : 2000, BASI. 29, 117
- Jain et al. (2002) Jain, R., Sharma, R. and Shah, K. J. : 2002, Probing the sun with high resolution, Narosa Publishing House, India, eds. S.C. Tripathy and P. Venkatakrishnan., 227.
- Joshi et al. (2003) Joshi, A., Chandra, R. and Uddin, W. : 2003, Solar Phys. 217, 173.
- Kosugi et al. (1991) Kosugi. T., : 1991, Solar Phys. 136, 17.
- Krucker et al. (2003) Krucker, S., Hurford, G. J. and Lin, R. P.: 2003, Astrophys. J. 595, L103.
- Kundu et al. (1989) Kundu, M.R., : 1989, Astrophys. J. 347, 505.
- Kundu et al. (1982) Kundu, M.R., : 1982, Astronomy and Astrophys. 108, 188.
- Kundu et al. (1983) Kundu, M.R., Bobrowsky, M. and Rust, D. M. : 1983, Astrophys. J. 265, 1084.
- Kundu et al. (1961) Kundu, M.R.: 1961, J. G. R. 66, 4308.
- Kundu et al. (1989) Kundu, M. R., White, S. M. and Schmahl, E. J.: 1989, Solar Phys. 121, 153.
- Kundu et al. (2001) Kundu, M. R. and White, S. M.: 2001, Astrophys. J. 547, 1090.
- Lin et al. (1992) Lin, R. P., : 1992, J. G. R. 97, 1121.
- Liu et al. (2001) Liu, Y., Ding, M. D. and Fang, C.: 2001, Astrophys. J. 563, L169.
- Marsh et al. (1980) Marsh, K. A. and Hurford, G. J.: 1980, Astrophys. J. 240L, 111.
- Nakajima et al. (1994) Nakajima, H., : 1994 Proc. IEEE 82, 705.
- Nitta et al. (1991) Nitta, N., : 1991, Solar Phys. 132, 125.
- Nishio et al. (1997) Nishio, M., : 1997, Astrophys. J. 489, 976.
- Pearson et al. (1989) Pearson, D. H., : 1989, Astrophys. J. 336, 1050.
- Priest et al. (1984) Priest, E. : 1984, Magnetic Reconnection in space and laboratory plasmas (proceedings of Chapman Conference on Magnetic reconnection, Los Alamos, Washington p. 63.
- Rolli et al. (1998) Rolli, E., Wulser, J. P. and Magun, A.: 1998, Solar Phys. 180, 343.
- Sakao et al. (1992) Sakao T., : 1992, PASJ 44, L83.
- Sakao et al. (1994) Sakao T.: 1992, Ph.D. Thesis, Univ. Tokyo
- Sakao et al. (2000) Sakao T., : 2000, Adv. Space Res. 26, 497.
- Scherrer et al. (1995) Scherrer, P. H., : 1995, Solar Phys. 162, 129.
- Schmieder et al. (1985) Schmieder, B., Malherbe, J. M. and Raadu, M. A.: 1985, Astron Astrophys. 142, 294.
- St. Cyr et al. (2001) St. Cyr, O. C., : 2001, American Geophy. Union SH42A-0768.
- Singh et al. (1995) Singh, J. and Gupta, S. S.: 1995, Solar Phys. 158, 259.
- Sterling et al. (2001) Sterling, A. C.: 2001, Astrophys. J. 561, 1116.
- Takano et al. (1997) Takano : 1997, Coronal Physics from Radio and Space Observations; Proceedings of the CESRA Workshop held in Nouan le Fuzelier, France 3-7 June 1996, edited by Gerard Trottet, Published by Springer, p.183
- Tomczak, M. (1999) Tomczak, M., : 1999, A A 342, 583.
- Tsuneta et al. (1991) Tsuneta, S., : 1991, Solar Phys. 136, 37.
- Uddin et al. (2004) Uddin, W., : 2004, Solar Phys. 225, 325.
- Wang et al. (2003) Wang, H, Qiu, J., Jing, J. and Zhang, H.: 2003, Astrophys. J. 593, 564.
- White et al. (1992) White, S. M., : 1992, Astrophys. J. 384, 656.