Can the unresolved X-ray background be explained by emission from the optically-detected faint galaxies of the GOODS project?
Abstract
The emission from individual X-ray sources in the Chandra Deep Fields and XMM-Newton Lockman Hole shows that almost half of the hard X-ray background above is unresolved and implies the existence of a missing population of heavily obscured active galactic nuclei (AGN). We have stacked the – X-ray emission from optical sources in the Great Observatories Origins Deep Survey (GOODS; which covers the Chandra Deep Fields) to determine whether these galaxies, which are individually undetected in X-rays, are hosting the hypothesised missing AGN. In the – energy range the stacked-source emission corresponds to the remaining – per cent of the total background – the fraction that has not been resolved by Chandra. The spectrum of the stacked emission is consistent with starburst activity or weak AGN emission. In the – band, we find that upper limits to the stacked X-ray intensity from the GOODS galaxies are consistent with the per cent of the total background that remains unresolved, but further selection refinement is required to identify the X-ray sources and confirm their contribution.
keywords:
surveys – galaxies: active – galaxies: starburst – X-rays: diffuse background – X-rays: galaxies1 Introduction
Most of the extragalactic X-ray background (XRB) has been conclusively shown to be the integrated emission from discrete sources, in particular, the accretion light from Active Galactic Nuclei (AGN). The – XRB has a spectral slope of with a – per cent spread in measurements of the normalisation (see e.g. Revnivtsev et al., 2003; De Luca & Molendi, 2004), a large amount of which is due to field-to-field variations (Barcons et al., 2000). Emission from sources resolved by Chandra in the broad – and – bands is able to account for – per cent of the XRB (Mushotzky et al., 2000; Giacconi et al., 2002; Alexander et al., 2003b; Bauer et al., 2004), leading to some claims that the origin of the background has been solved. Recent analysis of very hard () X-ray data, however, as well as growing evidence from infrared and submillimetre studies, indicate that a substantial number of hard X-ray emitting AGN may remain to be found.
Although the resolved XRB in the broad – range is high, this does not imply that the background is accounted for at , since the fraction is dominated by counts in the – range to which telescopes such as Chandra are most sensitive (Worsley et al., 2005). Narrow energy band source-stacking in the XMM-Newton Lockman Hole (XMM-LH) and Chandra Deep Fields North (CDF-N) and South (CDF-S) indicate that the resolved fraction of the XRB decreases from – per cent over –, to per cent over –, and only per cent (Worsley et al., 2004, 2005). These analyses derived the resolved fraction by summing, in narrow energy bands, the X-ray fluxes from all individually-detected sources. The same source list was used for each narrow band considered, regardless of whether or not a source is explicitly detected in that band (most, but not all, sources were actually detected in the soft range; refer to Worsley et al., 2004, 2005, and references therein). The unresolved background component has a spectral shape that is consistent with an unresolved population of highly-obscured AGN at redshifts – and with absorption column densities of – . Since the sources have not been individually detected in X-rays, their intrinsic, de-absorbed luminosities are probably (rest-frame –), though this depends on important assumptions about their space density and absorption column densities.
The steeply-rising X-ray source number counts in the – band show no evidence for flattening towards fainter fluxes (Hasinger et al., 2001; Rosati et al., 2002; Baldi et al., 2002). Since the average spectral slope of sources is known to be a strong function of flux – becoming progressively harder with decreasing flux (Ueda et al., 1999; Fiore et al., 2003; Alexander et al., 2003b; Streblyanska et al., 2004) – this also suggests a large, undiscovered population of faint, hard X-ray sources.
Locally, highly obscured AGN outnumber their unobscured counterparts by a factor of :. The three nearest luminous AGN – Cen A, NGC4945 and Circinus – all have column densities , with NCG4945 and the Circinus galaxy being Compton thick (Matt et al., 2000). Population synthesis models (e.g. Gilli et al., 2001; Franceschini et al., 2002; Gandhi & Fabian, 2003; Ueda et al., 2003; Comastri, 2004) require large numbers of highly obscured AGN in order to account for the peak in the XRB spectrum (Setti & Woltjer, 1989). If the ratio of obscured to unobscured AGN remains high (e.g. Gilli et al. 2001 predict :) out to high redshift, then a large number of faint, obscured sources could remain undetected in deep X-ray observations. At redshifts recent, careful studies suggest the obscured:unobscured ratio is indeed high (e.g. Alexander et al. 2005 find :).
Highly obscured AGN can show little or no soft X-ray emission due to photoelectric absorption, particularly if the covering fraction of the obscuring material is high and the fraction of reflected light is low. Current X-ray telescopes have been able to detect many low-redshift obscured AGN, as well as examples of type II quasars (e.g. Norman et al., 2002; Stern et al., 2002; Gandhi et al., 2004), yet sensitivity to faint, hard sources is still limited. Highly obscured sources with Seyfert luminosities (e.g. the Circinus galaxy) are undetectable even in the CDFs beyond redshifts of – (see Fig. 6 in Brandt & Hasinger, 2005) – the distance at which the majority of unobscured AGN are found. Submillimetre and infrared observations (see e.g. Alexander et al., 2003a, 2005; Treister et al., 2004), may be the key to identifying the highly absorbed sources through the reprocessed AGN emission emerging at these wavelengths. IR colour selection using Spitzer data should be able to disentangle starburst emission from the re-radiated AGN emission (Alonso-Herrero et al., 2004; Lacy et al., 2004, 2005).
The Great Observatories Origins Deep Survey (GOODS) (Dickinson et al., 2003) is an ongoing campaign of multiwavelength deep-field observations comprised of existing and planned surveys. The programme is being carried out in two fields, each in size. The GOODS-N field is contained within the CDF-N (Alexander et al., 2003b) and includes the Hubble Deep Field North (Williams et al., 1996; Ferguson et al., 2000). The GOODS-S field lies inside the CDF-S (Giacconi et al., 2002) and contains the Hubble Space Telescope (HST) Ultra Deep Field observation. As part of the GOODS project the Spitzer Space Telescope has also carried out deep infrared surveys in the region from – (PI M. Dickinson) and the HST Advanced Camera for Surveys (ACS) has provided deep imaging of the fields in four broad wavebands (Giavalisco et al., 2004), not to mention a host of observations from ground-based telescopes.
We have performed X-ray stacking of optically-detected GOODS galaxies that have not been individually detected in X-rays: we specifically ignore all the X-ray sources that have already been individually detected in the CDFs – stacking analyses of these objects are covered in our earlier work (see Worsley et al., 2005). Since the GOODS survey probes optical galaxies to low luminosity and high redshift, once the already-detected X-ray sources are removed, the remaining ‘normal’ galaxies are likely candidates to host the hypothesised missing population of highly obscured AGN.
2 Analysis
2.1 X-ray data and optically-detected sources
The CDF-N covers a total of and is larger than the GOODS-N optical survey region, which is focused on the CDF-N aim-point. X-ray source detection sensitivities are and in the – and – bands respectively. We use the main point-source catalogue (see Alexander et al., 2003b) which contains 503 sources. The CDF-S is also larger than the GOODS-S optical region with an area of and detection sensitivities of and in the – and – bands respectively. The main point-source catalogue contains 326 sources (Alexander et al., 2003b).
The deep optical imaging of the GOODS regions, using the HST Advanced Camera for Surveys (ACS) is now available in the four non-overlapping photometric filters: F435W (), F606W (), F775W () and F850LP () (Giavalisco et al., 2004). The limiting magnitudes in these four bands are 27.9, 28.2, 27.5 and 27.4 respectively (assuming an aperture of ). We use the r1.1z version of the GOODS ACS catalogue111Available at http://www.stsci.edu/science/goods/ which contains 32,048 and 29,661 optically-detected sources in the entire GOODS-N and GOODS-S regions respectively.
2.2 X-ray image stacking
Our stacking procedure is similar to that taken by Lehmer et al. (2005) (also see Brandt et al., 2001; Nandra et al., 2002). At each optical source position we extract photon counts from the X-ray images and exposure times from the X-ray exposure maps. We used circular extraction apertures where a fixed 3-pixel radius () was found to give the best signal-to-noise ratio (SNR) compared to 2-pixel and 4-pixel apertures. To avoid contamination by X-ray detected sources we did not stack any optical sources lying within three times the 90 per cent encircled-energy fraction radius of an X-ray source (Alexander et al., 2003b). We performed our stacking procedure in several narrow energy bands: –, –, –, – and –.
The background was estimated using a Monte Carlo approach. Each stacking position was randomly shifted in RA and dec. up to away from its original position but was not allowed to overlap with the stacking aperture of an optical source position, nor lie within three times the 90 per cent encircled-energy fraction radius of an X-ray detected source. The Monte Carlo procedure was carried out 10,000 times (except during the stacking of all the sources in the catalogue, where only 1000 trials were computationally feasible due to the large number of sources; see Table 3), and the mean and variance of the background level determined.
We quantify the significance of the detection of X-ray emission from the stacked objects in terms of the signal-to-noise ratio (SNR). This is given by
| (1) |
where is the total number of stacked-source counts (i.e sources and background) and is the total number of Monte Carlo stacked-background counts (i.e. background only). For ease of reference, Table 1 gives the probability of a false detection (i.e. the probability of recording the excess counts above background by chance alone), for various SNRs.
| SNR () | |
|---|---|
| Energy band | Counts-to-flux conversion factor | Encircled energy fraction | ||
|---|---|---|---|---|
| () | () | (3-pixel radius aperture) | ||
| CDF-N | CDF-S | CDF-N | CDF-S | |
| – | 0.69186 | 0.65327 | 0.705 | 0.704 |
| – | 0.44369 | 0.46358 | 0.690 | 0.688 |
| – | 1.4583 | 1.5830 | 0.653 | 0.652 |
| – | 2.4763 | 2.7689 | 0.612 | 0.612 |
| – | 8.9967 | 10.254 | 0.567 | 0.567 |
Total count-rates were derived by dividing the total number of stacked counts by the total stacked exposure time. These were then converted to fluxes using counts-to-flux conversion factors from Alexander et al. (2003b). We assumed a power-law plus Galactic absorption of and for the CDF-N (Lockman, 2004) and CDF-S (Stark et al., 1992) respectively. The conversion factors are given in Table 2 and include the necessary corrections for Galactic absorption and the low-energy absorption seen in Chandra due to molecular contamination of the telescope’s optical blocking filters.
The size of the Chandra point spread function (PSF) varies strongly with off-axis angle. The radius enclosing 50 per cent of the counts from a point-source is only at the aim-point rising to at an off-axis angle of (at ). Since the sky density of the optical sources is high enough to result in overlap of the PSFs towards the edges of the fields we restricted our analysis to the central of the X-ray field to avoid confusion between sources, and between sources and background. Stacking sources in these central regions also enabled the use of a 3-pixel fixed aperture size, which encloses the core of the PSF. The PSF remains fairly compact, and more importantly, well-measured over these central regions and so the stacked counts can be easily corrected for PSF effects. We used the data222Enclosed Count Fractions (ECF) using circular apertures based upon the SAOsac model of the Chandra PSF (2005 June 24) which is available at http://cxc.harvard.edu/cal/Hrma/psf/ECF/hrmaD1996-12-20hrci_ecf_N0002.fits from a circular parameterisation of the PSF in order to calculate and correct-for the encircled-energy fraction at each aperture position and energy band. The average encircled energy fractions in each of the energy bands for the CDF-N and CDF-S are given in Table 2.
The total stacked-source fluxes were finally converted to intensity over the solid angle on the sky in which the sources were stacked; in this case this is simply the circular central region (), minus the area of the regions around X-ray detected sources which we excluded from our analysis. The excluded solid angles are and in the CDF-N and CDF-S respectively.
2.3 X-ray Background Model
In order to calculate the fraction of the XRB which can be attributed to the stacked sources we assume the XRB spectrum from Worsley et al. (2005). This is a – power-law of photon index and with a normalisation of as observed by De Luca & Molendi (2004). Above the analytical model of Gruber et al. (1999) is used, although renormalised to smoothly intercept the – power-law. Below we use a steeper power-law (), which intercepts the low-energy extragalactic XRB measurements from Roberts & Warwick (2001).
Whilst the slope of the XRB is well known in the – range, the normalisation measured by different instruments shows – per cent variations. These measurements (see e.g. Vecchi et al., 1999; Lumb et al., 2002; Revnivtsev et al., 2003; De Luca & Molendi, 2004) are typically obtained over large regions, typically several square degrees. The variations in XRB normalisation can be explained in terms of uncertainties in the cross-calibration between instruments, and the field-to-field variations arising from the discrete nature of the sources making up the background. In pencil-beam fields such as the CDFs, which only sample , field-to-field variations are at least per cent (Barcons et al., 2000), and further variations could be due to true ‘cosmic variance’ – real differences in XRB level beyond those simply arising due to sampling statistics. For example, spatial clustering on the sky (see e.g. Gilli et al., 2003, 2005) could be responsible for additional variations in normalisation, whilst clustering in redshift space could create additional variations in XRB spectral shape. Error in our XRB spectrum is taken from the measurement errors quoted for the difference sources: we have not added any additional uncertainty to allow for field-to-field variations.
3 Results & discussion
3.1 Optical source stacking
Table 3 summarises our stacking analyses of the optically-detected GOODS sources. The CDF-N and CDF-S fields were stacked separately to provide robustness. Stacking of all the optical sources in the fields revealed highly significant (–) detections in the soft – and – bands. Strong results are seen in the – band ( and for CDF-N and CDF-S respectively) and the broad – range ( and ). Detection of flux in the very hard – band is tentative at and , although the combined CDF-N and CDF-S detection is significant at the per cent level. No significant detection is found in the – band with only a signal in the CDF-S and a non-detection (i.e. ) in the CDF-N. We would also note that we see no obvious evidence for any spatial extension of the X-ray emission in the X-ray images associated with the stacking analysis, although a more complete investigation would be needed to pursue this further.
| Energy band | SNR () | |||||||
| () | ||||||||
| CDF-N Sources: | all sources | |||||||
| Number stacked: | ||||||||
| – | ||||||||
| – | ||||||||
| – | ||||||||
| – | ||||||||
| – | – | – | – | |||||
| CDF-S Sources: | all sources | |||||||
| Number stacked: | ||||||||
| – | ||||||||
| – | ||||||||
| – | ||||||||
| – | ||||||||
| – | – | |||||||
| Energy band | Percentage of XRB flux | ||||||||
| () | |||||||||
| CDF-N Sources: | all sources | already | |||||||
| Number stacked: | resolved | ||||||||
| – | |||||||||
| – | |||||||||
| – | |||||||||
| – | |||||||||
| – | |||||||||
| CDF-S Sources: | all sources | already | |||||||
| Number stacked: | resolved | ||||||||
| – | |||||||||
| – | |||||||||
| – | |||||||||
| – | |||||||||
| – | |||||||||
We repeated the stacking analyses using sub-samples of the GOODS sources, selecting on the -band, which samples the – wavelength range. The publicly-available GOODS catalogue is -band selected. The strongest detection of a soft () X-ray signal occurs for the galaxies, whilst the highest signal-to-noise of hard X-ray signals tend to occur for the brighter sub-samples, although the detections are borderline except for a – signal at for the CDF-N with sources. There is also hint of a – signal for the CDF-N with sources (), and the CDF-S with sources (). For the individual sources, we plotted X-ray counts against optical flux in various bands but saw no obvious correlation, nor was there any obvious trend apparent in similar plots of X-ray flux against various optical colours.
3.2 Source contributions to the unresolved XRB
Table 4 shows the total flux due to the stacked sources expressed as a percentage of the total XRB level (refer to section 2.3 for details of the XRB model assumed). Around – per cent of the – background is contributed by the GOODS sources. In the – band the contribution is per cent. However, only a upper limit of per cent can be placed on the – contribution using the CDF-N, with the CDF-S indicating per cent. Both measurements are consistent with both zero and a large contribution in this range.
Fig. 1 shows the spectral shape of the stacked X-ray emission from the GOODS sources, and the relative contributions to the total XRB level. It is encouraging to note that (at least for the range) we find the stacked contribution to the X-ray background agrees well with the ‘missing’ intensity once that from X-ray detected sources has been considered. The large errors mean that there remains some room for other emission, particularly in the – band, even when a per cent contribution from clusters is taken into account (see e.g. Moretti et al., 2003). The residual emission can place important constraints on any truly diffuse components (Sołtan, 2003) and the total contribution of accreting black holes to reionization (Dijkstra et al., 2004) but it is difficult to place any limits on the still-unresolved emission given the large errors and without a more thorough understanding of cosmic variance.
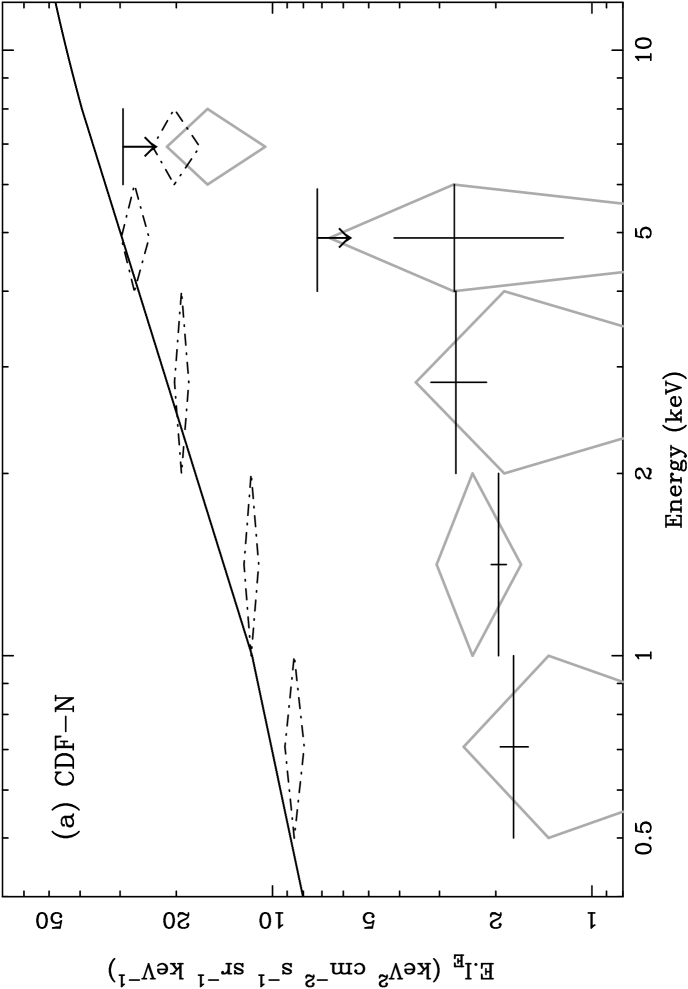
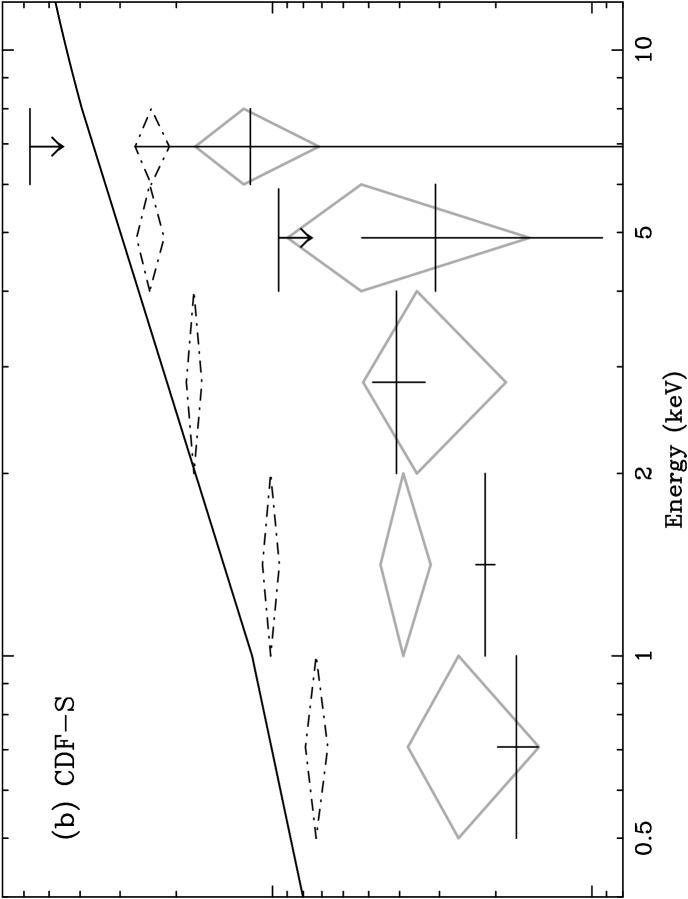
The reduction in sensitivity of Chandra above means that the instrumental background heavily outweighs any source signal and errors in the stacked X-ray intensity become very large. In the CDF-N – band the detection of a stacked signal representing per cent of the total XRB – the full unresolved intensity in this band – would only correspond to a ( in the CDF-S), with background counts exceeding source counts by a factor . The upper limit of per cent to the CDF-N stacked intensity is easily consistent with what is required to account fully for the background. The CDF-S stacked intensity gives per cent although the error is again very large. The upper limit in the CDF-S exceeds per cent.
Since GOODS will detect galaxies out to redshift we would expect the optically-detected sources to include almost every galaxy capable of hosting a significant AGN. Although the stacked X-ray flux from the GOODS optical sources is consistent with the missing XRB intensity, it is still possible that the contribution could be much lower and we briefly discuss the possible source populations which may be missing from our analysis. If the actual contribution is indeed much less than is needed to explain the unresolved XRB, then the missing AGN must come from rare sources, occurring with sky densities and so not sampled well in the pencil-beam surveys; or, from very faint galaxies that are not optically detected in the GOODS survey.
3.2.1 Rare source populations
The first of these possibilities requires the missing AGN to occur with sky densities , therefore not sampled by the deep surveys, and explaining why the stacked source emission fails to account for per cent of – XRB emission. However, it is also clear that the missing sources must occur with sky densities . This is because total XRB emission measurements by De Luca & Molendi (2004), who analyse the background in the fields of of XMM-Newton observations, find the total XRB emission is a power-law up to at least . The missing AGN must therefore be present at in order to be present in their analysis and provide the full XRB flux.
At densities of –, in order to be responsible for the full per cent of unresolved – XRB, the required flux per source would need to be in this band. Since only per cent of the – band is unresolved (Worsley et al., 2005), the required sources need to be Compton thick with (to have a negligible contribution) and of quasar luminosity (). Whilst Gandhi et al. (2004) have found several type II QSOs serendipitously at sky densities of , their sources tend to have – and the contribution to the XRB in the – band is only few per cent.
3.2.2 Optically undetected sources
The second alternative – that AGN hosts could remain optically undetected – is supported by the discovery of extreme X-ray/optical sources (EXOs) which show X-ray fluxes of –, yet are optically undetected with (Koekemoer et al., 2004a). The 7 EXOs in the CDF-S have now been detected using Spitzer observations (Koekemoer et al., 2004b). Interestingly, Wang et al. (2004) find that several of the EXOs show very hard X-ray spectra, consistent with type II AGN at redshift hosted by very under-luminous, or very dusty galaxies. It is plausible that X-ray undetected EXOs may contribute a few per cent to the total XRB level (those identified to date in the CDF-S contribute – per cent).
3.3 Spectral shape: AGN and starburst components
The softer flux seen from the GOODS sources is most likely to be dominated by starburst emission in these faint galaxies with a photon index –. The average – flux of the GOODS sources is at a sky density of . Adding this point to a soft X-ray – diagram (see fig. 4 in Bauer et al., 2004) is consistent with a direct extrapolation of the steeply-climbing number-counts distribution of star-forming galaxies, which at these very faint fluxes, outnumber AGN by an order of magnitude. Starburst activity is a likely explanation for the stacked emission although weak AGN activity is also possible.
Worsley et al. (2005) model the missing hard XRB intensity as emission from a population of heavily obscured AGN: a simplified spectral model consisting of a power-law, plus photoelectric absorption and a reflection component, is able to explain the shape of the missing XRB emission inferred from the Chandra Deep Fields for redshifts – and column densities – (see Fig. 4). Within the errors, the stacked X-ray emission from the GOODS sources does have a spectral shape which is consistent with that predicted from obscured AGN activity.
Assuming that the missing hard XRB can be explained by the hypothesised population of obscured AGN, the difficulty is in reducing the error in the – stacked Chandra emission to the point where definite verification or inconsistency can be seen between the XRB residual and the stacked GOODS intensity. If, for example, only per cent of the GOODS galaxies contain an obscured AGN, then the overwhelming majority of stacked X-ray positions are simply adding background noise to the measurement; we need to be able to select the likely AGN candidates. Our attempt to do this on the basis of the -band optical magnitude was not successful, with no particular -band magnitude restriction improving the – signal over that obtained when all sources were included, although there is a weak improvement when only the brighter () objects are selected. Selections of – did, however, succeed in increasing the SNR of the – band considerably: from to in the CDF-N (); and from from to in the CDF-N ().
A much better method of discrimination could be the use of infrared fluxes which will soon be available from Spitzer observations. Highly absorbed AGN are expected to show strong far infrared emission due to the reprocessing of X-ray emission by the obscuring dust. The difficulty here would be separating the obscured AGN candidates from strong starburst galaxies, which are also bright in the infrared.
4 Conclusions
We have stacked the emission from X-ray undetected optical sources in the GOODS fields to address the question of whether they can account for the missing hard XRB implied by the stacking of X-ray detected sources (Worsley et al., 2005). Our central conclusion is ‘plausibly, but not certainly, yes’. Whilst X-ray emission is detected at high significance in the – range, the strong downturn in the Chandra sensitivity makes detection more difficult at higher energies. By selecting the sources on the basis of -band (–) magnitude, we were able to obtain and detections of – emission in the CDF-N and CDF-S fields respectively, whilst in the – band we only achieve constraints at the and levels, respectively.
The – emission represents some – per cent of the XRB with per cent in the – band. When added to the fractions due to the resolved XRB the totals are consistent with per cent, although depending on XRB normalisation (and spectral shape ), there remains room for contributions from other sources. The CDF-S – intensity is per cent, suggesting that at least half of the unresolved XRB ( per cent), may be lurking in these sources; however, the errors are considerable, and the CDF-N shows no clear excess in the stacked – intensity above the instrumental background, although the upper limit to the potential XRB contribution is per cent in the CDF-N, which is more than enough to account for the unresolved intensity.
In previous work, we predicted that the missing component of the XRB is due to moderate luminosity, highly obscured AGN, with absorption column densities of – , at redshift –. Since GOODS is able to detect galaxies out to a redshift , we expected it to include the hosts of this heavily obscured AGN population. The stacked X-ray flux in the CDF-S shows a larger contribution in the – band (see Fig. 1), precisely where the steeply-rising spectrum of these sources becomes important. This could be the sought-after signature of the missing population, although the poor SNR and the consequently large errors mean the detection is uncertain.
Our results are also consistent with a negligible additional contribution to the XRB in the – band, which if true, would imply that the highly obscured AGN population is hosted by galaxies which are optically-undetected in the GOODS fields. Even with the recent discovery of EXOs, it seems unlikely that such a large AGN population can be accommodated by such optically faint hosts. A strong contribution could also be due to Compton thick quasars occurring with sky densities of –.
In order to boost the signal-to-noise of the stacked GOODS signal there remains much work to be done in selecting the appropriate sub-sample of sources, and avoid adding background noise to the measurement by including ordinary galaxies. Infrared-bright galaxies identified by Spitzer may hold the key to doing this, assuming differentiation between dusty star-forming galaxies, and potential obscured AGN, can be accomplished. Additional deep field observations, particularly further exposure in the CDF-N, could resolve the situation by increasing the sensitivity to individual, faint X-ray sources, as well as improve in the signal-to-noise ratio in stacked-source signals in the hardest energy bands. Additional investigations into EXOs will also provide useful constraints, as will shallow wide-area surveys at hard X-ray energies, which can place important limits on the contribution from heavily obscured quasars.
As a final comment we note that there is good agreement with the recent work of Hickox & Markevitch (2005) where both the resolved sources and unresolved background are measured in the – band using Chandra in the Deep Fields. The total background they determine has a normalization 6 per cent less than we assume (Section 2.3), but with an uncertainty of 11 per cent. A large amount of the difference in normalisations is probably due to differences in analysis methods, the most significant of which is our ‘bright end correction’ (see Worsley et al., 2005) which attempts to correct for the poor sampling of the bright end of the X-ray number counts distribution. The resolved fractions found by Hickox & Markevitch are in good agreement with our results in the bands used (– and –).
5 Acknowledgments
MAW and FEB acknowledge support from PPARC. ACF and DMA thank the Royal Society for support. WNB and BDL thank NSF career award AST-9983783 and CXC grant GO4-5157 for support. MAW would like to thank his coauthors for their support and patience in seeing this work through to publication.
References
- Alexander et al. (2003a) Alexander D. M. et al., 2003a, AJ, 125, 383
- Alexander et al. (2003b) Alexander D. M. et al., 2003b, AJ, 126, 539
- Alexander et al. (2005) Alexander D. M., Smail I., Bauer F. E., Chapman S. C., Blain A. W., Brandt W. N., Ivison R. J., 2005, Nat, 434, 738
- Alonso-Herrero et al. (2004) Alonso-Herrero A. et al., 2004, ApJS, 154, 155
- Baldi et al. (2002) Baldi A., Molendi S., Comastri A., Fiore F., Matt G., Vignali C., 2002, ApJ, 564, 190
- Barcons et al. (2000) Barcons X., Mateos S., Ceballos M. T., 2000, MNRAS, 316, L13
- Bauer et al. (2004) Bauer F. E., Alexander D. M., Brandt W. N., Schneider D. P., Treister E., Hornschemeier A. E., Garmire G. P., 2004, AJ, 128, 2048
- Brandt & Hasinger (2005) Brandt W. N., Hasinger G., 2005, ARA&A, 43, 827
- Brandt et al. (2001) Brandt W. N., Hornschemeier A. E., Schneider D. P., Alexander D. M., Bauer F. E., Garmire G. P., Vignali C., 2001, ApJ, 558, L5
- Comastri (2004) Comastri A., 2004, p. 323
- De Luca & Molendi (2004) De Luca A., Molendi S., 2004, A&A, 419, 837
- Dickinson et al. (2003) Dickinson M., Giavalisco M., The Goods Team , 2003, in The Mass of Galaxies at Low and High Redshift, p. 324
- Dijkstra et al. (2004) Dijkstra M., Haiman Z., Loeb A., 2004, ApJ, 613, 646
- Ferguson et al. (2000) Ferguson H. C., Dickinson M., Williams R., 2000, ARA&A, 38, 667
- Fiore et al. (2003) Fiore F. et al., 2003, A&A, 409, 79
- Franceschini et al. (2002) Franceschini A., Braito V., Fadda D., 2002, MNRAS, 335, L51
- Gandhi et al. (2004) Gandhi P., Crawford C. S., Fabian A. C., Johnstone R. M., 2004, MNRAS, 348, 529
- Gandhi & Fabian (2003) Gandhi P., Fabian A. C., 2003, MNRAS, 339, 1095
- Giacconi et al. (2002) Giacconi R. et al., 2002, ApJS, 139, 369
- Giavalisco et al. (2004) Giavalisco M. et al., 2004, ApJ, 600, L93
- Gilli et al. (2003) Gilli R. et al., 2003, ApJ, 592, 721
- Gilli et al. (2005) Gilli R. et al., 2005, A&A, 430, 811
- Gilli et al. (2001) Gilli R., Salvati M., Hasinger G., 2001, A&A, 366, 407
- Gruber et al. (1999) Gruber D. E., Matteson J. L., Peterson L. E., Jung G. V., 1999, ApJ, 520, 124
- Hasinger et al. (2001) Hasinger G. et al., 2001, A&A, 365, L45
- Hickox & Markevitch (2005) Hickox R. C., Markevitch M., 2005, ArXiv Astrophysics e-prints
- Koekemoer et al. (2004a) Koekemoer A. M. et al., 2004a, ApJ, 600, L123
- Koekemoer et al. (2004b) Koekemoer A. M. et al., 2004b, American Astronomical Society Meeting Abstracts, 205,
- Lacy et al. (2005) Lacy M., Canalizo G., Rawlings S., Sajina A., Storrie-Lombardi L., Armus L., Marleau F. R., Muzzin A., 2005, Memorie della Societa Astronomica Italiana, 76, 154
- Lacy et al. (2004) Lacy M. et al., 2004, ApJS, 154, 166
- Lehmer et al. (2005) Lehmer B. D. et al., 2005, AJ, 129, 1
- Lockman (2004) Lockman F. J., 2004, p. 111
- Lumb et al. (2002) Lumb D. H., Warwick R. S., Page M., De Luca A., 2002, A&A, 389, 93
- Matt et al. (2000) Matt G., Fabian A. C., Guainazzi M., Iwasawa K., Bassani L., Malaguti G., 2000, MNRAS, 318, 173
- Moretti et al. (2003) Moretti A., Campana S., Lazzati D., Tagliaferri G., 2003, ApJ, 588, 696
- Mushotzky et al. (2000) Mushotzky R. F., Cowie L. L., Barger A. J., Arnaud K. A., 2000, Nat, 404, 459
- Nandra et al. (2002) Nandra K., Mushotzky R. F., Arnaud K., Steidel C. C., Adelberger K. L., Gardner J. P., Teplitz H. I., Windhorst R. A., 2002, ApJ, 576, 625
- Norman et al. (2002) Norman C. et al., 2002, ApJ, 571, 218
- Revnivtsev et al. (2003) Revnivtsev M., Gilfanov M., Sunyaev R., Jahoda K., Markwardt C., 2003, A&A, 411, 329
- Roberts & Warwick (2001) Roberts T. P., Warwick R. S., 2001, in ASP Conf. Ser. 234: X-ray Astronomy 2000, p. 569
- Rosati et al. (2002) Rosati P. et al., 2002, ApJ, 566, 667
- Setti & Woltjer (1989) Setti G., Woltjer L., 1989, A&A, 224, L21
- Sołtan (2003) Sołtan A. M., 2003, A&A, 408, 39
- Stark et al. (1992) Stark A. A., Gammie C. F., Wilson R. W., Bally J., Linke R. A., Heiles C., Hurwitz M., 1992, ApJS, 79, 77
- Stern et al. (2002) Stern D. et al., 2002, ApJ, 568, 71
- Streblyanska et al. (2004) Streblyanska A., Bergeron J., Brunner H., Finoguenov A., Hasinger G., Mainieri V., 2004, Nuclear Physics B Proceedings Supplements, 132, 232
- Treister et al. (2004) Treister E. et al., 2004, ApJ, 616, 123
- Ueda et al. (2003) Ueda Y., Akiyama M., Ohta K., Miyaji T., 2003, ApJ, 598, 886
- Ueda et al. (1999) Ueda Y., Takahashi T., Ishisaki Y., Ohashi T., Makishima K., 1999, ApJ, 524, L11
- Vecchi et al. (1999) Vecchi A., Molendi S., Guainazzi M., Fiore F., Parmar A. N., 1999, A&A, 349, L73
- Wang et al. (2004) Wang J. X., Malhotra S., Rhoads J. E., Norman C. A., 2004, ApJ, 612, L109
- Williams et al. (1996) Williams R. E. et al., 1996, AJ, 112, 1335
- Worsley et al. (2004) Worsley M. A., Fabian A. C., Barcons X., Mateos S., Hasinger G., Brunner H., 2004, MNRAS, 352, L28
- Worsley et al. (2005) Worsley M. A. et al., 2005, MNRAS, 357, 1281