How extreme are the Wolf-Rayet Clusters in NGC 3125?††thanks: Based on observations made with ESO telescopes at the Paranal Observatory under programme ID 074.B-0108 and with archival ESO VLT and NASA/ESA Hubble Space Telescope data, obtained from the ESO/ST-ECF Science Archive Facility.
Abstract
We reinvestigate the massive stellar content of the irregular dwarf galaxy NGC 3125 (Tol 3) using VLT/FORS1 imaging and spectroscopy, plus archival VLT/ISAAC, HST/FOC and HST/STIS datasets. FORS1 narrow-band imaging confirms that the NGC 3125 A and B knots represent the primary sites of Wolf-Rayet (WR) stars, whilst HST imaging reveals that both regions host two clusters. Both clusters within region A host WR stars (A1 and A2), for which the optically fainter cluster A2 is heavily reddened. It is not clear which cluster within region B hosts WR stars. Nebular properties are in good agreement with previous studies and infer a LMC-like metallicity of log(O/H)+128.3. LMC template mid-type WN and early-type WC spectra are matched to the observed blue and red WR bumps of A1 and B, permitting the contribution of WC stars to the blue bump to be quantified. From our FORS1 spectroscopy we obtain N(WN5–6:WC4)=105:20, 55:0, 40:20 for clusters A1, A2 and B1 + 2, respectively. Our results are a factor of 3 lower than previously reported by optical studies as a result of a lower H/H derived interstellar reddening. Using Starburst99 theoretical energy distributions to estimate O star populations for each cluster, we find N(WR)/N(O)=0.2 for A1 and 0.1 for A2 and the clusters within region B. From H narrow-band imaging, the O star content of the Giant H ii regions A and B is found to be a factor of 5–10 times higher than that derived spectroscopically for the UV/optically bright clusters, suggesting that NGC 3125 hosts optically obscured young massive clusters, further supported by VLT/ISAAC K band imaging. Archival HST/STIS UV spectroscopy confirms the low interstellar reddening towards A1, for which we have determined an SMC extinction law for NGC 3125, in preference to an LMC or starburst law. We obtain N(WN5–6)=110 from the slit loss corrected He ii line flux. This is in excellent agreement with optical results, although it is a factor of 35 times lower than that inferred from the same dataset by Chandar et al. (2004). The discrepancy is due to an anomalously high interstellar reddening derived from their use of the generic starburst extinction law. Highly discrepant stellar populations may result in spatially resolved star forming regions from UV and optical studies through use of different extinction laws.
keywords:
galaxies: individual: NGC 3125 – stars: Wolf-Rayet1 Introduction
In order to understand galaxy formation and evolution we need to be able to accurately map the star formation history of the universe (Madau et al., 1996). Central to this topic are starburst galaxies, a class of object which display characteristics associated with massive, violent bursts of star formation. In the local Universe only a handful of starburst galaxies are responsible for a quarter of the entire high-mass star formation (Heckman, 1998). We need to be able to understand nearby starbursts if we are to interpret the observations of distant star forming regions e.g. Lyman break galaxies (LBGs, Steidel et al., 1996).
A subset of these galaxies are called “Wolf-Rayet galaxies”, since their integrated spectra display the broad emission signatures associated with Wolf-Rayet (WR) stars; the highly evolved descendants of the most massive O stars. Spanning a wide variety of morphological types, WR galaxies are observed in a wide variety of environments on a local (D100Mpc) scale and out to high redshift. WR stars are exclusively associated with young stellar populations (5Myr), so WR galaxies represent an excellent diagnostic of recent star formation.
Recently, Shapley et al. (2003) demonstrated that the composite spectrum of z 3 LBGs displayed broad He ii emission consistent with the presence of WR stars. The recent ultraviolet HST/STIS spectral survey of local starburst galaxies (Chandar et al., 2004) revealed weak He ii emission in most cases. Of the 18 galaxies included in their survey, the super star cluster NGC 3125-1 (alias NGC 3125-A in Vacca & Conti, 1992) showed the most prominent He ii emission.
NGC 3125 (Tol 3) is a nearby (D=11.5Mpc – Schaerer et al., 1999) blue compact dwarf galaxy. Observations have shown that the galaxy is dominated by a central starburst region which consists of two main emission knots, NGC 3125-A and -B. From UV spectroscopy, Chandar et al. (2004) estimate a WR population of and N(WR)/N(O) for NGC 3125-A. The latter is completely unexpected for the LMC-like metallicity of NGC 3125. In contrast, optical studies of NGC 3125-A infer a WR population of only and N(WR)/N(O) 0.1, an order of magnitude lower. WR populations in other nearby galaxies common to optical and UV surveys are found to be consistent to within a factor of two. If NGC 3125-A is a local analogue for LBGs it is necessary to reconcile optical and UV line techniques for this galaxy.
Here we reinvestigate the WR population of NGC 3125 using new VLT/FORS1 imaging and spectroscopy, supplemented by archival VLT/ISAAC imaging and HST imaging and spectroscopy. This paper is organised as follows: VLT and HST observations of NGC 3125 are discussed in Section 2. Section 3 describes nebular properties derived for the two WR clusters using optical diagnostics. In Section 4, WR and O star populations for each cluster are estimated using VLT/FORS1 imaging and spectroscopy. In addition, the WR population of NGC 3125-A is estimated from UV HST/STIS spectroscopy. Finally, we draw our conclusions in Section 6.
2 Observations and data reduction
We have observed NGC 3125 with the ESO Very Large Telescope UT2 (Kueyen) and Focal Reduced/Low dispersion Spectrograph #1 (FORS1), a 2048 2046 pixel Tektronix detector. Observations were made using the high resolution collimator which covers a 3.4′ 3.4′ field of view, with a plate scale of 0.1″pixel-1. Photometric observations of NGC 3125 were acquired during November 2004 and January 2005, with spectroscopic data following in February 2005. Details of the observations, including the DIMM seeing can be found in Table 1.
To supplement VLT/FORS1 observations we have retrieved VLT/ISAAC imaging and HST imaging and spectroscopy of NGC 3125 from the ESO/ST-ECF archive.
2.1 VLT Imaging
FORS1 was used to obtain narrow-band images centred on and (FWHM=66Å and 68Å respectively). The filter coincides with the strong N iii (Å), C iii (Å), and He ii (Å) WR emission lines, whereas the samples a wavelength region relatively free from emission, providing a measure of the continuum level. In addition, narrow-band on- and off-H images ( 6563, 6665Å, FWHM=61, 65Å) were acquired along with broad-band B images.
| Date | Observation | Exposure | DIMM seeing |
|---|---|---|---|
| (sec) | (″) | ||
| Imaging | |||
| 2004-Nov-08 | 4684 | 60, 900 | 0.42–0.43 |
| 60, 900 | 0.42,0.38 | ||
| 2004-Nov-17 | B | 10, 60, 600 | 0.58–0.59 |
| 6665 | 10, 60, 600 | 0.45–0.57 | |
| 2005-Jan-17 | 6563 | 10, 60, 600 | 0.67–0.79 |
| Spectroscopy | |||
| 2005-Jan-01 | 300V | 4 600 | 0.60 |
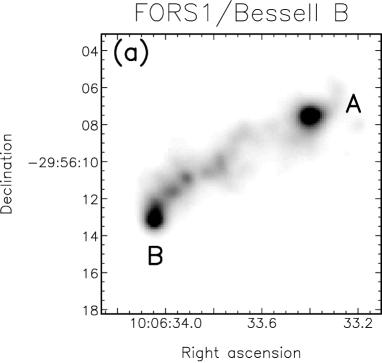
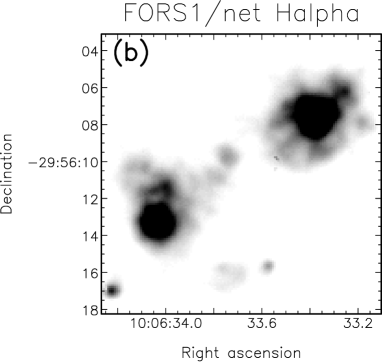
Images were reduced following standard reduction procedures (i.e debiased, flat field corrected and cosmic ray cleaned) using iraf and starlink packages. We present continuum, net H images and net 4684 images obtained with FORS1 in Figure 1.
The optical appearance of NGC 3125 is that of an amorphous elliptical (Schaerer et al., 1999), dominated by a bright central starburst. In Figure 1(a) we present a B band image of the central starburst region taken in excellent seeing conditions (0.6″). The continuum emission is dominated by two emission knots A and B (Vacca & Conti, 1992). A corresponds to the slightly brighter knot and is located 10″ to the NW of B. In the image, knot A appears to be partially resolved into two components whereas knot B does not. Several fainter emission knots appear to link the two dominant regions.
Figure 1(b) shows the VLT/FORS1 net H image of the central starburst. Nebular emission is concentrated on the two principal knots with region A extending 300pc and region B 200pc. This large size and H luminosities of 3.2 and 2.0 erg s-1 for A and B, respectively (see Section 4.2.2), indicate that A and B are typical of extragalactic Giant H ii regions which host multiple stellar clusters (Kennicutt, 1984).
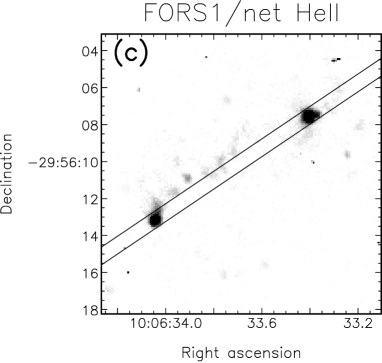
We have searched for characteristic WR signatures NGC 3125 by subtracting the image from the image, which is shown in Figure 1(c). Regions A and B are clearly identified as the primary hosts of WR stars. Region A contains a fainter emission component 0.4″to the W of the main source. This fainter component contributes 15% of the total 4684 emission.
 |
 |
 |
 |
Photometry of knots A and B was performed using the aperture photometry package phot within iraf. Instrumental zero points were derived by observing LTT3864 () and GD108 () spectrophotometric standard stars.
Magnitudes for source A include the fainter component to the W of the knot. We find mλ4686=17.0 and mλ4781=17.20.1. Photometric uncertainties have been estimated from background variations, contamination by nearby emission sources and the aperture size. An extremely close emission knot to the NW of source B made aperture photometry more difficult, reflected by larger photometric uncertainties, for which we derive mλ4686 and mλ4781 magnitudes of 17.50.2 and 17.70.2 respectively.
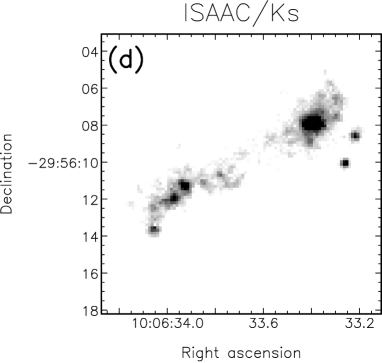
To complement our imaging dataset we have retrieved archival VLT/ISAAC images obtained on 18 April 2002 under excellent seeing conditions of FWHM0.4″. These observations comprise broad-band Ks imaging (5 on source plus 2 off-source exposures of 5 s) taken using the SW mode (Rockwell-Hawaii detector, plate-scale = 0.148 arcsec pixel-1). Images were calibrated relative to the 2MASS source 10063237-2956190 (K=15.0 mag) which was present in this 2.5′2.5′field.
In contrast to optical images, Figure 1(d) shows that in the near-IR, knot A is much brighter than B, with K=14.5 and 16.1 mag, respectively. In addition to the optically dominant sources, there are two bright knots to the NW of B, with a combined magnitude of K=15.0 mag. These are again more prominent than in optical images, suggesting the presence of partially obscured star forming regions. We will return to this in Section 4.2.2.
2.2 VLT Spectroscopy
Spectroscopic observations of NGC 3125 were undertaken on 1 February 2005 using FORS1 and the high resolution collimator in seeing conditions of 0.6″. Spectra were acquired using a 0.8″slit and 300V grism centred along the two main emission knots (PA=-124∘; see Figure 1(c)). The extracted spectra covered a wavelength range of 3300–8600Å with a dispersion of 2.6Å pixel-1 and resolution of 15Å (as measured from comparison arc lines).
Data were prepared and processed using standard techniques and iraf and starlink packages i.e. bias subtracted, flat field corrected, extracted and flux / wavelength calibrated. Care was taken during the extraction process to ensure neighbouring emission knots did not contaminate the aperture or the background subtraction. The spectrophotometric standard Feige 66 was observed in order to relatively flux calibrate the spectra.
Absolute flux calibration was achieved by comparing synthetic-filter photometry (Å) to photometry. We derive a slit correction factor of 1.30.2 for knot A, which dominates the accuracy of our final flux calibrated spectra. An identical correction factor is found for knot B. We expect our absolute flux calibration to be correct to 15%. Extracted spectra of NGC3125-A and B are shown in Figure 2, in which the principal WR emission features are identified, including weak N iv .

2.3 HST Imaging
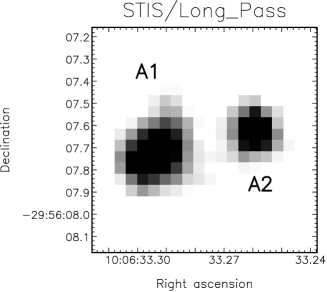
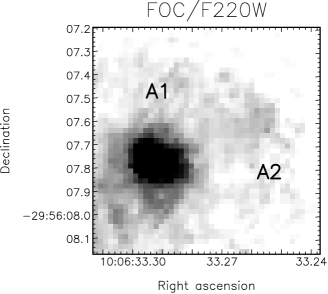
To compliment our FORS1 dataset we have retrieved archival HST images, including a STIS/LONG_PASS acquisition image (t = 40 s, = 7200Å) from programme GO 9036 (P.I. C. Leitherer) of region A and a FOC/F220W111FOC/F220W image is pre-COSTAR. image (t =500 s, = 2280Å) from programme GO 4800 (P.I. P. Conti) of the central starburst region.
The STIS/LONG_PASS acquisition image resolves region A into two clusters, separated by ″or 25pc at the distance of NGC 3125 (upper panel of Figure 3). We designate these two components A1 and A2, with A1 corresponding to the brighter of the pair to the east. The components have FWHM of 0.17″and 0.13″, and a flux ratio of F/F1.9 at 7200Å, although an absolute flux calibration was not possible.
In the HST/FOC F220W image A1 is bright whereas A2 is barely detected, with F(F220W)/F(F220W) 10 (lower panel of Figure 3). Assuming that A1 and A2 possess comparable intrinsic energy distributions – which is reasonable since both clusters host WR stars (Section 2.1) – A2 must suffer from significantly higher extinction. Aperture photometry reveals F(F220W)=(1.1erg s-1cm-1 and F(F220W) 3erg s-1cm-1.
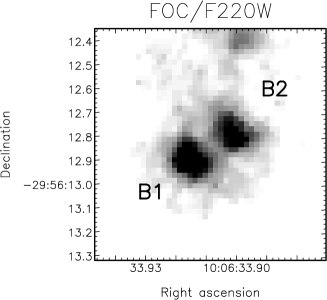
The HST/FOC image also resolves region B into two components (Figure 4) – B1 and B2, with the brighter component, B1 to the SE with F(F220W)/F(F220W)1.2. It is not clear which cluster within region B hosts the WR population since these are spatially unresolved in our VLT/FORS1 imaging. High spatial resolution optical imaging is not yet available. It was not possible to perform aperture photometry on B1 and B2 individually in these pre-COSTAR images, we therefore derive a total UV flux of erg s-1cm-1 for region B.
 |
 |
2.4 HST Spectroscopy
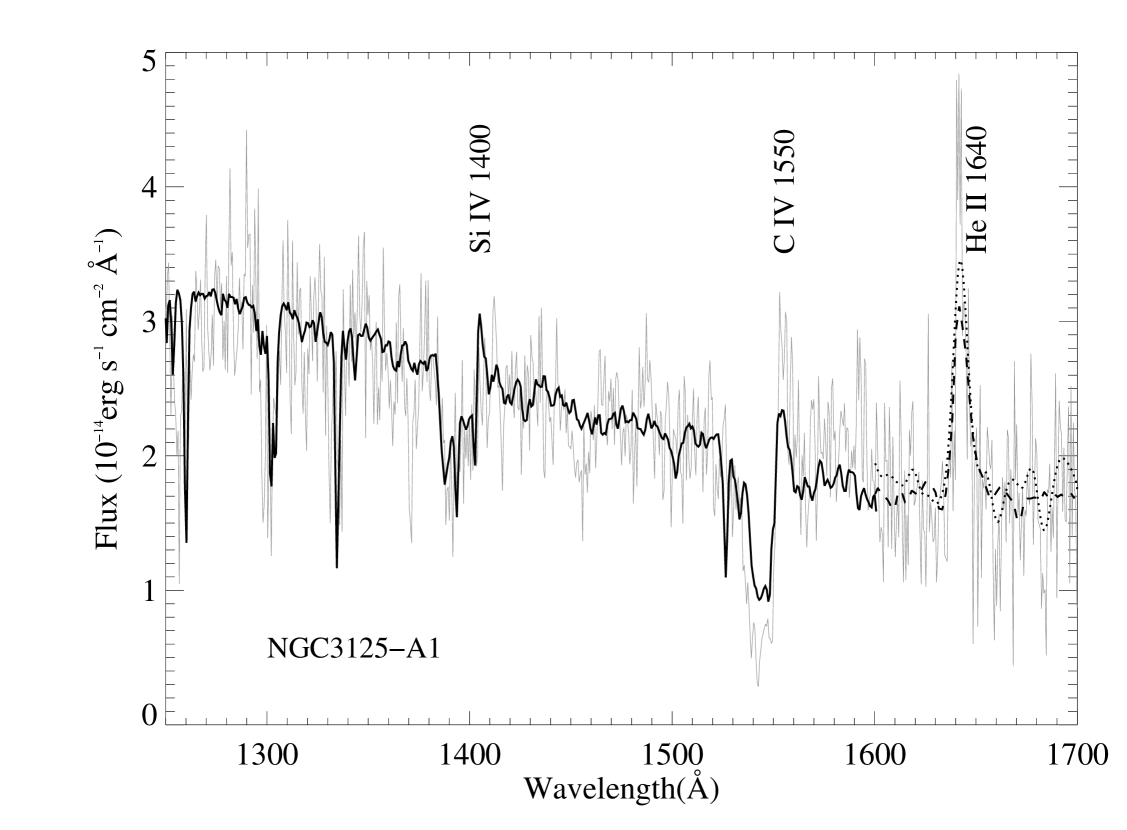
Archival HST/STIS spectroscopy of region NGC 3125-A1 (Chandar et al., 2004) was obtained in programme GO 9036 (P.I. C. Leitherer) and comprised two exposures with the G140L grating (FUV-MAMA detector), of duration 1050 and 2925 s, plus one exposure with the 230L grating (NUV-MAMA detector) using the 520.2″slit. The STIS MAMA detectors have a plate scale of 0.024″ pixel-1. Spectra were extracted over a 13 pixel (0.3″) aperture and combined to provide a complete wavelength coverage of 1175–3100Å, with a spectral resolution of 3 pixels (1.8Å).
The UV spectrum of A1 has been presented by Chandar et al. (2004) who noted the strong He ii 1640 emission feature, for which we measure an equivalent width of 6.90.8Å and FWHM4.80.7Å. Absolute flux calibration has been achieved by comparing our HST/STIS spectra with the F220W flux of A1. We derive spectral slit losses of 40%.
3 Nebular analysis
In the following section we will derive the nebular properties of NGC 3125-A and B. Observed (Fλ) and dereddened (Iλ) nebular line fluxes with respect to H=100 are presented in Table 2.
The nebular analysis was performed using the starlink package dipso with line fluxes being determined using the ELF (emission line fitting) routine. The emission line profiles were non-gaussian in the FORS1 spectra (comparison arc lines displayed the same profile, apparently due to the use of the high-resolution collimator for spectroscopy) and were modelled using template profiles created from the data. [O iii] and [O ii] emission lines were modelled using [O iii] as a template profile, H and [N ii] were modelled using the H emission line as a template.
| ——— A ——— | ———– B ——— | ||||
| (Å) | ID | Fλ | Iλ | Fλ | Iλ |
| 3727 | [O ii] | 83.5 | 99.0 | 109.2 | 123.9 |
| 4340 | H | 40.0 | 44.7 | 40.3 | 43.3 |
| 4363 | [O iii] | 3.9 | 4.6 | 2.8 | 2.9 |
| 4861 | H | 100 | 100 | 100 | 100 |
| 4959 | [O iii] | 205.7 | 203.2 | 169.8 | 162.3 |
| 5007 | [O iii] | 649.3 | 615.2 | 524.2 | 496.0 |
| 6563 | H | 371.4 | 282.9 | 351.2 | 279.2 |
| 6583 | [N ii] | 8.7 | 6.6 | 11.5 | 9.2 |
| 7330 | [O ii] | 3.7 | 2.7 | 3.6 | 2.7 |
| 4861 | H | 6.95 | 1.56 | 3.83 | 7.55 |
| A | B | |
|---|---|---|
| Te(O ii) (K) | 12 100 | 10 800 |
| Te(O iii) (K) | 10 500 | 9 800 |
| ne (cm-3) | 140† | 140† |
| O+/H | (1.8 | (3.5 |
| O2+/H | (1.9 | (1.9 |
| (O/H) + 12 | 8.32 | 8.35 |
† Electron densities were derived for [S ii] ratios of VC92.
3.1 Interstellar reddening
Estimates of the interstellar reddening have been made using the Balmer line ratios H: H: H. Nearby [N ii] emission has been accounted for when measuring observed H fluxes. Assuming Case B recombination theory for electron densities of 10 and a temperature of K (Hummer & Storey, 1987) we deduce average total for A and B, respectively.
Foreground Galactic reddening () towards NGC 3125 of =0.08 mag (Schlegel et al., 1998) was accounted for using a standard Galactic extinction law (Seaton, 1979). The point-like appearance of the two regions on ground-based images suggest that a Calzetti et al. (1994) starburst obscuration law is inappropriate. We therefore choose to use the Bouchet et al. (1985) SMC extinction law to deredden our spectra (see Section 5.2).
Underlying stellar H and H absorption from early-type stars is estimated to be Wλ 2Å. In our spectra, H and H equivalent widths are found to be 550Å and 100Å for both regions. Propagating this correction through calculations leads to an uncertainty in EB-V of 0.01 mag.
From a comparison between the STIS/Long_Pass acquisition and FOC/F220W images (Figure 3), cluster A2 appears to suffer a much higher extinction than A1, with F/F1.9 at 7200Å and 10 at 2280Å. If we assume that A1 and A1 possess identical intrinsic flux distributions, we estimate that E(A2)0.5 mag.
Kunth & Sargent (1981) derived a total EB-V=0.40 from H:H:H intensity ratios222Kunth & Sargent (1981) quote a colour excess of EB-V=0.28 mag in their Table 1, the origin of which is not given. It is not clear which value has been used in their subsequent analysis.. Higher (and weaker) members of the Balmer series can be significantly affected by underlying stellar absorption, which was not accounted for in their analysis.
Vacca & Conti (1992, hereafter VC92) also studied the nebular properties of NGC 3125-A and B. Using H:H line ratios they derived internal reddenings of E=0.40 and 0.64, respectively, significantly higher than those obtained here. A higher extinction for region B than region A is inconsistent with our UV and optical photometry, if we assume identical flux distributions for these regions, since B is brighter in the UV whilst A is brighter optically.
VC92 based their determination on composite blue (Å, photometric) and red (4500Å, non-photometric) spectra obtained 12 months apart. The red spectrum, which was scaled to the blue continuum, resulted in a H flux 20% larger than that measured in the blue spectrum. Based upon their red dataset alone, an extinction of NGC 3125-A fully consistent with the present result would have been obtained (Vacca, 2005, private communication).
3.2 Electron temperature, density & oxygen abundance
Electron temperatures, Te, for regions A and B have been derived from the temperature diagnostics [O ii] 3727/7325 and [O iii] (4959+5007)/4363 Å for the line ratios presented in Table 2. Electron temperatures were calculated using the five-level atom calculator temden within iraf for a constant electron density of 100 cm-3.
Errors on Te[O ii] were based on the 5% measurement error estimated for the [O ii] 7325Å line, while Te[O iii] uncertainties were based on the 10% formal error given for [O iii] 4363Å.
Electron temperatures derived here agree to within the errors of those reported by VC92 who found 10 200 K for region A and 10 300 K for region B.
Due to the low spectral resolution of our data [S ii] 6716/6731Å nebula lines are not resolved, preventing a direct estimate of the electron density . For completeness, we have estimated by combining our electron temperatures with [S ii] fluxes published by Vacca & Conti (1992). From these we estimate an electron density of 140 cm-3 for both regions. Errors are not quoted for electron densities since published [S ii] ratios did not give associated uncertainties.
Since the oxygen content is used as a proxy of a galaxy’s metallicity, we have derived the oxygen abundance for each region using [O ii] 3727Å and [O iii] 5007Å nebular emission lines and their associated electron temperatures (see Table 3).
Both regions, with log(O/H)+12 = 8.32–8.35 have an oxygen content comparable to log(O/H)+12 = 8.37 (Russell & Dopita, 1990) observed in the LMC. Our oxygen abundances are in excellent agreement with previous studies of Kunth & Sargent and Vacca & Conti who obtained log(O/H)+12 = 8.3–8.4.
4 Massive star population
In this section we derive the massive star content of NGC 3125-A and B using optical and UV techniques.
4.1 Estimating the number of WR stars
4.1.1 Optical
For regions A and B we detect broad blue and red WR features, as previously reported by Schaerer et al. (1999). Gaussian line profiles have been fit to the N iii /Ciii blend, He ii and C iv . Slit loss corrected emission line fluxes are presented in Table 4.
In region A we detect strong He ii emission plus N iii – C iii , indicative of a predominantly late WN population. We also detect weak N iv , as reported by Kunth & Sargent (1981). This suggests a dominant mid WN subtype (Smith et al., 1996; Crowther & Hadfield, 2006).
The presence of C iv emission suggests that a significant WC population is present in region A. WC stars are classified by the C iii /C iv line ratio (Smith et al., 1990a). Since C iii is very weak or absent, the dominant WC population is WC4–5.
Similar WR features are observed for region B, although He ii 4686 is somewhat weaker than that in region A. As such, we assume a dominant mid WN population whilst the red feature is again consistent with a early-type WC population.
As a first estimate of the WR population in each region we have derived numbers based solely on the observed He ii and C iv line luminosities, following the approach of Schaerer & Vacca (1998). We have attempted to derive WR populations for A1 and A2 separately, since UV spectroscopy relates only to A1 and A2 suffers a much higher extinction. From Figure 1(c) we estimate that the observed He ii 4686 flux ratio is 0.15:1 for A2:A1; whilst we assume only A1 is responsible for the C iv 5808 emission. This assumption is based on the higher extinction of A2 which suggests that it may be younger than A1 and would not necessarily host a mixed WR population.
If we assume that only WN5–6 stars contribute to the He ii 4686 line flux i.e. neglecting the WC contribution, we estimate that N(WN5–6)=150 based upon the erg s-1 average He ii line luminosity of 15 LMC WN5–6 stars studied by Crowther & Hadfield (2006). For A2, assuming an internal reddening of E 0.5 mag, we estimate that N(WN5–6)55. Similarly, N(WC4)=20 based upon the average erg s-1 C iv line luminosity of 7 LMC WC4 stars (Crowther & Hadfield, 2006).
Applying the same methodology to region B, we derive a WR population of 75 WN and 25 WC stars.
| Region | A1 | A2 | B1 + 2 |
| E | 0.24 | 0.58 | 0.21 |
| F4686 | 7.4 | 1.1 | 4.0 |
| I4686 | 1.7 | 6.8 | 8.4 |
| L4868 | 2.7 | 1.0 | 1.3 |
| N(WN5–6)† | 150 | 55 | 75 |
| F5808 | 2.0 | — | 2.8 |
| I5808 | 3.8 | — | 4.8 |
| L5808 | 6.0 | — | 7.6 |
| N(WC4)† | 20 | — | 25 |
| F1640 | 2.0 | — | — |
| I1640 | 1.3 | — | — |
| L1640 | 2.1 | — | — |
| N(WN5–6)† | 115 | — | — |
† Numbers derived solely from observed line luminosities based upon average line luminosities of Crowther & Hadfield (2006)
 |
 |
 |
 |
Although WN stars will typically be the primary contributor to the He ii feature, there will be a contribution from the WC population if present. Therefore, to improve upon our initial estimate of the WN content we have estimated the WC contribution to the blue feature by fitting generic LMC WN5–6 and WC4 spectra from Crowther & Hadfield (2006) to the observed blue and red WR bumps. Each region shall now be discussed in turn.
In Figure 5(b) we compare the C iv profile of region A1 with that expected from 20 LMC-like WC4 stars at a distance of NGC 3125. The good agreement confirms our initial estimate. We have then accounted for the contribution of 20 WC4 stars to the blue WR feature, adjusted for the contribution of A2 to the observed flux.
In Figure 5(a) we compare the dereddened, continuum subtracted blue WR feature for cluster A1 with that expected for a mixed WR population of 20 WC4 and 105 WN5–6 stars. The composite spectrum of our generic WR populations reproduces the observed morphology exceptionally well, except for spectral regions where nebular lines are expected (e.g. [Fe iii] 4658, [Ar iv] 4711).
For region B, it was necessary to reduce the number of WC4 stars from 25 to 20 in order to match the observed C iv emission profile (Figure 5(d)). This revised WC population was used to construct the blue WR bump for region B. Figure 5(c) shows that the WC contribution is highly significant, with 50% of the He ii and 90% of the N iii/C iii line flux originating from WC stars. The WN5–6 population is therefore reduced to 40. WR populations derived using this method are included in Table 5.
4.1.2 UV
The WR population of cluster A1 has been independently estimated from the dereddened, slit loss corrected He ii line luminosity. Adopting EB-V=0.24 mag, as derived from H:H, we derive a dereddened line flux of F(1640)=9.4ergs s-1cm-2 based upon an SMC extinction law. For completeness we have considered various extinction laws, and conclude in Section 5.2 that an SMC-extinction law provides the closest match to the complete STIS UV spectral energy distibution. If we neglect the WC contribution to the 1640 line we estimate a stellar content of 115 WN5–6 stars, based upon the average He ii 1640 line luminosity of 1.8erg s-1 from Crowther & Hadfield (2006). Application of an LMC extinction curve, which is less successful at reproducing the UV flux distribution of A1, requires a higher extinction of E mag and a WN population of 200 stars.
Following the same approach as for the optical WR features, we have constructed a He ii profile using generic LMC WN5–6 and WC4 spectra. Generic spectra are taken from Crowther & Hadfield (2006) and are based on low resolution IUE/SWP data for 10 WN5–6 stars and medium resolution HST/FOS data for 6 WC4 stars.
In Figure 6 we compare the SMC law dereddened, far-UV slit loss corrected HST/STIS spectrum of A1, plus the spectrum around He ii 1640 degraded to the 6Å resolution of IUE/LORES – with that for 110 WN5-6 stars from Crowther & Hadfield (2006) adjusted to the distance of NGC 3125. Also illustrated is a synthetic Starburst99 spectrum based upon LMC/SMC template stars for the 1250–1600Å region, this will be further discussed in Section 4.2. The WC contribution to the He ii flux is very minor, reducing the number of typical WN5–6 stars from 115 to 110. This is in excellent agreement with the optically derived WN5–6 population (see Table 5).
| Region | Diagnostic | A1 | A2 | B1 + 2 |
|---|---|---|---|---|
| N(WN5–6) | 4686 | 105 | 55 | 40 |
| N(WN5–6) | 1640 | 110 | ||
| N(WC4) | 5808 | 20 | – | 20 |
| N(WR) | 4686/5808 | 125 | 55 | 60 |
4.2 Estimating the number of O stars
4.2.1 The O star population of individual clusters
The O star content of A1 has been directly estimated by comparing the slit loss corrected, dereddened HST/STIS spectrum of A1 to the best fitting Starburst99 model (SB99, Leitherer et al., 1999). We assume a Kroupa IMF (0.1–100M☉) with a turnover at 0.5M☉ and an exponent of 2.3 for the high mass interval. The Geneva high mass loss rate LMC metallicity model has been adopted. For an empirical LMC/SMC template spectra (Leitherer et al., 2001) we estimate a burst age of 4Myr due to the prominent Si iv 1400 feature, see Figure 6. In contrast, Chandar et al. (2004) estimated 31 Myr. A cluster mass of 2.0 is required to match the UV continuum, indicating an O star content of 550. The N(WR)/N(O) ratio for cluster A1 is therefore 0.2, explaining the large equivalent width of He ii 1640.
If clusters A1 and A2 are coeval and using the flux ratios described in Section 2.1, we find that A2 is slightly more massive, with M=2.2. The O star population of A2 is estimated at 600, giving N(WR)/N(O)0.1.
 |
 |
For region B, the SB99 model was scaled to match the FOC(F220W) and VLT/FORS1 flux levels which indicates a combined mass of 1.6. Given their relative UV fluxes, as described in Section 2.3, and assuming each cluster has an identical E, we estimate that M(B1)=9 and M(B2)=7. SB99 models predict that such bursts should host 250 and 200 O stars, respectively. The O star content derived for these clusters is 450 leading to N(WR)/N(O)=0.1, as in A2. A summary of the cluster O star content and N(WR)/N(O) ratios are presented in Table 6.
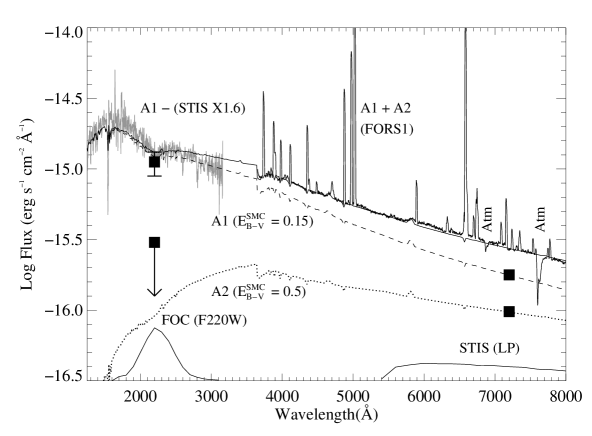
In Figure 7 we compare slit loss corrected VLT/FORS1 and HST/STIS spectra with the combined, reddened, SB99 models for clusters within regions A and B. Individual contributions for each cluster are indicated, together with transmission curves for the FOC/220W and STIS/LP filters. In order for the SB99 flux distributions of each region to match their counterpart VLT/FORS1 spectra, we estimate that E(A1)=0.15 and E(B)=0.11, in excellent agreement with those derived from nebular H/H and UV spectroscopy/photometry. Best agreement between STIS and FORS1 spectroscopy for region A1 was achieved with a slit correction factor of 1.6 versus 1.40.3 obtain from HST/FOC imaging.
4.2.2 The O star population of the Giant H ii regions A & B
In addition to determining the O star content of the individual clusters from their UV/optical continuua, we have derived the number of O stars present in each giant H ii region using the net H flux measured from our VLT/FORS1 narrow-band on- and off-H images.
The observed net H fluxes of regions A and B are erg s, respectively. For internal reddenings of 0.16 and 0.13 mag, these equate to H luminosities of 3.2 and 2.0erg s-1. Measurements were made using apertures 7.0″and 6.0″in diameter for A and B, respectively. These correspond to a physical scale of 350 and 300 pc. From slit spectroscopy, H luminosities are measured to be a a factor of 3 lower.
Accounting for the WR contribution to the ionising continuum, the number of equivalent O7V stars, , can be expressed as
where is the observed Lyman continuum flux and are the average Lyman continuum flux for each stellar type (Vacca & Conti, 1992).
The O star population present in our regions will of course not be restricted to the O7V spectral type, but distributed amongst the entire spectral class. We must therefore account for the age of the population and the IMF when determining the total number of O stars (). As shown by Vacca (1994), is related to the number of equivalent O7V stars, , by
where is the IMF averaged ionising Lyman continuum luminosity for a stellar population, of an given age normalised to one equivalent O7V star.
In recent years a number of papers (i.e. Martins et al., 2002; Crowther et al., 2002) have re-calibrated the spectral type–temperature relation for Galactic O stars, accounting for non-LTE and line-blanketing effects. Studies have shown that a 10% downwards revision in the effective temperature scale of O stars is required, such that for a typical Galactic O7V star decreases by 0.2 dex (Martins et al., 2005). Additionally, recent studies of Magallenic Cloud O stars indicate 2–4kK higher temperatures than their Galactic counterparts (Massey et al., 2005; Heap et al., 2006; Mokiem et al., 2006). Therefore, for this present application we adopt =48.9 for LMC metallicity stars (and would recommend 49.0 for SMC metallicities). For the WR contribution, we adopt , based on the average of 6 WC4 LMC stars (Crowther et al., 2002) and 9 WN5–6 LMC stars (Crowther & Smith, 1996; Crowther & Dessart, 1998).
The parameter has been evaluated using the instantaneous starburst models of Schaerer & Vacca (1998) and measured H equivalent widths (W). We measure W to be 100Å for both regions, suggesting a burst age of 4Myr (Schaerer & Vacca, 1998, their Figure 7). For a burst of this age and a Salpeter IMF, is 0.5 (Schaerer & Vacca, 1998, their Figure 21).
We present derived in this analysis in Table 6. These exceed the continuum derived cluster O star content by an order of magnitude. These would have been reduced by a factor of three had they been derived from H slit spectroscopy. These large difference suggest that NGC 3125 may host additional young massive clusters which are optically obscured.
| Region | A1 | A2 | B1 + 2 |
| UV/optical Spectroscopy | |||
| M() | 2.0 | 2.2 | 1.6 |
| N(O) | 550 | 600 | 450 |
| N(WR)/N(O) | 0.2 | 0.1 | 0.1 |
| H Imaging | |||
| 52.39 | 52.19 | ||
| N(O7V)† | 2000 | 1600 | |
| N(O)† | 4000 | 3200 | |
Recall from Figure 1(d) that region A is exceptionally bright at K. Our combined SB99 flux distributions for clusters A1 and A2 predict that these clusters contribute only 30% of the observed K flux of region A. The addition of a visually obscured cluster (E 1.5 mag), spatially coincident with the optically visible clusters may resolve the observed IR excess for region A. To reconcile the high number of equivalent O7V stars derived from the H image, a cluster with mass 8 and age 1–2Myr would be necessary. Indeed, visually obscured, young massive clusters are common in dwarf irregular starburst galaxies such as NGC 5253 (Turner et al., 2000) and He 2–10 (Vacca et al., 2002).
For region B, clusters B1 and B2 are predicted to contribute 60% of the observed K flux. We do not consider it likely that there is an additional obscured cluster since either B1 or B2 may be somewhat older than 4Myr, such that red supergiants would contribute to the IR excess. In this case, the IR bright sources to the NW of the UV/optically bright clusters would dominate the H ionization from region B if each possess a mass of 2 and an age of 1–2Myr.
5 Comparison with Previous Studies
We will now compare our derived massive stellar content for NGC 3125 with those published in the literature. Optically derived properties will be compared with Kunth & Sargent (1981), Vacca & Conti (1992) and Schaerer et al. (1999) whereas UV comparisons will be made to the HST/STIS survey of Chandar et al. (2004).
| KS81 | VC92 | S99 | This study | |
|---|---|---|---|---|
| EB-V(Gal+Int) | 0.4 | 0.08+0.4 | 0.25+0.27 | 0.08+0.16 |
| F(4686)A | 8.2 | 7.32 | 8.2 | 8.5 |
| L(4686)A | 1.3 | 6.1 | 7.9 | 2.7 |
| F(5801)A | – | – | 3.5 | 2.0 |
| L(5801)A | – | – | 2.2 | 6.0 |
| EB-V(Gal+Int) | 0.08+0.64 | 0.25+0.44 | 0.08+0.13 | |
| F(4686)B | 4.3 | 4.9 | 4.0 | |
| L(4686)B | – | 8.2 | 8.4 | 1.3 |
| F(5801)B | – | – | 6.0 | 2.8 |
| L(5801)B | – | – | 2.2 | 7.6 |
5.1 Optical Studies
Table LABEL:tab:comp compares the measured line fluxes for He ii 4686 and C iv5808 for regions A and B in the present study to those from the literature, showing, in general, very good agreement. Differences in line luminosities (for a uniform distance), and hence WR content, relate primarily to reddening. Recall from Section 8, Kunth & Sargent (1981) derived reddenings from high Balmer lines, neglecting corrections for stellar absorptions. Vacca & Conti (1992) obtained reddenings from H/H observed during different conditions. Schaerer et al. (1999) applied erroneous reddenings from the literature, including a foreground extinction of EB-V=0.25 rather than AV=3.1EB-V=0.25, although their assumed total extinction fortuitously closely agrees with Vacca & Conti.
The major uncertainty in the derived WR content (for our derived reddening) result from the adopted line luminosity calibration. For WN subtypes, Kunth & Sargent (1981) adopted a dominant mid-type WN population due to the marginal detection of N iv 4058 emission. We support this on the basis that both N iv 4603-20 and N iii 4634-41 are weak due to the contribution by C iii 4650 from WC stars (recall Figure 5). In contrast, Vacca & Conti (1992) and Schaerer et al. (1999) adopted a dominant late-type WN population, albeit with a similar He ii line luminosity due to their inclusion of WN6 subtypes.
For WC subtypes, both Schaerer et al. (1999) and the present study adopt a dominant early-type WC population on the basis that C iii is weak/absent. Both studies adopt a similar C iv line luminosity as Crowther & Hadfield (2006) support the earlier result of Smith et al. (1990b) using an increased LMC sample.
Previous studies of the O star populations have been based on H fluxes derived from slit spectroscopy. Kunth & Sargent (1981) and Vacca & Conti (1992) assume WR stars do not contribute to the Lyman continuum and estimate O star populations of 2000–2400. Schaerer et al. (1999) derived O star populations from H spectroscopic line fluxes, but with the addition of correcting for the WR contribution and the evolution of the O star population, revising the O star numbers for NGC3125-A and -B to 3240–6470 and 3450–6900, respectively. In contrast, this study has derived O star populations using H imaging for the Giant H ii regions, plus Starburst99 continuum fits to UV/optical spectroscopy for the clusters. For the latter, plus reduced reddenings, we estimate N(O)=1 100 and N(O)=450. Differences between these and previously published results are again primarily attributed to adopting lower reddenings.
5.2 UV Studies
In Section 4.1.2 we have derived a content of 110 WN5-6 stars for NGC 3125-A1 from the HST/STIS He ii line flux, whilst Chandar et al. derived a content of 5000 late WN stars from the same dataset (using an extraction window of 15 pixels versus 13 pixels here, and neglecting slit losses). The origin of this major difference is not due to the assumed intrinsic He ii line luminosity, since we assume a higher value of 1.8 erg s-1 per WN star (Crowther & Hadfield, 2006) versus 1.2 adopted by Chandar et al. (2004). As with the optical data, we have found that the difference between WR populations derived here and those published by Chandar et al. can be readily explained by differences in the adopted internal extinction law.
The Calzetti et al. (1994) law was obtained using IUE large aperture (1020″) observations of distant starbursts with a median distance of 60 Mpc, i.e. a physical scale of 3 kpc. These observations sample a composite of stars and gas, suffering different extinction properties. In contrast, the SMC law of Bouchet et al. (1985) was obtained from IUE observations of individual stars at a distance of 60 kpc, i.e. a physical scale of 3 pc. Consequently, our HST/STIS spectroscopy (0.20.3″) of cluster A1, sampling a physical scale of 1015 pc, is most naturally suited to a low metallicity stellar extinction law since the aperture is dominated by stellar extinction properties rather than interstellar gas.
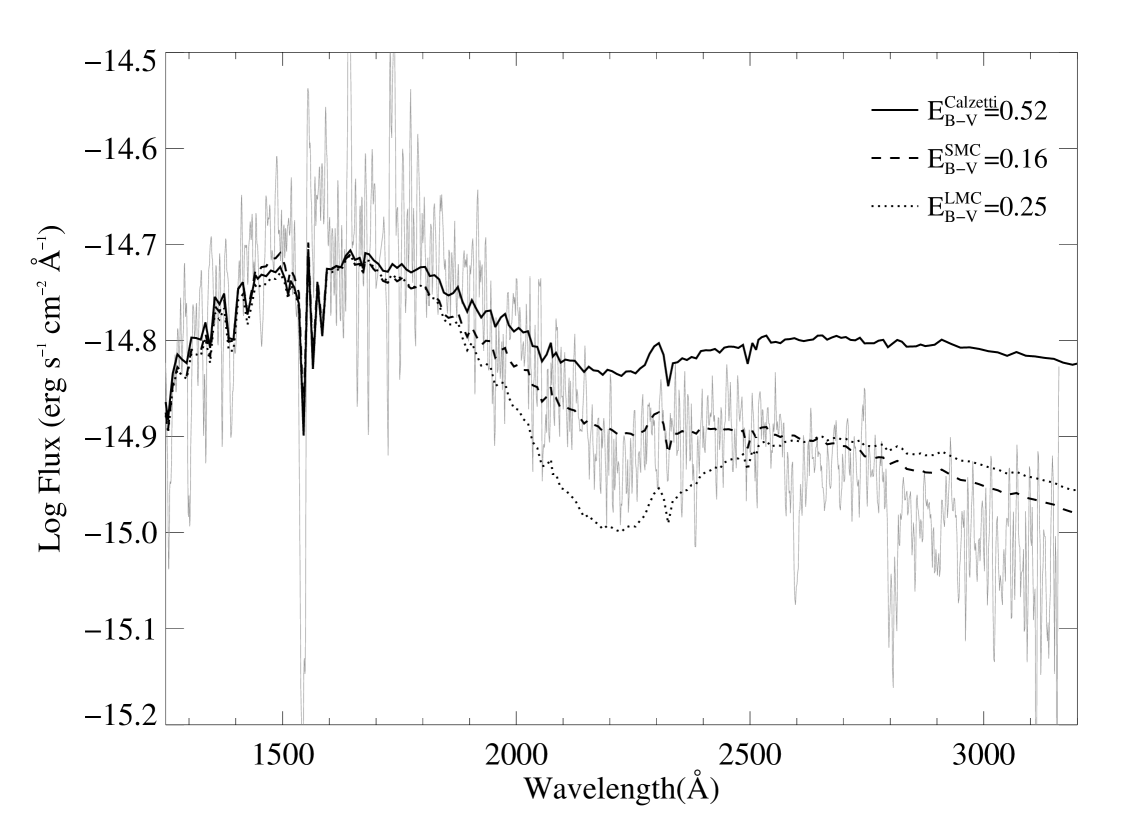
In Figure 8 we compare the complete STIS spectrum of cluster A1 with various 4Myr, LMC metallicity SB99 SED (Section 4.2) that have been reddened to reproduce the observed 1250 – 1600Å continuum flux distribution. For the first example the SED has been reddened using a starburst extinction law for which we obtain E=0.52, as derived by Chandar et al. (2004). A cluster mass of 2 is needed to match the observed 1600Å continuum flux. However, the SED is highly discrepant in the near-UV, in the sense that the predicted continuum flux is 60% too high. Indeed, if had selected a Chandar et al. had selected a different wavelength interval (e.g. 1600–2000Å) they would have derived a significantly lower reddening (e.g. E=0.4 mag) for the same Calzetti et al. law.
In Figure 8 we also include SB99 spectral energy distributions reddened to match the 1250–1600Å slope using the SMC (Bouchet et al., 1985) and LMC (Howarth et al., 1983) extinction laws. The former shows good overall agreement, using E=0.16 and M = 2.0 , including the weak 2175Å feature and gives the closest match to the observed continuum flux in the near-UV. For the LMC law, the far-UV slope is reproduced with E=0.25 (3.5 ). In this case, however, the 2175Å feature is overestimated and the near-UV continuum flux is poorer than that for the SMC extinction law.
Consequently, it is not possible to derive a consistent reddening for NGC 3125-A1 using a starburst SED with either a LMC or Calzetti extinction law. In contrast, we obtain an excellent match to the observed UV SED for our optically derived reddening with a starburst spectral energy distribution and a SMC extinction law and an internal extinction in excellent agreement with our nebular derived H/H reddening.
6 Conclusions
We have demonstrated that the WR populations of the two regions NGC 3125-A and B are substantially lower than previous optical studies, and dramatically lower than previous UV studies of the bright cluster A1 within the giant H ii region A. Indeed, previous highly discrepant UV and optical results for NGC 3125-A may be reconciled using a H:H derived reddening and a SMC extinction law for the internal extinction. We have obtained refined WR populations in these regions by applying template spectra of typical WN and WC stars to the blue 4686 bump, which indicate that WC stars, may contribute significantly to the observed 4640 feature, commonly attributed solely to N iii 4640 from late WN stars.
Chandar et al. (2004) argued that the presence of strong He ii emission in A1 implies an exceptional WR population with N(WR)/N(O)1. However, evolutionary models for single stars at LMC metallicities predict a maximum N(WR)/N(O) ratio of 0.1 for an instantaneous burst (Schaerer & Vacca, 1998), whilst we estimate values of N(WR)/N(O)0.1–0.2 for clusters within the giant H ii regions NGC 3125-A and B. Consequently, our results broadly reconcile the observed massive stellar content of NGC 3125-A and B with evolutionary predictions for a young LMC metallicity starburst.
The primary difference between the two UV studies was the choice of extinction law. A standard starburst extinction law is ideally suited to spatially unresolved stellar galaxies, such as high z LBGs, but when combined with a starburst spectral energy distribution is unable to reproduce the UV spectrum of a resolved star cluster such as NGC 3125-A1 or Tol 89-1 (Sidoli et al., 2006). In such cases, a SMC (or LMC) reddening law is necessary to correct the complete UV spectrum for extinction. Consequently, He ii results for other nearby WR clusters studied by Chandar et al. should be treated with caution for the present.
We have also demonstrated that the O star content derived from H narrow band imaging is substantially higher than that estimated from continuum flux techniques. On the basis of near-IR imaging of NGC 3125 we propose that the discrepancy for region A can be resolved by the presence of an additional cluster which is optically obscured. Such clusters appear to be common in LMC-like metallicity starburst galaxies such as NGC 5253 and He2–10 (Turner et al., 2000; Vacca et al., 2002). For region B, the O star content may be resolved by the identification of two additional knots to the NW of region B which are bright at near-IR wavelengths.
The present study emphasises the need for the highest possible spatial resolution. We have attempted to evaluate the properties of the two optically visible clusters within region A based upon a pair of broadband ultraviolet (FOC) and far-red (STIS) flux ratios, plus the properties of the clusters within region B from a single, composite ultraviolet measurement. Refined properties for clusters within NGC 3125 require high spatial resolution datasets spanning the ultraviolet to near-infrared, as recently undertaken by program GO 10400 (R. Chandar, P.I.) using the HST Advanced Camera for Surveys (ACS) and Near infrared Camera and Multi-Object Spectrometer (NICMOS).
Acknowledgements
We wish to thank Bill Vacca for providing us with the “red” CTIO spectrum of NGC 3125-A and for various communications which helped with the analysis. We also appreciate suggestions made by an anonymous referee which helped improve the manuscript. Some of the data presented in this paper were based on observations made with the NASA/ESA Hubble Space Telescope, obtained from the data archive at the Space Telescope Institute. STScI is operated by the association of Universities for Research in Astronomy, Inc. under the NASA contract NAS 5-26555. LJH acknowledges financial support from PPARC, PAC acknowledges financial support from the Royal Society.
References
- Bouchet et al. (1985) Bouchet P., Lequeux J., Maurice E., Prevot L., Prevot-Burnichon M. L., 1985, A&A, 149, 330
- Calzetti et al. (1994) Calzetti D., Kinney A. L., Strchi-Bergmann T., 1994, ApJ, 429, 582
- Chandar et al. (2004) Chandar R., Leitherer C., Tremonti C. A., 2004, ApJ, 604, 153
- Crowther & Dessart (1998) Crowther P. A., Dessart L., 1998, MNRAS, 296, 622
- Crowther et al. (2002) Crowther P. A., Dessart L., Hillier D. J., Abbott J., Fullerton A. W., 2002, A&A, 392, 653
- Crowther & Hadfield (2006) Crowther P. A., Hadfield L. J., 2006, A&A, accepted
- Crowther et al. (2002) Crowther P. A., Hillier D. J., Evans C. J., Fullerton A. W., De Marco O., Willis A. J., 2002, ApJ, 579, 774
- Crowther & Smith (1996) Crowther P. A., Smith L. J., 1996, A&A, 305, 541
- Heap et al. (2006) Heap S. R., Lanz T., Hubeny I., 2006, ApJ, 638, 409
- Heckman (1998) Heckman T. M., 1998, ASP, 148, 127
- Howarth et al. (1983) Howarth S. B., Rappaport S., Politano M., 1983, MNRAS, 203, 301
- Hummer & Storey (1987) Hummer D., Storey P. J., 1987, MNRAS, 224, 801
- Kennicutt (1984) Kennicutt R., 1984, ApJ, 287, 116
- Kunth & Sargent (1981) Kunth D., Sargent W., 1981, A&A, 101, L5
- Lauberts & Valentijn (1989) Lauberts A., Valentijn E. A., 1989, The surface photometry catalogue of the ESO-Uppsala galaxies. European Southern Observatory, Garching
- Leitherer et al. (2001) Leitherer C., Leao J. R. S., Heckman T. M., Lennon D. J., Pettini M., Robert C., 2001, ApJ, 550, 724
- Leitherer et al. (1999) Leitherer C., Schaerer D., Goldader J. D., Gonzalez Delgado R. M., Carmelle R., 1999, ApJS, 123, 3
- Madau et al. (1996) Madau P., Ferguson H. C., Dickinson M., 1996, MNRAS, 283, 1388
- Martins et al. (2002) Martins F., Schaerer D., Hillier D. J., 2002, A&A, 382, 999
- Martins et al. (2005) Martins F., Schaerer D., Hillier D. J., 2005, A&A, 287, 803
- Massey et al. (2005) Massey P., Puls J., Pauldrach A. W. A. amd Bresolin F., Kudritzki R. P., Theodore S., 2005, ApJ, 627, 477
- Mokiem et al. (2006) Mokiem M. R., de Koter A., Evans C. J., et al 2006, A&A, submitted
- Russell & Dopita (1990) Russell S. C., Dopita M., 1990, ApJS, 74, 93
- Schaerer et al. (1999) Schaerer D., Contini T., Pindao M., 1999, A&A, 341, 399
- Schaerer & Vacca (1998) Schaerer D., Vacca W. D., 1998, ApJ, 497, 618
- Schlegel et al. (1998) Schlegel D. J., Finkbeiner D. P., Davis M., 1998, ApJ, 500, 525
- Seaton (1979) Seaton M. J., 1979, MNRAS, 187, 73p
- Shapley et al. (2003) Shapley A. E., Steidel C. C., Pettini M., Adelberger K. L., 2003, ApJ, 588, 65
- Sidoli et al. (2006) Sidoli F., Smith L., Crowther P. A., 2006, MNRAS, submitted
- Smith et al. (1990a) Smith L. F., Shara M. M., Moffat A. J., 1990a, ApJ, 358, 229
- Smith et al. (1990b) Smith L. F., Shara M. M., Moffat A. J., 1990b, ApJ, 348, 471
- Smith et al. (1996) Smith L. F., Shara M. M., Moffat A. J., 1996, MNRAS, 281, 229
- Steidel et al. (1996) Steidel C. C., Giavalisco M., Pettini M., Dickinson M., Adelberger K. L., 1996, ApJ, 462, L17
- Turner et al. (2000) Turner J. L., Beck S. C., Ho P. T. P., 2000, ApJ, 532, L109
- Vacca (1994) Vacca W., 1994, ApJ, 421, 140
- Vacca (2005) Vacca W., 2005, private communication
- Vacca & Conti (1992) Vacca W., Conti P., 1992, ApJ, 401, 543
- Vacca et al. (2002) Vacca W., Johnson K. E., Conti P. S., 2002, AJ, 123, 772