2005 \SetConfTitleLatin American Regional IAU Meeting, Pucon, Dec 2005
High Resolution Spectra of Novae and the Quadratic Zeeman Effect
Abstract
High resolution spectra of novae after outburst reveal distinctive characteristics in the line profiles and intensities. The higher Balmer lines are often broader than the lower members of the series, and the relative profiles and intensities of the [O I] 6300, 6364 doublet differ from normal values. We suggest these features may be caused by the Quadratic Zeeman Effect from magnetic fields exceeding B=106 gauss. Taken together the emission and absorption lines point to multiple origins for the ejecta on both the erupting white dwarf and the cool secondary star.
Stars: Classical novae \addkeywordStars: Polars
0.1 Introduction
Emission line spectroscopy has been done predominantly at low to moderate resolutions in recent years because many of the important diagnostics require only relative line intensities. Larger telescopes with more efficient instruments now allow high spectral resolution data to be obtained for many objects, and these provide additional information that is useful for spectral analysis. Among the advantages of high spectral resolution are the (1) detection of faint features and narrow lines that escape detection at lower resolution, (2) resolution of blends into individual lines, and (3) measurement of line profiles, which provide kinematic information on the emitting gas.
The larger number of lines that are detected in deep, high resolution spectra, many of which are very faint and have not been observed previously, make correct line identification a major undertaking. Electronic databases of atomic transitions now exist which make this task perfectly suited to computer algorithms. A line identification algorithm named EMILI has been developed by Sharpee et al. (2003) that is largely automatic and which is based upon the extensive compilation of transitions by van Hoof in the v2.05 Atomic Line List (http://www.pa.uky.edu/peter/newpage/). Continued work is underway to improve EMILI by refining the criteria by which the line identifications are made, with the goal of eventually including molecular species in the lookup database. Since proper line identification is the essential first phase of all spectral analysis it is important for high signal-to-noise, high resolution spectroscopy that these efforts be carried forward.
0.2 Novae spectra at high resolution
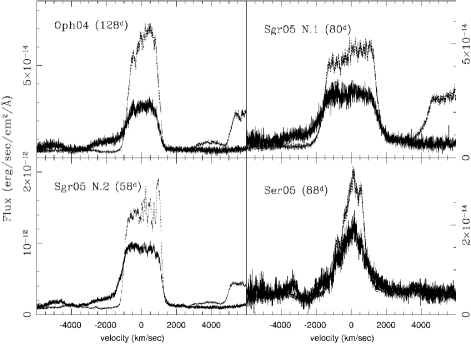
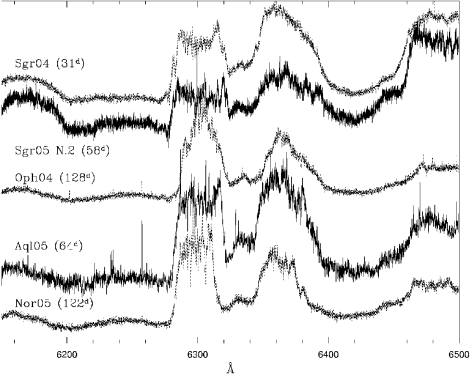
Two important goals of high resolution spectroscopy are the detection of features that are not observed at lower resolution and the measurement of line profiles. We have collaborated on a spectroscopic survey of southern postoutburst novae for the past two years using the ESO fiber optics echelle spectrograph FEROS (R=48,000) on the 2.2m telescope, and certain key features of novae spectra have emerged that were not apparent from the spectra of previous lower resolution studies such as the CTIO survey (Williams et al. 1991). These include (1) the presence of Na I D absorption shortly after maximum in almost every nova, (2) the systematic shift of emission lines of H and He to more positive radial velocities than those of the forbidden lines, (3) a large fraction of novae that have progressively larger line widths for the higher lines in the Balmer series, and (4) clearer evidence of the differences in the line profiles and relative intensities of [O I] 6300 and 6364, with 6364 always being the broader line. The first two of these characteristics can be accounted for straightforwardly by the ionization and kinematics of the ejected gas, however the cause of the last two are less clear. Optical depth effects can explain both the relative differences between the Balmer lines and the [O I] doublet line widths, however in this case the lower Balmer lines and [O I] 6300 should be the broader of the lines. But, the opposite is observed, as is shown in Figs. 1 and 2. These unusual characteristics are not observed in other emission-line objects and are probably due to the unusual and extreme conditions associated with the outburst. Table 1 lists some relevant line widths measured from selected spectra in our database. We suggest here that the differing line widths may be the result of a breakdown in normal LS-coupling caused by very high electromagnetic field strengths.
0.3 The Zeeman effect
Strong magnetic or electric fields change bound energy levels such that normal relationships governing transitions are highly modified (Herzberg 1945). The presence of forbidden lines in the spectra, which are collisionally suppressed at high densities, makes the Stark effect a less likely influence on the spectral features than high magnetic fields because the Stark effect requires high densities. Furthermore, it is already demonstrated that the class of CVs known as polars, of which the classical novae V1500 Cygni/1975 and DQ Herculis/1934 are examples, have strong magnetic fields that exceed B=106 gauss (Kaluzny & Chlebowski 1988; Warner 1995). The Zeeman effect is therefore a plausible explanation for some of the anomalous line behavior observed in postoutburst novae.
The normal Zeeman effect produces line broadening from level splitting, by removing the degeneracy of magnetic substates, but it does not greatly modify the intensities of entire multiplets relative to each other. On the other hand, the Quadratic Zeeman effect (QZE), which dominates the normal Zeeman effect for field strengths exceeding B=106 gauss (Jenkins & Segre 1939; Preston 1970; Garstang & Kemic 1974) results in much broader features, and it also leads to the emergence of normally forbidden transitions that become very intense at high field strengths and that dominate the multiplet. The higher Balmer lines originate from higher angular momentum l-states and are therefore subject to greater Zeeman splitting, i.e., broadening, both from the normal and quadratic effect.
In normal, low field strength conditions [O I] 6300 and 6364 originate from the same upper level and have an intensity ratio of 3:1, and they have identical line profiles. The QZE alters this by modifying transition strengths and producing additional multiplet components, such as the normally completely LS-forbidden transition. One can see from the [O I] profiles shown in Fig. 2 that an emission feature, or component, appears near wavelengths 6330 in all of the spectra that show the [O I] emission. This could be a normally forbidden transition that emerges only in a strong magnetic field. The fact that this same behavior is not observed for the [O III] 4959,5007 doublet might be attributed to the fact that the QZE is most pronounced in neutral atoms (Jenkins & Segre 1939), and [O III] originates in a region of lower field strength.
Quantitative calculations need to be carried out to determine whether the QZE can explain the distinctive aspects of novae spectra described here because the few existing calculations of the QZE apply only to H and He I. Ab initio, one would expect the more highly ionized gas, not [O I], to occupy the regions close to the white dwarf where the magnetic field is the strongest. There is one clear observational test of the Zeeman effect in novae, and that is that lines strongly influenced by the QZE, as we suggest for the Balmer lines and [O I], should be circularly polarized (Preston 1970; Pavlov & Shibanov 1976). A rapidly rotating, inhomogeneous magnetic field will lead to global cancellation between the varied local polarization vectors, but one would still expect some novae to exhibit substantial circular polarization in these transitions.
In fact, spectrapolarimetry observations using broad passbands have been made for a handful of novae in the past decade, looking for linear polarization which has been detected at the 1% level (Johnson et al. 1997). The observed polarization has been attributed to electron scattering and dust from an asymmetric shell, but an alternative explanation is that it could be residual linear polarization produced by the QZE. Spectrapolarimetric observations of both linear and circular polarization in the Balmer lines following outburst, carried out on large telescopes at moderately high spectral resolution to isolate the lines, should be made as an observational test to determine to what extent the Zeeman effect, and especially the QZE, influences novae spectra.
| OBJECT | EPOCH | H | H |
|---|---|---|---|
| Sgr05 N. 1 | \phn48 | 3500 | 2600 |
| \phn80 | 3041 | 2640 | |
| Sgr05 N. 2 | \phn\phn3 | 1754 | 1893 |
| \phn58 | 2150 | 1875 | |
| \phn81 | 2045 | 1868 | |
| Oph04 | 128 | 1880 | 1517 |
| Sco04 N. 2 | \phn43 | 3743 | 3256 |
| Ser05 | \phn88 | 1828 | 1455 |
0.4 Post-outburst geometry
The geometry of the novae ejecta can be pieced together from the behavior of the postoutburst spectra, and the absorption lines provide key information. One of the most common features of the spectra near maximum light is the strength of the Na I D absorption, and that of the Fe II. There are often multiple components and the absorption features typically migrate to shorter wavelengths, i.e., increasing radial velocities, and weaken over timescales of days before disappearing. Fig. 3 shows this behavior for Nova V2574 Oph/04. Given the large explosive energy production of the outburst the presence and persistence of Na0 (and Fe+) is unexpected because it is so easily destroyed by ionization in energetic situations due to its low ionization potential of 5eV. The most plausible source for this absorbing gas is the cool secondary star in the nova system with perhaps some contribution from the outer accretion disk.
There is always present a high velocity postoutburst wind from the white dwarf of 500 km/s, evident from both the broad emission lines and the broad absorption normally seen in higher ionization species such as He I 5876 that typically persists for weeks to months following the outburst. The wind impacts the accretion disk and the secondary star and almost certainly dislodges gas from the outer layers of the Roche-lobe filling secondary, which is only weakly bound to the star. Such situations can give rise to a momentum transfer ’snow plow’ phase with little energy transfer, similar to that which occurs in blast waves where gas is accelerated to high velocities while maintaining a low internal temperature through radiation (Ostriker & McKee 1988).
Based on the above considerations the general geometry of the ejecta producing the postoutburst spectra of novae consists of two components: a low density, high velocity, ionized wind originating on the white dwarf, and higher density, lower velocity filaments of gas that have been stripped off the secondary star and the disrupted accretion disk, and which are accelerated to high velocities by the WD wind. The two components mix with each other, with the higher density material that originates in the star and disk being more concentrated in the plane of the binary orbit and tending to dissipate as it is accelerated by the wind. The observed absorption spectrum it therefore dependent on the inclination of the system. The emitting gas consists of a mixture of nuclear processed, high velocity gas from the white dwarf and unprocessed material from the secondary star and disk, and the interpretation of the abundances of the emitting gas should take into account the mixture of the two components.
Series of high resolution spectra covering a broad wavelength regime and obtained at different epochs following the outburst present a detailed picture of postoutburst novae. We are preparing a presentation of the data from the FEROS survey in a separate publication, including a more detailed description and interpretation of the spectra.

References
- (1) Garstang R. H. & Kemic S. B., 1974, Ap&SS., 31, 103
- (2) Herzberg G., 1945, Atomic Spectra and Atomic Structure, Dover: New York
- (3) Jenkins F. A. & Segre E., 1939, Phys Rev, 55, 52
- (4) Johnson J. J. et al., 1997, AJ, 113, 2200
- (5) Kaluzny, J. & Chlebowski, T., 1988, ApJ, 332, 287
- (6) Ostriker, J. P. & McKee, C. F., 1988, RvMP, 60, 1
- (7) Pavlov, G. G. & Shibanov, I. A., 1976, AstZh, 53, 63
- (8) Preston G. W., 1970, ApJ, 160L, 143
- (9) Sharpee B., Williams R. E., Baldwin J., & van Hoof P. A. M., 2003, ApJSupp, 149, 157
- (10) Warner B., 1995, Cataclysmic Variable Stars, Cambridge University Press
- (11) Williams R. E., Hamuy M., Phillips M. M., Heathcote S. R., Wells L., Navarrete M., 1991, ApJ, 376, 721 \adjustfinalcols