11email: lferetti@ira.inaf.it 22institutetext: AIM - UMR N∘ 7158 CEA - CNRS - Université Paris VII, DSM/DAPNIA/Service d’Astrophysique, CEA/Saclay, L’Orme des Merisiers, Bât. 709, 91191 Gif-sur-Yvette, France 22email: dneumann@cea.fr
XMM-Newton observations of the Coma cluster relic 1253+275
Abstract
Aims. Using XMM Newton data, we investigate the nature of the X-ray emission in the radio relic 1253+275 in the Coma cluster. We determine the conditions of the cluster gas to check current models of relic formation, and we set constraints on the intracluster magnetic field.
Methods. Both imaging and spectral analysis are performed, and the X-ray emission is compared with the radio emission.
Results. We found that the emission is of thermal origin and is connected to the sub-group around NGC 4839. The best-fit gas temperature in the region of the relic and in its vicinity is in the range 2.8 4.0 keV, comparable to the temperature of the NGC 4839 sub-group. We do not detect any high temperature gas, resulting from a possible shock in the region of the Coma relic. We therefore suggest that the main source of energy for particles radiating in the radio relic is likely to be turbulence. From the X-ray data, we can also set a flux upper limit of erg cm-2 s-1, in the 0.3 10 keV energy range, to the non-thermal emission in the relic region. This leads to a magnetic field B 1.05 G.
Key Words.:
Galaxies: clusters: general – Galaxies: clusters: individual: Coma – Intergalactic medium – X-rays: galaxies: clusters1 Introduction
Some clusters of galaxies show diffuse extended radio emission in their outskirts, indicating the presence of relativistic particles and magnetic fields in the intracluster medium (ICM). These radio sources are commonly called radio relics. Their steep radio spectra indicate that the radiating particles have short lifetimes ( 108 yr), linked to synchrotron and inverse Compton (IC) radiation losses, and thus are reaccelerated by some mechanism that acts with an efficiency comparable to the energy loss processes.
Current theoretical models predict that relativistic particles radiating in radio relics are powered by energy dissipated in shock waves produced during the cluster formation. This picture is supported by recent numerical simulations on cluster mergers (Ryu et al. 2003), in which shock waves are present at the cluster periphery. It has been suggested that the electron acceleration required to produce the relic emission results from Fermi-I diffusive shock acceleration of thermal ICM electrons (Enßlin et al. 1998) or by the adiabatic energization of relativistic electrons confined in fossil radio plasma that was released by a formerly active radio galaxy (Enßlin & Gopal-Krishna 2001, Enßlin & Brüggen 2002).
To test theoretical models, X-ray data are needed to determine the physics of the ICM in the radio relic regions. In this paper we analyze XMM-Newton data of the Coma radio relic 1253+275. This source is the prototype of cluster relic sources (Giovannini et al. 1991 and references therein). It is located at the Coma cluster periphery in the SW direction, beyond the galaxy group associated with NGC 4839, at 75′ from the cluster center. This location corresponds to a projected distance of 2.1 Mpc. The structure of the Coma radio relic is elongated with the major axis of 840 kpc and is roughly tangential to the Coma cluster radius. The integrated spectrum is fairly straight between 150 MHz and 5 GHz, with a spectral index = 1.18 (Thierbach et al. 2003).
We performed an imaging and spectral analysis of archival XMM-Newton data, to derive the properties of this relic and to shed more light on its physical origin. This is the first detailed study of the X-ray properties of a radio relic.
We assume the concordance cosmology with H0=70 km s-1 Mpc-1, = 0.3, and = 0.7. At the redshift of the Coma cluster, z = 0.023, the angular scale of 1′ corresponds to a linear size of 28 kpc.
2 XMM-Newton observations and data treatment
The region of the Coma radio relic was observed with XMM-Newton for a total of 22 ksec on June 10 2003. We retrieved the data from the archive and pipeline processed them using SAS version 6.5. We followed the guidelines in the XMM-Newton ABC-guide (Snowden et al. 2004) for the data preparation. We screened the XMM-Newton observation for time intervals of high background emission (flares), which can contaminate XMM-Newton observations. We examined lightcurves of the observations in two energy bands: first in the 10-12 keV (12-14 keV) energy band for MOS (pn) data (see also Majerowicz et al. 2004) and subsequently in the 0.3-10 keV energy band (see Nevalainen, Markevitch & Lumb 2005 for details on flares). After the flare selection, exposure times are of 17(8) ksec for the MOS (pn) cameras.
We used the weight method for the vignetting correction, attributing a weight factor to each event (Arnaud et al. 2001). Since there is extended low surface brightness emission in the region, we need to correct for the background. For this we used blank sky observations compiled by A. Read (Read & Ponman 2003), which we screened for flares in the same way as in the Coma relic observations 111We also tried the background files from Nevalainen, Markevitch & Lumb (2005); however, using these files after additional flare screening we obtained fit results with values higher than those obtained using Read’s background files..
3 Results
3.1 Imaging analysis
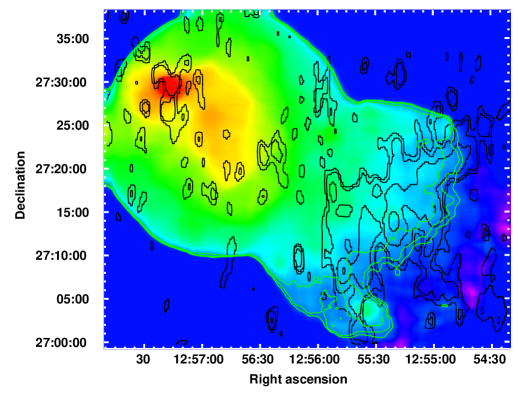
We chose for the imaging analysis the energy band 0.3-2 keV, since it allows the best signal-to-noise ratio (see also Scharf 2002). Figure 1 shows the filtered count-rate image of the MOS cameras in this energy band. Two XMM-Newton observations were merged together for this image: the data taken in the PV-phase of the sub-group around NGC 4839 (Neumann et al. 2001) and the observations described here. The PV-phase data (latest pipeline processing) were treated in the same way as the Coma relic observations. Figure 1 is vignetting-corrected and background-subtracted using the above-mentioned blank sky observations. As can be seen from the image, the X-ray emission around the sub-group extends into the radio relic region and shows a strikingly similar outer boundary. It is clear that the X-ray emission in the relic region comes from the sub-group. It cannot originate from the Coma cluster itself, as seen when extrapolating the beta-model derived by Briel, Henry & Böhringer (1992). In fact, the Coma cluster emission at these radii is more then 20 times fainter than what is observed.
3.2 Spectral analysis
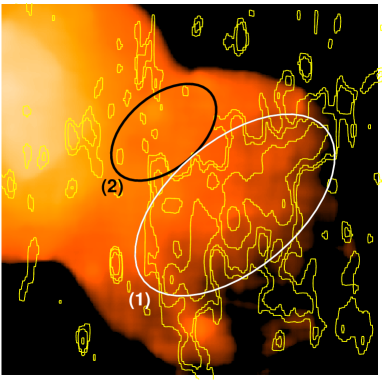
To check for the presence of a shock wave and of non-thermal emission, we selected two regions for the spectral analysis (Fig. 2): one ellipse of 600 330 kpc2 in the relic region (1) and another ellipse of 310 190 kpc2 to the NE of the relic towards the Coma cluster (2). The total number of source photons in the 0.3-10 keV band in regions (1) and (2) is 13520 and 10620, respectively. In these regions, the source count-rate in the 0.3-10 keV energy band is similar to the background count-rate.
Table 1 shows the results of the spectral fitting analysis with XSPEC. For this study, we used the latest response matrix files avalable at ESA’s XMM-Newton homepage and the on-axis auxiliary reponse files describing the effective area of each camera as a function of photon energy. We chose the corresponding background regions in the same detector coordinates. There is an intensity variability in the instrumental background of XMM-Netwon. To correct for this effect, we compared the source and background count-rates in the 10-12 keV (12-14) keV energy band for the MOS (pn) cameras over each entire camera (see Majerowicz et al. 2004 for details). The ratio of the count-rates is used as the normalization factor of the background to the source spectrum. The normalization value in our case is about 1.2, which indicates that the instrumental background in our observation is higher than the instrumental background in the blank sky observations. The chosen background normalization of 1.2 provides the lowest results. Varying the normalization factor, the changes of the spectral fitting results are always within the error bars.
| Reg. | model | kT/ | nH | red. | |
|---|---|---|---|---|---|
| keV / | cm-2 | ||||
| 1 | th. | 1.16 | |||
| 1 | th./ n-th. | /2.2 | 1.17 | ||
| 2 | th. | 1.41 |
Note. Confidence intervals of the parameters are at 90% level.
We fit both a thermal model and a combined thermal/non-thermal model with a fixed power law index of 2.2, derived from the radio spectrum (see Sect. 4.2), to the relic region. Both fits give consistent results and point to a thermal origin of the X-ray emission, since the combined fit gives a non-thermal component contribution consistent with zero. A spectral fit with only a non-thermal component of does not provide an acceptable fit, giving a higher reduced and a nH value of cm-2, i.e. an order of magnitude higher than the observed value of cm-2 (Dickey & Lockman 1990). Moreover, a thermal-model fit applied to the region NE of the relic provides a gas temperature fully consistent with that of the relic region. The relatively high reduced value in this region can be explained by residuals in the instrumental background subtraction, which are amplified by the vignetting correction.
The non-thermal emission in the relic region, if at all detectable with XMM-Newton, would be much lower than the thermal emission. We calculate the upper limit of this non-thermal component in two ways: a) spectral fitting, which gives a maximum flux in the 0.3 10 keV band of erg cm-2 s-1, and b) imaging analysis. For the latter, since no excess X-ray emission directly related to the relic is detected, we can calculate how much of this emission can be “hidden”. Assuming Poisson statistics, we estimate that this is erg cm-2 s-1, which is in excellent agreement with the value obtained from the spectral analysis. We adopt as an upper limit of the non-thermal component the more conservative value, i.e. erg cm-2 s-1.
4 Discussion
The results of this paper can be summarized as follows:
a) There is extended X-ray emission in and around the Coma relic region, which is connected to the sub-group around NGC 4839. The group is on its first infall onto the cluster, with velocity 1700 km s-1, as suggested from optical data by Colless & Dunn (1996), and as further demonstrated by the effects of ram pressure stripping detected from XMM-Newton data that indicate the infall direction (Neumann et al. 2001).
b) The best-fit gas temperatures in the region of the relic and in its vicinity (NE region) are very similar, around 3.3 keV. This value is lower than the keV found in the main body of the NGC 4839 sub-group (Neumann et al. 2001), although the difference is marginally significant. However, what is most remarkable is that we do not detect any high temperature gas, which could indicate the presence of a shock at the location of the Coma relic.
c) The emission of the relic is largely dominated by thermal emission. This is deduced by the spectral fit analysis and is also supported by the following arguments: i) the X-ray emission is connected to the hot gas of the NGC 4839 sub-group, and ii) there are no distinct X-ray features connected to the radio relic itself. We can only set a flux upper limit of erg cm-2 s-1 in the 0.3-10 keV band for the non-thermal component.
A brief discussion of the implications of our results follows.
4.1 Merging process and relic formation
According to current models, the relativistic electrons radiating in radio relics are expected to be accelerated by shocks originating from cluster mergers. In a fully ionized plasma, a shock with compression factor and Mach number can accelerate particles to a power law distribution in momentum, with slope (Drury 1983). The spectral index of the radio emission is thus related to the Mach number of the shock by the relation: . In this framework, the Coma relic with spectral index = 1.18 should originate from particles accelerated by a shock of Mach number M 2. In the case of a monoatomic gas, the ratio between the post-shock and pre-shock temperatures and is given by (see, for example, Sarazin 2002). This implies that the temperature jump across a shock of Mach number M 2 is 2.1, which is not observed in our data.
The above calculations refer to the simplest case. More rigorously, one should consider a) the effect of electron ageing on the observed steep radio spectrum, b) the influence of magnetic field on the shock parameters, c) the case of re-acceleration of relativistic particles, leading to possibly higher Mach numbers.
No temperature gradient is detected between the region of the relic (1) and the pre-shock region (2). This cannot be due to projection effects. In fact the high resolution radio images of the relic show a sharper brightness decrease on the western (outer) edge (Giovannini et al. 1991), and the infall path of the NGC 4839 group to the cluster in a two-body model lies at about 74∘ to the line of sight (Colless & Dunn 1996). Thus, a strong inclination of the shock with respect to the sky plane, which would spread the observed temperature jump over a larger region, should be ruled out. The identification of region (2) as the pre-shock region relies on the assumption that the group is on its first passage into the cluster core. This is a widely accepted scenario (see beginning of Discussion). Nevertheless, the low temperature at the relic location is a significant result in itself, in particular because it is lower than that of the NGC 4839 group, thus indicating the lack of high temperature shocked gas in the relic region.
This result favors the hypothesis that turbulence may be the major mechanism responsible for the physical origin of the radio relic emission. During its infall onto the Coma cluster, the sub-group around NGC 4839 encounters a region of relativistic particles connected to a magnetic field. The interaction between the ionized moving plasma and the magnetic field would imply energy transfer from the ICM to the relativistic particles. As for the origin of relativistic particles, Enßlin et al. (1998) suggested that they could be produced by the tailed radio galaxy NGC 4789, located to the SW of the relic.
The energy for particle acceleration comes from the kinetic energy of the X-ray gas, which is subsequently slowed down. We see indications that the X-ray gas slows down: for example, the gas of the sub-group is lagging behind the galaxies of the sub-group (Neumann et al. 2001). This deceleration is partly due to ram pressure stripping, which acts more on the extended X-ray gas than on the galaxies. The total minimum energy in the radio relic, computed under equipartition (Thierbach et al. 2003), is 3.5 1058 erg, assuming that the radio relic volume can be approximated by an ellipsoid of 30′10′10′, corresponding to 3.45 107 kpc3. The kinetic energy of the ICM of the sub-group, assuming a gas mass of M☉ and a velocity difference of 1700 km sec-1, is erg. Thus, the energy from the group motion can be transferred to the relativistic electron population with a reasonably low efficiency.
The head of the NGC 4839 group crossed the relic region yr ago. However, the relativistic electrons radiating at frequencies between 150 MHz and 1.5 GHz are only 1 2.5 108 yr old, thus supporting the view that particle reacceleration has occurred more recently.
4.2 Limit to the magnetic field
X-ray emission of non-thermal origin is predicted to originate in a synchrotron source, due to the scattering between the radio-emitting electrons and the microwave-background photons. Since synchrotron and IC emissions are produced by the same electron population, they share the same emission spectral index . This spectral index relates to the index of the power-law electron energy density distribution as , and to the photon index of the IC emission as . Combining the standard formulae of the synchrotron and IC emission mechanisms (see, for example, the derivation in Govoni & Feretti 2004), a lower limit to the volume-averaged magnetic field can be obtained from the X-ray flux upper limit for the non-thermal component.
Using a radio flux at 610 MHz of 611 mJy (Giovannini et al. 1991) and the spectral index of 1.18, we obtain a magnetic field B 1.05 . This value can be compared with the estimates obtained by other arguments. First, the equipartition magnetic field derived by Thierbach et al. (2003) by integrating the energy spectrum of particles over all energies above 300 MeV, and by assuming a filling factor = 1 and a proton-to-electron energy ratio k = 1, is 0.67 G, scaled to our cosmology. Second, the expected value of the magnetic field at the distance of the relic, derived from the profile of the Coma cluster magnetic field presented by Brunetti et al. (2001), is of about 0.1 G. The profile is obtained in the framework of a model, which reproduces the observational properties of the Coma radio halo invoking electron reacceleration. Finally, the average magnetic field in the Coma cluster, obtained from the non-thermal hard X-ray emission detected with BeppoSAX is 0.2 G (Fusco-Femiano et al. 2004).
The lower limit derived here is almost two times larger than the equipartition value and is about an order of magnitude larger than the value derived from the profile presented by Brunetti et al. (2001). This indicates that the magnetic field in this region of the Coma cluster has undergone some amplification. This could be related to the sub-group gas overdensity (Dolag et al. 2001). Another possibility is that the magnetic field could have been deposited in the ICM by formerly active radio galaxies, also responsible for the origin of relativistic particles. Since this is a very small region compared to the whole cluster, a high magnetic field here is not in contrast with the low average value of the Coma cluster, which should still be dominated by the magnetic field decline with radius (see also the discussion in Fusco-Femiano 2004).
Acknowledgements.
We are grateful to R. Fusco-Femiano, G. Giovannini, F. Govoni, C. Sarazin and M. Tagger for fruitful discussions. We thank the anonymous referee for useful suggestions. LF acknowledges a grant from Egide (Centre français pour l’accueil et les échanges internationaux) for a “Séjour scientifique de haut niveau” at CEA/Saclay, and thanks the colleagues of the Service d’Astrophysique for their kind hospitality.References
- (1) Arnaud M., Neumann D.M., Aghanim N. et al. 2001, A&A 365, L80
- (2) Briel, U.G., Henry, J.P., Böhringer, H. 1992, A&A, 259, L31
- (3) Brunetti, G., Setti, G., Feretti, L., Giovannini, G. 2001, MNRAS, 320, 365
- (4) Colless, M., Dunn, A.M. 1996, ApJ, 458, 435
- (5) Dickey, J.M., Lockman, F.J. 1990, ARA&A, 28, 215
- (6) Dolag K., Schindler S., Govoni F., Feretti L. 2001, A&A, 378, 777
- (7) Drury, L. 1983, Space Sci. Rev., 36, 57
- (8) Enßlin, T.A., Biermann, P.L., Klein, U., Kohle, S. 1998, A&A, 332, 395
- (9) Enßlin, T.A., Gopal-Krishna 2001, A&A, 366, 26
- (10) Enßlin, T.A., Brüggen, M. 2002, MNRAS, 331, 1011
- (11) Fusco-Femiano R., Orlandini M., Brunetti G., et al. 2004, ApJ, 602, L73
- (12) Giovannini, G., Feretti, L., Stanghellini, C. 1991, A&A, 252, 528
- (13) Govoni, F., Feretti, L. 2004, Int.J.Mod.Phys.D, 13, 1549
- (14) Majerowicz S., Neumann D.M., Romer A.K., et al. 2004, A&A 425, 15
- (15) Neumann, D. M., Arnaud, M., Gastaud, R., et al. 2001, A&A, 365, L74
- (16) Nevalainen, J., Markevitch M., Lumb, D. 2005, ApJ, 629, 172
- (17) Read, A.M., Ponman, T.J. 2003, A&A, 409, 395
- (18) Ryu, D., Kang, H., Hallman, E., Jones, T.W. 2003, ApJ, 593, 599
- (19) Sarazin, C. L. 2002, in: Merging Processes in Galaxy Clusters, ed. L. Feretti, I.M. Gioia, & G. Giovannini, ASSL, Vol. 272, 1
- (20) Scharf, C. 2002, ApJ, 572, 157
- (21) Snowden, S., Immler, S., Arida, M., et al. 2004, http://heasarc.gsfc.nasa.gov/docs/xmm/abc/
- (22) Thierbach, M., Klein, U., Wielebinski, R. 2003, A&A, 397, 53