Neutral Hydrogen Clouds near Early-Type Dwarf Galaxies of the Local Group
Abstract
Parkes111The Parkes telescope is part of the Australia Telescope which is funded by the Commonwealth of Australia for operation as a National Facility managed by CSIRO. neutral hydrogen 21 cm line (Hi) observations of the surroundings of 9 early-type Local Group dwarfs are presented. We detected numerous Hi clouds in the general direction of those dwarfs and these clouds are often offset from the optical center of the galaxies. Although all the observed dwarfs, except Antlia, occupy phase-space regions where the High-Velocity Cloud (HVC) density is well above average, the measured offsets are smaller than one would expect from a fully random cloud distribution. Possible association is detected for 11 of the 16 investigated clouds, while, for two galaxies, Sextans and Leo I, no Hi was detected. The galaxies where Hi clouds were found not to coincide with the optical, yet have a significant probability of being associated are: Sculptor dSph, Tucanna, LGS3, Cetus, and Fornax. If the clouds are indeed associated, these galaxies have Hi masses of , , , , and , respectively. However, neither ram pressure nor tidal stripping can easily explain the offsets. In some cases, large offsets are found where ram pressure should be the least effective.
1 Introduction
Early type dwarf spheroidal (dSph) and mixed type dwarf irregular/dwarf spheroidal (dIrr/dSph) galaxies of the Local Group (LG) are torn apart by the presence of all the other members of the group. Their shallow potential well makes them good targets for many kind of disruptions, from tidal forces to ram pressure due to the intergalactic medium (IGM). In general, dSph are found near larger galaxies (Mateo, 1998). More precisely, the Milky Way has 7 dSph closer than 200 kpc, which is more or less the size of its extended dark matter halo (Zaritsky, 1999), where one would expect that disruption processes are maximized.
Blitz & Robishaw (2000, hereafter BR) compiled evidence that 10 of the 21 dSph and dIrr/dSph galaxies of the LG contain important amounts of neutral hydrogen (Hi) situated in reservoirs that can be as far as 10 kpc away from the optical core of the galaxy. The offset was mainly attributed to ram pressure but the authors also consider a tidal stripping mechanism. This followed the discovery of Hi clouds near Sculptor (Carignan et al., 1998; Bouchard et al., 2003), Phoenix (St-Germain et al., 1999), SagDIG (Young & Lo, 1997). These detections have implications on the formation and evolution of the LG. BR argued that most likely “all of the LG dwarf galaxies have had loosely bound Hi envelopes” and that some stripping mechanism removed the gas for galaxies closer than 250 kpc from the Milky Way (MW) or M31 consequently stopping any ongoing star formation (see Grebel, 1998, 2001). This scenario may be consistent with numerical simulations of galactic formation in a cold dark matter cosmogony that predict many more galactic halos than what is currently observed (Navarro et al., 1996). A large number of substructures may also reside in the halo of the MW but most of them must have failed to form stars thus avoiding detection (Moore et al., 1999). According to BR, these halo substructures may harbor the Hi clouds known as High Velocity Clouds (HVCs).
Murali (2000) noted that ram pressure stripping might not be as important as what one might think. The author revised the density of the gas present in the galactic halo to a value of cm-3 at a distance of 50 kpc, a factor of 10 lower than previously estimated. This leads to the conclusion that tidal forces might be dominating over ram pressure, at least in the case of the Magellanic stream. Though the implication for dSphs is not that clear, the same kind of influence could be present. Similarly, D’Ercole & Brighenti (1999) showed that the gas removal occurring in a Blue Compact Dwarf galaxy by its starburst phase — resulting in a galactic wind — may also not be as devastating as previously thought. It is known that the wind from massive stars, combined with the effect of type II supernovae (SNe) release an energy in the interstellar medium (ISM) that is greater than the binding energy of the gas to the galaxy and could therefore remove a large quantity of it (Larson, 1974). But the simulations showed that, after a time of about 100 Myr after the starburst, a large fraction of the ISM falls back on the galaxy. Of course, these simulations consider a single isolated galaxy, free of tidal interactions with its neighbors. In the case of dSph those tidal forces could hold the gas and prevent it from falling back towards the galaxy.
This is supported by star formation history (SFH) analysis of some dSph in the LG. The stellar population of these dwarfs seems more complicated than a single early starburst phase (Grebel, 1998; Hurley-Keller et al., 1999; Martínez-Delgado et al., 1999; Hensler et al., 2004). Since there is some star formation going on in these galaxies and since star formation does not efficiently destroy the ISM (Matzner & McKee, 2000) it is therefore possible that clouds of hydrogen are still present in the vicinity of dwarfs. As suggested by BR, the large number of HVCs (Putman et al., 2002) could be attributed, in part, to these Hi clouds falling onto the MW.
In section 2, Hi observations of several dSph and mixed type dIrr/dSph in the LG are presented. Results and comments on each detection are presented in section 3. Finally, a general discussion about Hi gas removal can be found in section 4, along with comments on High Velocity Clouds.
2 Observations
2.1 The sample
The main goal of this paper is to look for Hi clouds in or near dSph and dIrr/dSph galaxies in the LG. BR have already begun this work, suggesting that many of these galaxies should be now considered as gas rich systems. They found Hi clouds, using the Leiden-Dwingeloo Hi survey (LDS) near And III, And V, Leo I and Sextans and they confirmed the Hi detections of DDO210 and Pegasus (Lo et al., 1993), LGS3 (Hulsbosch & Wakker, 1988), Phoenix (Carignan et al., 1991), Sculptor (Carignan et al., 1998) and Tucana (Oosterloo et al., 1996). The LDS covers the whole northern sky and reaches a declination of -30∘. This makes a perfect complement to the Hi Parkes All Sky Survey (HIPASS) which covers all the southern sky up to a declination of +25∘, with the northern extension.
| Name | Type | Distance | V | V | ||||
|---|---|---|---|---|---|---|---|---|
| (kpc) | (km s-1) | (km s-1) | ||||||
| Current sample | ||||||||
| Cetus000See Whiting et al. (1999) | 00 26 11 | -11 02.6 | 101.5 | -72.9 | dSph | 77550 | - | - |
| Sculptor | 01 00 09 | -33 42.5 | 287.5 | -83.2 | dSph | 794 | 1083 | 1041000Given in Bouchard et al. (2003) |
| LGS 3 | 01 03 53 | +21 53.1 | 126.8 | -40.9 | dIrr/dSph | 81060 | -2824 | -2726 |
| Phoenix | 01 51 06 | -44 26.7 | 272.2 | -68.9 | dIrr/dSph | 44530 | -526000Given in Gallart et al. (2001) | -232 |
| Fornax | 02 39 59 | -34 27.0 | 237.1 | -65.7 | dSph | 1388 | 533 | - |
| Carina | 06 41 37 | -50 58.0 | 260.1 | -22.2 | dSph | 1015 | 2243 | - |
| Antlia | 10 04 04 | -27 19.8 | 263.1 | +22.3 | dIrr/dSph | 123565 | 35115000Given in Tolstoy & Irwin (2000) | 3612 |
| Leo I | 10 08 27 | +12 18.5 | 226.0 | +49.1 | dSph | 25030 | 2862 | - |
| Sextans | 10 13 03 | -01 36.9 | 243.5 | +42.3 | dSph | 864 | 2273 | - |
| Aquarius000Also called DDO210 | 20 46 46 | -12 51.0 | 34.0 | -31.3 | dIrr/dSph | 800250 | - | -1373 |
| Tucana | 22 41 50 | -64 25.2 | 322.9 | -47.4 | dSph | 88040 | - | - |
| Pegasus | 23 28 34 | +14 44.8 | 94.8 | -43.5 | dIrr/dSph | 95550 | - | -1822 |
| Unobserved objects | ||||||||
| And III | 00 35 17 | +36 30.5 | 119.3 | -26.2 | dSph | 76040 | -3519000Given in Côté et al. (2000) | -3416000Given in Blitz & Robishaw (2000) |
| NGC 185 | 00 38 58 | +48 20.2 | 120.8 | -14.5 | dSph/dE3p | 62025 | -2107 | -2044 |
| NGC 205 | 00 40 22 | +41 41.4 | 120.7 | -21.1 | E5p/dSph-N | 81535 | -2423 | -2295 |
| And I | 00 45 43 | +38 00.4 | 121.7 | -24.9 | dSph | 80540 | - | - |
| And II | 01 16 27 | +33 25.7 | 128.9 | -29.2 | dSph | 525110 | - | - |
| Leo II | 11 12 29 | +22 09.2 | 220.2 | +67.2 | dSph | 20512 | 762 | - |
| Ursa Minor | 15 09 11 | +67 12.9 | 105.0 | +44.8 | dSph | 663 | -2482 | - |
| Draco | 17 20 19 | +57 54.8 | 86.4 | +34.7 | dSph | 826 | -2932 | - |
| Sagittarius | 18 55 03 | -30 28.7 | 5.6 | -14.1 | dSph-N | 242 | 1405 | - |
We first used HIPASS to identify any possible Hi clouds that may be associated with a LG dwarf. In the cases where the Hi emission was not directly overlapping with the optical emission we have made high resolution, high sensitivity follow-up observations using the Parkes Narrowband system. These latter observations were used to confirm the HIPASS detections and analyse their velocity structure. The list of the observed galaxies can be found in Table 1 which lists the name of the galaxies, their equatorial and galactic coordinates, their morphological classification, radial distance, heliocentric optical radial velocity (V) and heliocentric Hi radial velocity using the radio definition (V).
2.2 HIPASS Observations
The Hi Parkes All-Sky Survey (HIPASS) is a large blind Hi survey covering the whole southern sky with a beam of 15.5′(Barnes et al., 2001) and a velocity coverage of -1200 to +12700 km s-1 in 1024 channels 13.2 km s-1 wide (Staveley-Smith & et al., 2000). This was done with the Parkes radiotelescope, a 64 m antenna, equipped with a 13 beam receiver. The sky is observed by scanning regions of 8∘ along the sky at a rate of 1∘/min. Each point in the sky was observed 5 times for a total integration time of 460 s beam-1. This gives an rms noise of about 13 mJy beam-1.
2.3 Parkes Narrowband Observations
The Parkes narrowband system is a high spectral resolution alternative to the normal multibeam setting, used in HIPASS observations. It has a total bandwidth of 8 MHz in 2048 channels and 2 polarizations (XX and YY) and only the inner 7 beams were used.
The data were reduced with the LIVEDATA reduction package distributed with the AIPS++ software. The cube was formed using 0.82 km s-1 pixels. Frequency switching mode and heliocentric velocity frame were used. The data have a resolution (FWHM) of 14.1 spatially and 1.12 km s-1 on the spectral axis. The RMS noise is 20 mJy/beam.
The frequency-switched data were affected by low-level ripples with a period of a few MHz. These were removed using two methods. Firstly, nearby regions with no Hi emission were identified. Spectra from these regions were used as a template baseline for regions with Hi emission. Secondly, parabolic baselines were fit to the residual data.
In the case of Fornax, special attention was required in order to remove the MW emission from the data cube. We computed the average spectra over the whole region covered by our data cube and subtracted it at every pixel position. This gives us a cube where the mean intensity is zero for every velocity channel. To estimate the Hi mass of a certain cloud we need to resubtract the mean intensity of the background at each channel where emission is found.
3 Results
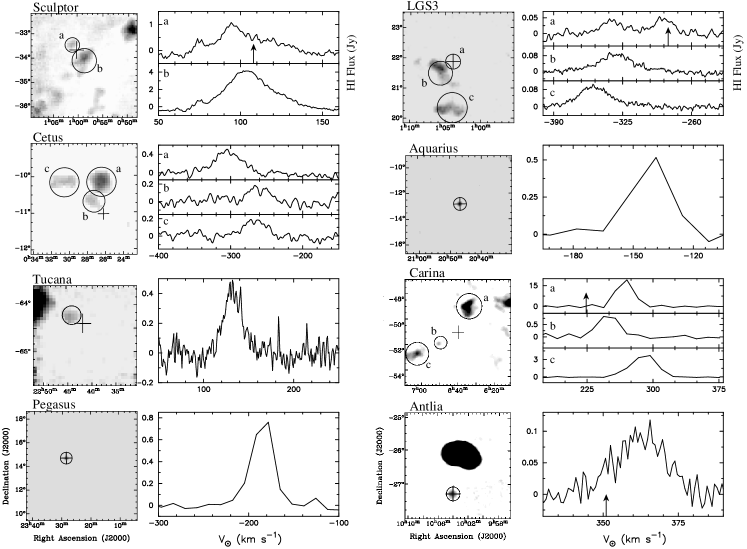
The results of our systematic Hi search around dSph and dIrr/dSph galaxies are presented in Figure 1 where the Hi distribution maps and the spectra for the located clouds are shown. Table 2 contains quantitative information on each cloud.
3.1 Sculptor
Two clouds of Hi were previously detected in the field of Sculptor and are believed to be bound to the galaxy (Carignan et al., 1998). Bouchard et al. (2003) showed that 88% of this Hi is contained, in projection, inside the optical radius of the galaxy. The very close agreement between the optical and the Hi radial velocity also supports the hypothesis that the clouds are physically linked to the dwarf.
The Magellanic Stream lies in the same general direction as Sculptor. In that region, the Stream has a radial velocity of 0 km s-1 with a velocity dispersion of 15 km s-1(Brüns et al., 2005). It is therefore unlikely that the Sculptor clouds belong to that structure. The other most plausible alternative to physical association — the clouds being HVCs — will be discussed in section 4.3.
3.2 Cetus
Recently discovered (Whiting et al., 1999), the Cetus dwarf is one of the latest addition to the LG. It is classified as a dSph system because of its similarities to all the other known dSph, Tucana in particular. The 2 galaxies have roughly the same absolute magnitude and they are, strangely for dSph, isolated systems.
The star formation history analysis reveals no obvious recent star formation in this galaxy (Sarajedini et al., 2002; Harbeck et al., 2004). But as the other dSphs of the LG, one can assume that it is not a single, short burst that shaped the galaxy. It is affected by the second-parameter effect, probably linked with age, and makes Cetus younger than what was expected. It was noted by Whiting et al. (1999) that because this galaxy does not seem to have any ongoing star formation, it would be unlikely to find Hi within the galaxy. They have also reported a tidal radius of 5′ and the clouds are situated well outside of it. The three clouds are situated less than 1.5∘ (a projected distance of 20 kpc) away from the dwarf and cloud b is elongated in the direction the galaxy’s optical center.
Alone, the above is not sufficient evidence to prove that the clouds belong to the Cetus system. No definite statement can and should be done before optical velocities are obtained for the stars in Cetus. When considering the measured velocities of the Hi clouds, the optical velocity of Cetus should be found in the range of km s-1. If this is not the case, there is little chance that the galaxy and the clouds are related. This velocity is similar to Cetus’ 2 closest LG neighbours, WLM and IC1613.
3.3 Tucana
Oosterloo et al. (1996) were the first to report a reservoir of 1.5 kpc M⊙ of Hi near Tucana but they believed it associated with the Magellanic Stream — this would make the Hi mass much lower, kpc M⊙. They were using the Australia Telescope Compact Array (ATCA) with the 375m configuration, which will underestimate the flux on scales larger than 10′. Our observation of the Tucana dwarf, using a single dish telescope, is therefore more precise and gives a mass of MHI = 1.790.15 kpc M⊙. We can conclude that 20% of the Hi resides in structure inaccessible to the array.
Apart from the artifacts at the edge of the data cube, most prominent in the north-east corner (see Figure 1), the region around Tucana is mostly free of Hi features. In this paper, we consider the detected cloud to be associated with Tucana as we would expect the Magellanic stream to be a larger or non-isolated low surface brightness feature.
3.4 LGS 3
Previous Hi observations have already shown that LGS 3 is a gas rich galaxy (Lo et al., 1993). We confirm that there is an Hi cloud at the same position and velocity than the optical galaxy. Figure 1 shows 2 other clouds that might be associated with LGS 3. These clouds were not discussed by Lo et al. (1993) and do not appear in their spectra but were presented earlier by Hulsbosch & Wakker (1988). They are spatially close to the galaxy but at sightly different velocities. The cloud centered on LGS 3 (Cloud a) shows a blueshifted feature that is probably an overlap from Cloud b.
A careful analysis of the Hi emission map shows that Clouds b and c are linked to each other by faint emission. The shape of the clouds also suggests that they are in physical association with the galaxy.
3.5 Carina
Despite previous attempts (e.g. Mould et al., 1990), no Hi has ever been reported in the vicinity of Carina. We used the HIPASS survey to search for Hi near the dwarf. Higher resolution data is not available for this galaxy. Nevertheless, we found 3 clouds in the vicinity of Carina though they are situated far from the optical center of the dwarf.
Majewski et al. (2000) have observed the Carina dwarf in search of a tidal break in the distribution of the stars. They found a departure from a King profile at a radial distance of 20′ but the stellar density profile continues to fall off more gradually up to a radius of 80′. According to the model by Johnston et al. (1999), objects beyond this break are unbound to the galaxy and should be considered as extratidal. Unfortunately, they were unable to complete the spectroscopic study needed to determine any rotation-like motion that would be expected from extratidal debris.
The three clouds circled in Figure 1 are the three closest candidates for Hi being related to the dSph. One one hand, two of these clouds (a and b) are situated near the edge of the 80′ optical radius of the galaxy and have velocities very close to the optical velocity of Carina (specially for Cloud b). On the other hand, there is a large Hi complex projected near the galaxy that can be partly seen in the Hi distribution map and the velocity of Cloud c is drastically different to that of the dwarf. Moreover there is no Hi that can be found within the 80′ radius of the galaxy. It is therefore doubtful that the gas and the dwarf are physically associated.
3.6 Phoenix
The suggestion that Hi might be associated with Phoenix goes back nearly 15 years (Carignan et al., 1991). It was shown that the detected gas was well separated from the MW and from the Magellanic Stream gas. This was later confirmed, at higher resolution, by St-Germain et al. (1999). Despite the spatial coincidence, it was stellar spectroscopy (Gallart et al., 2001) that confirmed the likelihood of the association (V km s-1, V km s-1).
We have not attempted to confirm the detection of Hi in Phoenix with the HIPASS data because the velocity resolution is too poor, making it difficult to separate local Hi from Hi associated with Phoenix.
3.7 Pegasus, Aquarius and Antlia
Mixed type dIrr/dSph galaxies have generally been named as such because of the presence of Hi centered on the optical disks of the galaxies. For that reason these 3 galaxies do not hold many surprises. Hi in the three galaxies was previously reported by Lo et al. (1993, for Pegasus and Aquarius) and Barnes et al. (2001, for Antlia). High resolution spectroscopy was not necessary for these objects since the HIPASS detections were very clear and reliable.
However, Parkes narrowband observations have already been conducted on Antlia and NGC 3109 by Barnes & de Blok (2001). This galaxy is probably the most interesting one of the 3 because of its proximity to NGC 3109. Ionizing flux coming from the larger companion may have disturbed the ISM of Antlia. Unfortunately, the poor angular resolution and the lack of known optical velocity for Antlia, make it very difficult to draw any conclusion on this phenomenon apart from the fact that the Hi mass might be lower than what is expected for that kind of galaxy.
3.8 Fornax
The Fornax galaxy is probably one of the most problematic in the LG, at least for Hi studies. It has an optical systemic velocity of V3 km s-1. In that direction and albeit at a Galactic latitude of , the Milky Way’s Hi radial velocity structure is quite extended and peaks at V km s-1. The tail of this Galactic Hi line emission extends beyond 53 km s-1 and is brighter than what would be expected from any feature associated with the Fornax dwarf.
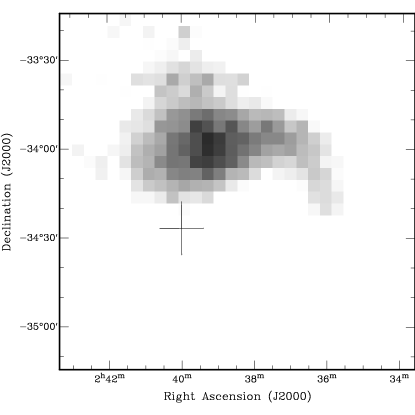

Figure 2 shows the integrated intensity map of Fornax after the MW’s contribution was removed. We see a twisted head-tail feature north of the galaxy. The MW-subtracted spectrum in Figure 3 shows that the velocity of the excess Hi emission V km s-1 is km s-1 lower than the stellar value.
The 21 cm line shape of this cloud is obviously still contaminated by signatures of the MW as the Galaxy’s subtraction process is crude and the shape of the interfering Hi emission badly determined. The best example of this is the negative feature seen between -30 and 10 km s-1. This is the result of a very large Hi filament covering the whole south west quadrant of the cube that our subtraction technique does not adequately remove. Nevertheless, this technique enables us to highlight this kinematically and structurally distinct cloud projected well inside the 71′ tidal radius (Irwin & Hatzidimitriou, 1995) of the Fornax dwarf. Interestingly, this cloud is closer to the center of the dwarf than the extratidal stellar shell-like structure found by Coleman et al. (2005) 1.3∘ northwest of the center. Apart from these apparent overlap, we are unable to distinguish whether this cloud is: 1. part of the inherent clumpiness of the MW, 2. part of the Fornax system or 3. a HVC somewhere in between.
If the Hi is indeed associated with Fornax, it has a Hi mass of 1.5 kpc M⊙. This should be regarded as a lower limit because part of the mass resides below the 20 km s-1 mark where a very strong MW feature is situated. The mass estimates, as well as the integrated intensity map, have been calculated using data from above that velocity (and below 40 km s-1). If the Hi cloud is at the same radial distance as the Fornax dwarf, the Hi mass, its position with respect to the stellar center ( kpc) and the velocity difference between these two components are very similar to what is found in other LG dwarf galaxies like Sculptor and Phoenix or the Sculptor group dwarfs ESO294-G010 and ESO540-G030 (Bouchard et al., 2005).
3.9 Sextans and LeoI
Sextans and LeoI were both reported as having gas associated with them (BR). They argued that the velocity agreement and spatial overlap of the clouds with the galaxies were sufficient evidences to prove that they were associated, the chance of random agreement being around 1.5. But careful inspection of the HIPASS cube of the same regions reveals no trace of those clouds.
The Leiden-Dwingeloo survey with which the detections were initially made has a sensitivity of 70 mK, much greater than HIPASS (rms noise of 10 mK). The detections were of low significance and were probably artefacts.
4 Analysis
| Cloud | LV | Distance | aaWhere values are noted with a dagger (), the optical velocity information is not available. See text for details. | HVC density | ||
|---|---|---|---|---|---|---|
| ( L⊙) | (kpc) | ( M⊙) | (km s-1) | % | (deg2 km s-1)-1 | |
| Sculptor a | 2.15 | 794 | 0.0410.002 | 1 | 99.7 | 0.0022 |
| Sculptor b | 2.15 | 794 | 0.1930.003 | 0.3 | 99.7 | 0.0022 |
| Cetus a | 0.84 | 77550 | 2.70.1 | 3 | ††footnotemark: 72.1 | 0.0018 |
| Cetus b | 0.84 | 77550 | 0.740.08 | 9 | ††footnotemark: 91.0 | 0.0018 |
| Cetus c | 0.84 | 77550 | 0.950.07 | 5 | ††footnotemark: 44.5 | 0.0018 |
| Phoenix | 0.90 | 44530 | 0.190.01 | 1 | 0.0004 | |
| Fornax | 15.5 | 1388 | 0.1460.004 | 1 | ††footnotemark: 87.7 | 0.0015 |
| Tucana | 0.55 | 88040 | 1.80.1 | 5 | ††footnotemark: 98.7 | 0.0009 |
| Pegasus | 12.0 | 95550 | 5.40.2 | 2 | ||
| LGS3 a | 1.33 | 81060 | 0.160.01 | 5 | ||
| LGS3 b | 1.33 | 81060 | 0.500.02 | 1 | 99.1 bbInstead of using a local probability as in the other cases, we used the mean probability over the total extent of the HVC catalog because LGS3 is situated outside of it. | |
| LGS3 c | 1.33 | 81060 | 0.530.02 | 2 | 86.4 bbInstead of using a local probability as in the other cases, we used the mean probability over the total extent of the HVC catalog because LGS3 is situated outside of it. | |
| Aquarius | 0.81 | 800250 | 1.80.2 | 3 | 0.0018 | |
| Carina a | 0.43 | 1015 | 1.040.09 | 6 | 31.5 | 0.0030 |
| Carina b | 0.43 | 1015 | 0.090.02 | 15 | 55.1 | 0.0030 |
| Carina c | 0.43 | 1015 | 0.360.02 | 4 | 0.6 | 0.0030 |
| Antlia | 1.73 | 123565 | 0.620.03 | 1 | 0.00005 | |
| Sextans | 0.50 | 864 | 0.0007 | |||
| LeoI | 4.79 | 25030 | ||||
4.1 Hi Content of dSph and dIrr/dSph
It is not clear whether or not the detected Hi clouds in the line of sight of dwarf galaxies are really associated with them. The mixed dIrr/dSph type is a little easier. The Hi is found closer to their optical centers. The presence (or lack of) Hi within a system is one of the main criteria used to differentiate between these two types of dwarfs. Since many of these galaxies show recent SF (Grebel, 1998), it should not be surprising to find substantial amounts of Hi close to them.
BR had several non-detections. Among those, only one, Antlia, was on our target list. It is now clear that Antlia has Hi associated with it. So the list of non-detections in the LG, after being augmented by the two false detections made by BR (i.e. Sextans and LeoI), consists of 9 galaxies. And I, And II, And VII, Leo I, Leo II, Ursa Minor, Draco, Sagittarius and Sextans are now the only members of the LG where no Hi has been found near their optical centers. Among those, Leo I and Leo II are very interesting cases. Despite the fact that they are quite far from the Milky Way, (e.g. further away than Sculptor), no Hi is found in their vicinity. They are at comparable distances but have different masses and luminosities. Whatever phenomenon was involved in the ISM removal, it is likely to be linked mainly with environmental factors that would be the same in both cases. For And I, And II and And VII, the proximity to Andromeda is probably the major factor influencing the absence of Hi. Similarly, Ursa Minor, Draco and Sextans are all at less than 100 kpc from the Milky Way and no Hi was found near these galaxies. Finally, Sagittarius, being in direct interaction with the Galaxy should have lost its Hi long before it started loosing its stars.
4.2 Tidal Interaction and Ram Pressure
Different mechanisms have been proposed to remove gas from dSph galaxies. The most often talked about are tidal interactions with the more massive members of the LG and ram pressure from the IGM.
The dSph galaxies are often situated inside the gravitational potential of a larger companion. This causes stars to escape the gravitational field of the dwarf and are seen as extratidal features (e.g. Martínez-Delgado et al., 2001; Palma et al., 2003). In that respect, Sculptor shows an interesting shape. It has one cloud on one side and the other cloud on the other side. Because both of them are aligned with the proper motion (Schweitzer et al., 1995), the shape could be attributed to tidal stretching. However, optical photometry and star counts show that the optical component of the galaxy is aligned in a roughly perpendicular direction (Irwin & Hatzidimitriou, 1995). Furthermore Sculptor does not seem to have any extratidal features (Coleman et al., 2005). We therefore believe that this phenomenon, by itself, does not play a significant role in the gas removal from dSph.
Otherwise, ram pressure could in principle be devastating for any dSph in the vicinity of a large spiral. If its orbit leads a dwarf deep into the halo (or even the disk) of a spiral, ram pressure will cause major gas-loss in the dwarf. In less extreme cases Gallart et al. (2001) have estimated that ram pressure will produce an Hi distribution that is offset from the optical center, trailing behind the galaxy, relatively smooth and slightly elongated in the direction of motion.
The shape of the Hi distribution near Cetus, Tucana and Carina correspond to these criteria up to the extent that we have no idea of the direction and magnitude of their proper motion. For Sculptor (cloud b) and LGS3 (clouds b and c), the Hi clouds are elongated but perpendicular to the direction to the optical center of the dwarfs. For Fornax, if the cloud was indeed associated with the dwarf and its position is the result of ram pressure, the cloud must have been distorted by a change of direction in the proper motion.
Strangely, amongst the above mentioned galaxies, Cetus, Tucana and LGS3 are some of the most isolated galaxies in our sample and the most distant from the MW. This is exactly the situation where ram pressure should normally be minimised. Moreover, Sculptor is the only dSph from our sample with a known proper motion (Schweitzer et al., 1995) and it appears that it might have have a leading cloud as well as a trailing one. It is difficult to explain the presence of multiple Hi clouds using ram pressure and we conclude that this mechanism alone cannot account for the Hi distribution that we observe.
Ram pressure and tidal fields are not the only mechanisms one should consider, internal mechanisms can also disrupt the Hi content of a dwarf. Episodes of star formation, in particular if combined with supernovae explosions can generate huge amounts of energy and remove the Hi from the central regions of a dwarf. This will eventually make ram pressure and tidal stripping more effective because the gas is expelled to regions with even shallower potential well than the center of the dwarf.
4.3 HVCs
Some of the clouds presented in this paper are also listed in the High Velocity Cloud (HVC) catalog of Putman et al. (2002). This catalog lists 1997 Hi clouds that do not fit simple Galactic rotation models. Of our 12 detected clouds that lie within the limits of the HVC catalog (-500 km s-1 +500 km s-1, 90 km s-1 and +2∘) 8 are listed. Not listed, among the 40 galaxies that do have an entry, are the dIrr/dSph type galaxies Pegasus and Antlia. Both Sculptor clouds are marked as potentially belonging to the Sculptor dSph galaxy.

HVCs cover about 19% of the southern sky and can be found in the same range of velocities as the dwarf galaxies in the LG. Figure 4 shows the kinematic distribution of HVCs across the sky. The sinusoidal shape of the diagram is caused by galactic rotation and the gap near VLSR = 0 km s-1 comes from the limits imposed on the catalog. In the Figure, the asterisks represent galaxies that were listed in the HVC catalog. They have a distribution that is systematically redshifted. Inspection of the catalog reveals that most of them do not belong to the LG. The circles represents all the known LG galaxies (Mateo, 1998). They have a different distribution then HVC/galaxies but very similar to HVCs (dots) or our sample (triangles).
For each galaxy we observed, we scanned the HIPASS HVC catalog and counted the the number of HVCs near the target galaxies. We used these entries to compute a local probability that none of these randomly distributed HVCs be situated at the position or closer to the dwarf than the clouds we think might be associated (these clouds are situated at radially and kinematically from the optical center of the galaxies). It also assumes that the HVCs are uncorrelated and distributed uniformly within the limits of our search. Because we know that HVCs are not distributed uniformly across the sky (see Putman et al., 2002), we have limited our search to ∘ and inside km s-1 (or up to the catalog’s limit) around the galaxies in order to compute a local density of HVCs rather than using an all-sky average. The probability is given by:
| (1) |
The results are given in Table 2. When the optical velocity of the dwarf is unavailable, the value of is considered equal to 1 and no constraints on velocity is applied when counting the clouds near the galaxy. Moreover, no is listed in Table 2 where no offset between the Hi and the optical could be measured. One should note that is computed for each of the listed cloud independently, without the assumption that any other nearby clouds might be associated (e.g. for Sculptor a does not assume that Sculptor b is associated with the dwarf).
The galaxies where Hi clouds have been found them but not them are: Sculptor, Cetus, Fornax, Tucana, LGS 3, and Carina. Apart for Carina, the probabilities of these clouds genuinely belonging to the dwarfs are above 85%. For Cetus and Tucana, the probabilities do not take into account optical velocity information because it is unavailable. Despite this fact, the probability of association is very high and velocity information, if relatively close to that of the cloud, would not drastically alter the probability. We are therefore confident that these clouds are associated with the corresponding dwarf galaxies.
LGS 3 is situated outside of the boundaries of the catalog so the value listed in Table 2 is based on an average HVC density. For LGS3 b, the probability of association is higher than 99% meaning that this association has a good chance of being genuine. As we noted previously, the 2 clouds (LGS3 b and c) seem to be related to each other. LGS3 c has a probability of association of 86.4%.
For Fornax, the velocity information was not used because the optical velocity of the galaxy places it almost at the center of the velocity gap of the catalog and the HVC count would therefore be unreliable. But even without velocity information, the probability of association is very high (87.7%) but not high enough to rule out the HVC hypothesis.
Cetus is one of the weak cases. Except for cloud b, the evidence is that these clouds do not belong to the galaxy. Cloud b has a probability of association of 91% and seems to be ejected out of the dwarf in the direction of cloud c. However, these probabilities have been computed without any knowledge of radial velocity. If, as was stated in section 3.2, the optical velocity of Cetus happens to be km s-1 the probabilities for all clouds could go up above 90%. But, even if the optical velocity does fall inside this bracket, further knowledge of the gas removal mechanism will probably be required in order to undoubtedly confirm the cloud association.
The weakest case is that of Carina. Random HVC association will appear in more than 40% of the cases for any clouds. Chances are that Carina is completely devoid of Hi. That has major consequences on the ability we have to explain its SFH. Hurley-Keller et al. (1998) reported 3 distinct episodes of star formation with a quiescent period of 4 Gyr. The last of these episodes was around 2.5 to 3.5 Gyr ago. Yet there seems to be no gas which could have fueled this SFH. The mechanisms by which the gas could be removed must take these greatly disturbing facts into account. Hi in Carina can disappear for a long period of time and then reappear to trigger SF. Carina b, if at the distance of Carina, would have a mass in the range expected for dSph but is situated far from it (1.8∘, projected distance of 3.2 kpc). Although it is not clear on how this gas could fall back on the galaxy, it is quite easy to figure out how it could have been expelled to that distance.
Simple kinematical studies cannot fully differentiate between the distribution of galaxies and that of HVCs inside the LG. We therefore think that kinematical arguments should be used with caution when discussing dSph and Hi clouds association because of the systematic confusion that will emerge from such correlation. It appears that dwarf galaxies from our sample are all situated in regions where the HVC density is much higher (sometimes up to a factor of 30) than that of the average density of HVC distribution (0.0001 (deg2 km s-1)-1). The only exception is Antlia that is a fairly isolated system.
The only obvious conclusion that can be drawn from Figure 4 and Table 2 is that our cloud distribution is not different from that of LG galaxies and therefore are not outside the LG or taking part in Galactic rotation. To go further with this kind of kinematical study would require knowledge on proper motions and models of galaxy formation that would include accurate star formation models and stellar feedback.
5 Conclusion
Parkes observations were used to conduct a survey of the dSph and dIrr/dSph galaxies of the Local Group. HIPASS and follow-up narrowband observations enabled us to arrive at the following conclusions:
-
1.
All LG dSph and dIrr/dSph of the southern hemisphere (except Antlia) are situated in phase-space regions where the HVC density is above average.
-
2.
There are Hi clouds near (in projection) most of the dSph and dIrr/dSph of the Local Group. These clouds are significantly closer to the galaxies than if they were randomly distributed HVCs. Although they are often offset from the optical center they are probably physically associated to the nearby galaxy.
-
3.
The probability of the Hi being physically associated (and not being an unrelated HVC projected near the dwarf) range from 99.7% for Sculptor to less than 1% for Carina. Overall, 11 out of the 16 investigated clouds have a probability of being associated with the nearby galaxy that is above 85%.
-
4.
If the gas is associated with the galaxies, the offsets can not be easily explained by neither ram pressure nor tidal stripping. Some of the largest offsets are seen in galaxies where ram pressure should be the least effective.
References
- Barnes & de Blok (2001) Barnes, D. G. & de Blok, W. J. G. 2001, AJ, 122, 825
- Barnes et al. (2001) Barnes, D. G. et al. 2001, MNRAS, 322, 486
- Blitz & Robishaw (2000) Blitz, L. & Robishaw, T. 2000, ApJ, 541, 675
- Bouchard et al. (2003) Bouchard, A., Carignan, C., & Mashchenko, S. 2003, AJ, 126, 1295
- Bouchard et al. (2005) Bouchard, A., Jerjen, H., Da Costa, G. S., & Ott, J. 2005, AJ, 130, 2058
- Brüns et al. (2005) Brüns, et al. 2005, A&A, 432, 45
- Côté et al. (2000) Côté, P., Mateo, M., Sargent, W. L. W., & Olszewski, E. W. 2000, ApJ, 537, L91
- Carignan et al. (1998) Carignan, C., Beaulieu, S., Côté, S. ., Demers, S., & Mateo, M. 1998, AJ, 116, 1690
- Carignan et al. (1991) Carignan, C., Demers, S., & Cote, S. 1991, ApJ, 381, L13
- Coleman et al. (2005) Coleman, M. G., Da Costa, G. S., Bland-Hawthorn, J., & Freeman, K. C. 2005, AJ, 129, 1443
- Coleman et al. (2005) Coleman, M. G., Da Costa, G. S., & Bland-Hawthorn, J. 2005, AJ, 130, 1065
- D’Ercole & Brighenti (1999) D’Ercole, A. & Brighenti, F. 1999, MNRAS, 309, 941
- Gallart et al. (2001) Gallart, C., Martínez-Delgado, D., Gómez-Flechoso, M. A., & Mateo, M. 2001, AJ, 121, 2572
- Grebel (1998) Grebel, E. K. 1998, Highlights in Astronomy, 11, 125
- Grebel (2001) —. 2001, Astrophysics and Space Science Supplement, 277, 231
- Harbeck et al. (2004) Harbeck, D., Gallagher, J. S., & Grebel, E. K. 2004, AJ, 127, 2711
- Hensler et al. (2004) Hensler, G., Theis, C., & Gallagher, J. S. 2004, A&A, 426, 25
- Hulsbosch & Wakker (1988) Hulsbosch, A. N. M. & Wakker, B. P. 1988, A&AS, 75, 191
- Hurley-Keller et al. (1999) Hurley-Keller, D., Mateo, M., & Grebel, E. K. 1999, ApJ, 523, L25
- Hurley-Keller et al. (1998) Hurley-Keller, D., Mateo, M., & Nemec, J. 1998, AJ, 115, 1840
- Irwin & Hatzidimitriou (1995) Irwin, M. & Hatzidimitriou, D. 1995, MNRAS, 277, 1354
- Johnston et al. (1999) Johnston, K. V., Sigurdsson, S., & Hernquist, L. 1999, MNRAS, 302, 771
- Larson (1974) Larson, R. B. 1974, MNRAS, 169, 229
- Lo et al. (1993) Lo, K. Y., Sargent, W. L. W., & Young, K. 1993, AJ, 106, 507
- Majewski et al. (2000) Majewski, S. R., Ostheimer, J. C., Patterson, R. J., Kunkel, W. E., Johnston, K. V., & Geisler, D. 2000, AJ, 119, 760
- Martínez-Delgado et al. (1999) Martínez-Delgado, D., Gallart, C., & Aparicio, A. 1999, AJ, 118, 862
- Martínez-Delgado et al. (2001) Martínez-Delgado, D., Alonso-García, J., Aparicio, A., & Gómez-Flechoso, M. A. 2001, ApJ, 549, L63
- Mateo et al. (1998) Mateo, M., Olszewski, E. W., & Morrison, H. L. 1998, ApJ, 508, L55
- Mateo (1998) Mateo, M. L. 1998, ARA&A, 36, 435
- Matzner & McKee (2000) Matzner, C. D. & McKee, C. F. 2000, ApJ, 545, 364
- Moore et al. (1999) Moore, B., Ghigna, S., Governato, F., Lake, G., Quinn, T., Stadel, J., & Tozzi, P. 1999, ApJ, 524, L19
- Mould et al. (1990) Mould, J. R., Bothun, G. D., Hall, P. J., Staveley-Smith, L., & Wright, A. E. 1990, ApJ, 362, L55
- Murali (2000) Murali, C. 2000, ApJ, 529, L81
- Navarro et al. (1996) Navarro, J. F., Frenk, C. S., & White, S. D. M. 1996, ApJ, 462, 563+
- Oosterloo et al. (1996) Oosterloo, T., Da Costa, G. S., & Staveley-Smith, L. 1996, AJ, 112, 1969
- Palma et al. (2003) Palma, C., Majewski, S. R., Siegel, M. H., Patterson, R. J., Ostheimer, J. C., & Link, R. 2003, AJ, 125, 1352
- Putman et al. (2002) Putman, M. E. et al. 2002, AJ, 123, 873
- Sarajedini et al. (2002) Sarajedini, A., et al. 2002, ApJ, 567, 915
- Schweitzer & Cudworth (1996) Schweitzer, A. E. & Cudworth, K. M. 1996, in American Astronomical Society Meeting, Vol. 188, 0901
- Schweitzer et al. (1997) Schweitzer, A. E., Cudworth, K. M., & Majewski, S. R. 1997, in ASP Conf. Ser. 127: Proper Motions and Galactic Astronomy, 103
- Schweitzer et al. (1995) Schweitzer, A. E., Cudworth, K. M., Majewski, S. R., & Suntzeff, N. B. 1995, AJ, 110, 2747
- St-Germain et al. (1999) St-Germain, J., Carignan, C., Côte, S. ., & Oosterloo, T. 1999, AJ, 118, 1235
- Staveley-Smith & et al. (2000) Staveley-Smith, L. & et al. 2000, in ASP Conf. Ser. 217: Imaging at Radio through Submillimeter Wavelengths, 50
- Stetson (1980) Stetson, P. B. 1980, AJ, 85, 387
- Tolstoy & Irwin (2000) Tolstoy, E. & Irwin, M. 2000, MNRAS, 318, 1241
- Whiting et al. (1999) Whiting, A. B., Hau, G. K. T., & Irwin, M. 1999, AJ, 118, 2767
- Young & Lo (1997) Young, L. M. & Lo, K. Y. 1997, ApJ, 476, 127
- Zaritsky (1999) Zaritsky, D. 1999, in ASP Conf. Ser. 165: The Third Stromlo Symposium: The Galactic Halo, 34