Prediction of Supersoft X-ray Phase during the 2006 Outburst of RS Ophiuchi
Abstract
RS Ophiuchi (catalog ) is one of the well-observed recurrent novae and also a candidate progenitor of Type Ia supernovae. Its sixth recorded outburst was discovered on 12 February 2006. Detection of a supersoft X-ray phase will provide a firm confirmation of hydrogen shell-burning on the white dwarf and its turn-on/turn-off dates strongly constrain a mass range of the white dwarf, which clarify whether or not RS Oph (catalog ) becomes a Type Ia supernova. For a timely detection of its supersoft X-ray phase, we have calculated outburst evolution of RS Oph (catalog ) based on the optically thick wind theory and predicted a supersoft X-ray phase for the 2006 outburst: it will most probably start on day and continue until day after the optical maximum. Its duration is so short as only a month or so. We strongly recommend multiple observations during April, May, and June of 2006 to detect turn-on and turn-off times of the supersoft X-ray phase.
Subject headings:
binaries: close — binaries: symbiotic — novae, cataclysmic variables — stars: individual (RS Oph) — supernovae: general — white dwarfs1. Introduction
The recurrent nova RS Ophiuchi (catalog ) has undergone its sixth recorded outburst on 12 February 2006 (Narumi et al., 2006). The previous five outbursts occurred in 1898, 1933, 1958, 1967, and 1985. One outburst may have been missed between 1898 and 1933 because RS Oph (catalog ) was not recognized as a recurrent nova. These yr recurrence periods indicate both that the white dwarf (WD) mass is very close to the Chandrasekhar mass and that its mass accretion rate is as large as yr-1 (see, e.g., Fig.2 of Hachisu & Kato, 2001b). If the WD mass increases after every outburst, RS Oph (catalog ) will soon explode as a Type Ia supernova (e.g., Nomoto, 1982; Hachisu et al., 1999a; Hachisu & Kato, 2001b). It is, therefore, crucially important to know how close the WD mass is to the Chandrasekhar mass and how much mass is left on the WD after one cycle of nova outburst. We are able to constrain a mass range of the WD if turn-on/turn-off of supersoft X-ray are detected, because it indicates the durations of wind mass loss (how much mass is ejected) and hydrogen shell-burning without wind mass loss (how much mass is left). In this Letter, we have calculated supersoft X-ray phases for RS Oph (catalog ) and predict turn-on and turn-off dates for its timely detection during the current outburst.
2. Optically Thick Wind Model
After a thermonuclear runaway sets in on a mass-accreting WD, its photosphere expands greatly to and the WD envelope soon settles in a steady-state. The decay phase of novae can be followed by a sequence of steady state solutions (e.g., Kato & Hachisu, 1994). We have calculated light curves for the 2006 outburst of RS Oph (catalog ), using the same method and numerical techniques as in Kato & Hachisu (1994),
We solve a set of equations, i.e., the continuity, equation of motion, radiative diffusion, and conservation of energy, from the bottom of the hydrogen-rich envelope through the photosphere. The winds are accelerated deep inside the photosphere so that they are called “optically thick winds.” We have used updated OPAL opacities (Iglesias & Rogers, 1996). We simply assume that photons are emitted at the photosphere as a blackbody with the photospheric temperature of . Physical properties of these wind solutions have already been published (e.g., Hachisu & Kato, 2001a, b, 2004; Hachisu et al., 1996, 1999a, 1999b, 2000, 2003; Kato, 1983, 1997, 1999). We have integrated
| (1) |
and followed time-evolution of a nova. Here, is the hydrogen-rich envelope mass, the wind mass loss rate, the consumption rate of the envelope mass by nuclear burning, and the mass accretion rate. Both the wind mass loss () and nuclear burning () rates are calculated from our wind solution having the envelope mass of . We assume no mass accretion () during the outburst.
Optically thick winds stop () after a large part of the envelope is blown in the winds. The envelope settles into a hydrostatic equilibrium where its mass is decreasing only by nuclear burning.
When the nuclear burning decays, the WD enters a cooling phase, in which the luminosity is supplied with heat flow from the ash of hydrogen burning.
In the optically thick wind model, a large part of the envelope is ejected continuously for a relatively long period (e.g., Kato & Hachisu, 1994). After the maximum expansion of the photosphere, it gradually shrinks keeping the total luminosity () almost constant. The photospheric temperature () increases with time because of . The main emitting wavelength of radiation moves from optical through supersoft X-ray. This causes the decrease in optical luminosity and the increase in UV. Then the UV flux reaches a maximum. Finally the supersoft X-ray flux increases after the UV flux decays. Thus, we can follow the development of supersoft X-ray light curves (e.g., Hachisu & Kato, 2005).
These timescales depend very sensitively on the WD mass if the WD mass is very close to the Chandrasekhar mass. This is because the WD radius is very sensitive to the increase in mass near the Chandrasekhar mass. The timescale also depends weakly on the chemical composition of envelopes.
3. Prediction of Supersoft X-ray Phase
Based on the observation of previous outbursts of RS Oph (catalog ), Hachisu & Kato (2000, 2001b) derived various physical parameters of the star from visual and UV light curve fittings. They concluded that the WD mass is (1) for the solar composition or (2) for a low metallicity of and . Therefore, we have calculated two cases for the metallicity, i.e., and .
Once the unstable nuclear burning sets in, convection widely develops and mixes processed helium with unburned hydrogen. This process reduces the hydrogen content in the envelope by 1020% for massive WDs like in RS Oph (catalog ). We calculated two cases for the hydrogen content, i.e., (mixing) and (no mixing). To summarize, we have calculated total of 14 light curves as tabulated in Table 1.
| turn onaadays from the optical maximum | turn offaadays from the optical maximum | |||
|---|---|---|---|---|
| (days) | (days) | |||
| 0.7 | 0.02 | 1.37 | 56 | 73 |
| 1.35 | 78 | 113 | ||
| 1.34 | 89 | 134 | ||
| 1.33 | 101 | 161 | ||
| 1.3 | 141 | 248 | ||
| 0.5 | 0.02 | 1.37 | 43 | 53 |
| 1.35 | 66 | 85 | ||
| 1.34 | 70 | 95 | ||
| 1.33 | 87 | 120 | ||
| 1.3 | 116 | 175 | ||
| 0.7 | 0.004 | 1.377 | 76 | 99 |
| 1.35 | 124 | 183 | ||
| 0.5 | 0.004 | 1.377 | 63 | 76 |
| 1.36 | 86 | 109 |
Figure 1 depicts our recommended model of RS Oph (catalog ). Here we assume the response ( keV) of XRT onboard Swift, a WD mass of , a chemical composition of and , a distance of kpc, and no interstellar absorption. We expect similar flux for EPIC CCD MOS and 7 times larger flux having a similar shape of light curve profile for a wider effective area of EPIC CCD pn both onboard XMM-Newton.
After the optical maximum, the photosphere gradually shrinks with the envelope mass being lost in the wind. The temperature increases with time but is still lower than K ( eV) until the wind stops on day 87. Thus, in this wind phase, the expected supersoft X-ray flux is not so high as shown in Figure 1 (dotted part). Moreover, supersoft X-rays are probably obscured by the optically thick wind itself because the wind mass loss rate is as large as yr-1. Supersoft X-rays are not observed or its flux is very low during the wind phase. Therefore, we define turn-on time of supersoft X-ray as the time when the wind stops. It is 87 days after the optical maximum in the case of Figure 1. On that day the photospheric temperature is as low as (K) but quickly increases to reach the maximum temperature of (K) on day 116.
Stable hydrogen shell-burning ends on day 120, where the photospheric temperature is (K). After that, the supersoft X-ray flux as well as the total luminosity quickly decays. Then, we define the date of ”supersoft X-ray turn-off” as the time when stable nuclear burning ends (see, e.g., Hachisu & Kato, 2005).
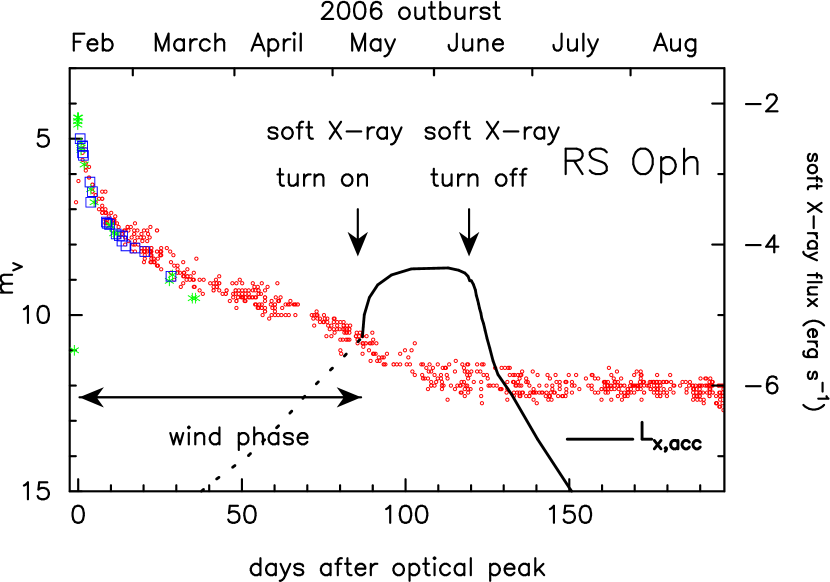
Figure 2 shows supersoft X-ray fluxes for the WD masses of , 1.35, 1.33 and . Here, we assume and . The supersoft X-ray phase lasts 107 days for but only 17 days for .
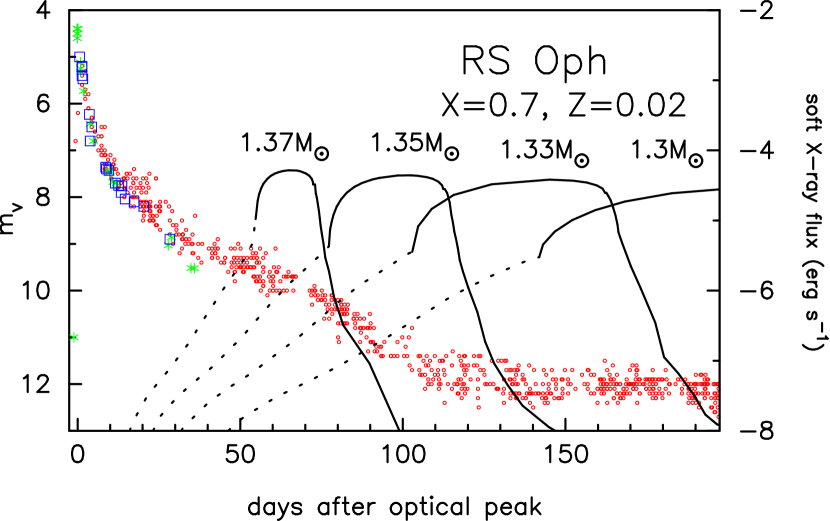
Figure 3 shows supersoft X-ray fluxes for lower hydrogen content of and . This figure shows four cases of the WD mass. The duration of supersoft X-ray phase becomes shorter than those in Figure 2.

Low metallicities have been suggested for the giant companion of RS Oph (catalog ) (Scott et al., 1994; Contini et al., 1995; Smith et al., 1996). Figure 4 shows supersoft X-ray fluxes for a low metallicity of .
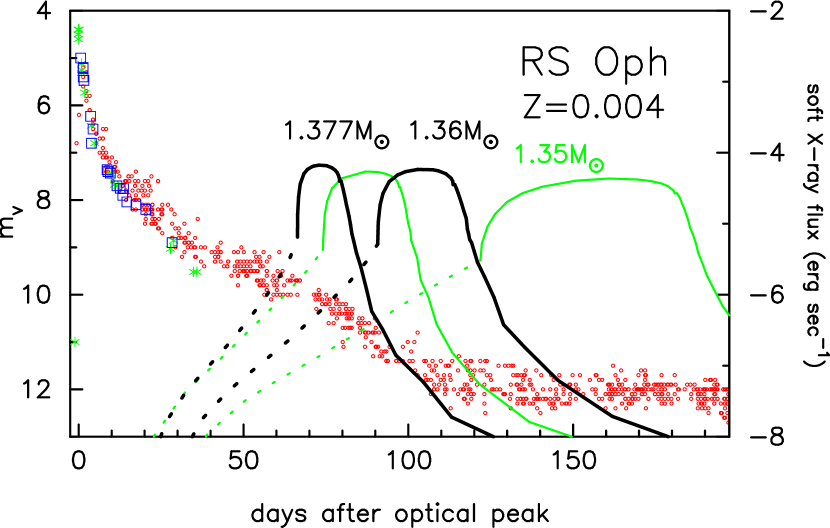
The development of outburst depends both on the WD mass and on the chemical composition. (1) Less massive WDs evolve more slowly because of a large envelope mass on the WD. (2) Less hydrogen contents of envelopes make nova evolution more quickly because of earlier consumption of hydrogen. (3) Lower metallicities of envelopes slow down nova evolution because of less amount of catalyst in the CNO-cycle and less acceleration of the winds (optically thick winds are driven by an opacity peak that is due to iron lines).
4. Discussion
In the present 2006 outburst, strong X-rays were already detected 3 days after the discovery with XRT onboard Swift (Bode et al., 2006). Mason et al. fitted the X-ray spectrum with a high-temperature thermal bremsstrahlung model. Ness et al. (2006) reported high-resolution X-ray spectra of the 2006 outburst, obtained on Feb. 26 (two weeks after the outburst). Their Chandra X-ray observation indicates high plasma temperatures of K.
In the 1985 outburst, RS Oph (catalog ) became a strong X-ray source with characteristic temperature of a few times K (Mason et al., 1987). Mason et al. made six separate observations with EXOSAT, 55, 62, 74, 83, 93, and 251 days after the optical maximum. The source became very weak on and after day 83 in the medium-energy proportional counter array (ME) and only upper limits were derived. They interpreted these early X-ray fluxes in terms of emissions from the pre-outburst M-giant’s wind that had been shock-heated by the outburst ejecta (see also Bode & Kahn, 1985; Itoh & Hachisu, 1990; O’Brien, Bode, & Kahn, 1992).
In the later stage, there was still some residual X-ray emission detected only with the low-energy imaging telescope (LE) onboard EXOSAT even on day 251. Mason et al. (1987) interpreted this late X-ray emission in terms of hydrogen shell-burning that still continues on top of the WD. This is not consistent with our model calculation because the steady hydrogen shell-burning ended long before day 251, i.e., on day (see Hachisu & Kato, 2001b, for more detailed discussion). Instead, Hachisu & Kato (2001b) assumed an accretion disk remaining even during the outburst and interpreted this soft X-ray emission as accretion luminosity rather than nuclear burning luminosity, mainly because the observed flux is too low to be compatible with that for hydrogen burning.
The accretion luminosity is estimated as
| (2) |
for an appropriate mass accretion rate of yr-1 (Hachisu & Kato, 2001b). This accretion X-ray flux is times smaller than that for nuclear burning as indicated in Figure 1.
If X-ray satellites will frequently observe RS Oph (catalog ), we are able to distinguish X-ray of nuclear burning from that of accretion. It is because,as shown in Figures 14, we can recognize from the shape of light curves whether it is originated from nuclear burning or not. The light curve shape itself is independent of the distance or absorption.
We have assumed no interstellar (or circum-binary matter) absorption in our predicted X-ray fluxes. Here we discuss absorption effects due to interstellar or circum-binary matter. Mason et al. (1987) referred to a column density of cm-2 toward RS Oph (catalog ) (see also Hjellming et al., 1986). Although we do not present here how much the flux is reduced due to absorption by this amount of column density, it is worth noting that a luminous supersoft X-ray phase was detected with BeppoSAX in the 1999 outburst of the recurrent nova U Sco (catalog ) (Kahabka et al., 1999). Kahabka et al. estimated a column density of cm-2 for a blackbody model, or cm-2 for a WD atmosphere model. The WD mass was estimated to be by Hachisu et al. (2000), which is similar to that for RS Oph (catalog ). Moreover, the distance to U Sco (catalog ) is much more far away ( kpc) than that to RS Oph (catalog ) ( kpc). If the estimated column densities both for RS Oph (catalog ) and U Sco (catalog ) are correct, we expect a luminous supersoft X-ray phase also in RS Oph.
However, the cool giant’s wind may obscure supersoft X-rays. Orio (1993) observed RS Oph (catalog ) with ROSAT in the quiescent phase 7 yrs after the outburst. The observed flux of erg s-1 is too low to be compatible with the accretion luminosity given in equation (2). One possible explanation is an absorption by the cool giant’s wind as suggested by Anupama & Mikołajewska (1999).
If the cool wind obscures the WD, supersoft X-rays of nuclear burning may not be observable until the cool giant’s wind is swept away. In the 1985 outburst, X-ray rapidly decayed from day 70–80. Mason et al. (1987) interpreted this decay as that the blast shock had broken out of the cool giant’s wind on day . We regard day 70–80 as the time when the cool giant’s wind is swept away. If the WD wind stops before day 70–80, accurate turn-on time of supersoft X-ray may be missed. However, we are still able to determine the WD mass only from the turn-off time if it is detected.
The cool giant’s wind, once swept away by the hot WD ejecta, will again fill its Roche lobe and accrete onto the hot component in a timescale of days. When accretion onto the WD resumes, the accretion disk brightens up, which is roughly consistent with the recovery of the quiescent magnitude from 12 to 11 mag on day of the previous outburst (see, e.g., Fig.1 of Evans et al., 1988). Once the cool wind covers the hot WD, supersoft X-rays are absorbed. Therefore, a luminous supersoft X-ray phase may be observable only during day .
Another good indicator of WD mass is a UV 1455 Å band of continuum flux proposed by Cassatella et al. (2002). Hachisu & Kato (2005) and Kato & Hachisu (2005) showed that their optically thick wind model well reproduces simultaneously both the supersoft X-ray and UV 1455 Å light curves of the classical nova V1974 Cyg. They estimated the WD mass as . Thus we are able to determine the WD mass using the UV 1455 Å light curve when the chemical composition of ejecta is accurately given. Determination of chemical composition is definitely required for RS Oph (catalog ).
References
- Anupama & Mikołajewska (1999) Anupama, G. C., & Mikołajewska, J. 1999, A&A, 344, 177
- Bode et al. (2006) Bode, M. F., et al. 2006, IAU Circ., 8675, 1
- Bode & Kahn (1985) Bode, M. F., & Kahn, F. D., 1985, MNRAS, 217, 205
- Cassatella et al. (2002) Cassatella, A., Altamore, A., & González-Riestra, R. 2002, A&A, 384, 1023
- Contini et al. (1995) Contini, M., Orio, M., & Prialnik, D. 1995, MNRAS, 275, 195
- Evans et al. (1988) Evans, A., Callus, C. M., Albinson, J. S., Whitelock, P. A., Glass, I. S., Carter, B., & Roberts, G. 1988, MNRAS, 234, 755
- Hachisu & Kato (2000) Hachisu, I., & Kato, M. 2000, ApJ, 536, L93
- Hachisu & Kato (2001a) Hachisu, I., & Kato, M. 2001a, ApJ, 553, L161
- Hachisu & Kato (2001b) Hachisu, I., & Kato, M. 2001b, ApJ, 558, 323
- Hachisu & Kato (2004) Hachisu, I., & Kato, M. 2004, ApJ, 612, L57
- Hachisu & Kato (2005) Hachisu, I., & Kato, M. 2005, ApJ, 631, 1094
- Hachisu et al. (2000) Hachisu, I., Kato, M., Kato, T., & Matsumoto, K. 2000, ApJ, 528, L97
- Hachisu et al. (1996) Hachisu, I., Kato, M., & Nomoto, K. 1996, ApJ, 470, L97
- Hachisu et al. (1999a) Hachisu, I., Kato, M., & Nomoto, K. 1999a, ApJ, 522, 487
- Hachisu et al. (1999b) Hachisu, I., Kato, M., Nomoto, K., & Umeda, H. 1999b, ApJ, 519, 314
- Hachisu et al. (2003) Hachisu, I., Kato, M., & Schaefer, B. E. 2003, ApJ, 584, 1008
- Hjellming et al. (1986) Hjellming, R. M., van Gorkom, J. H., Seaquist, E. R., Taylor, A. R., Padin, S., Davis, R. J., & Bode, M. F. 1986, ApJ, 305, L71
- Iglesias & Rogers (1996) Iglesias, C. A., & Rogers, F. J. 1996, ApJ, 464, 943
- Itoh & Hachisu (1990) Itoh, H., & Hachisu, I. 1990, ApJ, 358, 551
- Kahabka et al. (1999) Kahabka, P., Hartmann, H. W., Parmar, A. N., & Negueruela, I. 1999, A&A, 374, L43
- Kato (1983) Kato, M. 1983, PASJ, 35, 507
- Kato (1990) Kato, M. 1990, ApJ, 355, 277
- Kato (1997) Kato, M. 1997, ApJS, 113, 121
- Kato (1999) Kato, M. 1999, PASJ, 51, 525
- Kato & Hachisu (1994) Kato, M., & Hachisu, I., 1994, ApJ, 437, 802
- Kato & Hachisu (2005) Kato, M., & Hachisu, I., 2005, ApJ, 633, L117
- Krautter et al. (1996) Krautter, J., Ögelman, H., Starrfield, S., Wichmann, R., & Pfeffermann, E. 1996, ApJ, .456, 788
- Mason et al. (1987) Mason, K. O., Córdova, F. A., Bode, M. F., Barr, P. 1987, RS Ophiuchi (1985) and the Recurrent Novae Phenomenon, ed. M. F. Bode (VNU Science Press, Utrecht), 167
- Narumi et al. (2006) Narumi, H., Hirosawa, K., Kanai, K., Renz, W., Pereira, A., Nakano, S., Nakamura, Y., & Pojmanski, G. 2006, IAU Circ., 8671, 2
- Ness et al. (2006) Ness, J.-U. et al. 2006, IAU Circ., 8683, 2
- Nomoto (1982) Nomoto, K. 1982, ApJ, 253, 798
- O’Brien et al. (1992) O’Brien, T. J., Bode, M. F., & Kahn, F. D. 1992, MNRAS, 255, 683
- Orio (1993) Orio, M. 1993, A&A, 274, L41
- Scott et al. (1994) Scott, A. D., Rawlings, J. M. C., Krautter, J., & Evans, A. 1994, MNRAS, 268, 749
- Smith et al. (1996) Smith, V. V., Cunha, K., Jorissen, A., & Boffin, H. M. J. 1996, A&A, 315, 179