Probing Multiple Sight Lines through the SN 1006 Remnant by UV Absorption Spectroscopy
Abstract
Absorption-line spectroscopy is an effective probe for cold ejecta within an SNR, provided that suitable background UV sources can be identified. For the SN 1006 remnant we have identified four such sources, in addition to the much-studied Schweitzer-Middleditch (SM) star. We have used STIS on HST to obtain UV spectra of all four sources, to study “core samples” of the SN 1006 interior. The line of sight closest to the center of the SNR shell, passing only 20 away, is to a QSO at . Its spectrum shows broad Fe II absorption lines, asymmetric with red wings broader than blue. The similarity of these profiles to those seen in the SM star, which is 28 from the center in the opposite direction, confirms the existence of a bulge on the far side of SN 1006. The Fe II equivalent widths in the QSO spectrum are greater than in the SM star, suggesting that somewhat more iron may be present within SN 1006 than studies of the SM star alone have indicated, but this is still far short of what most SNIa models require.
The absorption spectrum against a brighter QSO seen at 57% of the shell radius shows broad silicon absorption lines but no iron other than narrow, probably interstellar lines. The cold iron expanding in this direction must be confined within , also consistent with a high-velocity bulge on the far side only. The broad silicon lines indicate that the silicon layer has expanded beyond this point, and that it has probably been heated by a reverse shock—conclusions consistent with the clumpy X-ray structure and anomalous abundances observed from Chandra in this region. Finally, the spectra of two stars near the southern shell rim show no broad or unusually strong absorption lines, suggesting that the low-ionization ejecta are confined within 83% of the shell radius, at least at the azimuths of these background sources.
Vol. 624, pp 189–197, 2005 May 1
1 Introduction
Young remnants of supernovae provide invaluable opportunities for probing supernova ejecta and for making the connection between the supernovae and their progenitor stars. Spectroscopy in the optical, ultraviolet, and X-ray regimes has achieved dramatic success at identifying emission lines from virtually all the important chemical elements expected in the ejecta of either core-collapse or white-dwarf supernovae. Once the pyrotechnics of the original supernova display have subsided, ejecta material that we see radiating emission lines must first be excited—usually by a strong reverse shock that propagates inward (in the Lagrangian sense) through the expanding ejecta. Ejecta material that has not been shocked will remain cold and will not radiate, thus leaving it invisible through emission spectroscopy no matter how exquisite the instruments astronomers bring to bear. Large quantities of cold material likely reside inside many supernova remnants (SNRs), and this is especially likely in remnants where the surrounding interstellar medium (ISM) has extremely low density, so secondary shocks are slow to develop.
An alternative to emission-line spectroscopy that can probe cold material inside an SNR is absorption-line spectroscopy, but this requires the presence of a suitable background light source that can be seen shining through the SNR shell. Since the strong permitted lines from low-ionization species lie almost exclusively in the ultraviolet, “suitable” means UV-bright, with the additional requirement of relatively low absorption along the line of sight. UV absorption spectroscopy has been exploited to probe a only handful of large, nearby SNRs, e.g., Vela (Jenkins et al., 1976, 1984, 1998), the Monoceros Loop (Welsh et al., 2001), and the Cygnus Loop (Blair et al., 2004). These are quite different from SN 1006 in that all have old, highly evolved shells, and the absorbing matter is mainly interstellar material swept up and heated by the SNR shock.
More interesting from the standpoint of shedding light on supernovae and nucleosynthesis are young remnants, but the relative rarity and small sizes of these make absorption spectroscopy more difficult to employ. So far one young Galactic SNR—the SN 1006 remnant = G327.6+14.6—has been probed through UV absorption along a single line of sight. In addition, the SN 1885 remnant in M31, discovered through its absorption in Fe I 3860 and Ca II 3934, 3968 by Fesen et al. (1989), has also been studied spectroscopically in the UV (Fesen et al., 1999). For SN 1006, Schweizer & Middleditch (1980) identified an OB subdwarf star (henceforth the SM star), located only 28 from the projected center of the 15′ radius shell, at a distance that is probably only slightly greater than the kpc distance (Winkler et al., 2003) to the remnant itself.
The opportunity to use the SM star to study SN 1006 ejecta in absorption was first realized by Wu et al. (1983) using IUE. This and follow-up IUE observations (Fesen et al., 1988) revealed the presence of strong, broad Fe II absorption lines centered near zero velocity. The IUE observations also showed broad absorption lines in the far-UV, which Wu et al. (1983) identified as redshifted Si II, Si III, and Si IV. While clearly indicating the presence of cold iron within SN 1006, the inferred mass fell well short of the several tenths of a solar mass expected from a Type Ia supernova, which the preponderance of present evidence indicates that the SN 1006 event must have been (Schaefer, 1996; Stephenson & Clark, 2002; Winkler et al., 2003). Blair et al. (1996) used the Hopkins Ultraviolet Telescope to explore the spectral region below Ly , where they found only very marginal evidence for Fe III absorption, indicating that the “missing” iron must, if present, be mainly ionized more highly than Fe++. Subsequently, Wu et al. (1993, 1997) used the Faint Object Spectrograph (FOS) on the Hubble Space Telescope to observe the SM star with significantly higher signal to noise than had been possible from IUE, revealing weaker absorption lines from the ejecta as well as narrow stellar and interstellar absorption lines. From a detailed analysis of these data, Hamilton et al. (1997, henceforth HFWCS) concluded that the profiles require a strong back-to-front asymmetry in the ejecta and that both shocked and unshocked silicon are required. They inferred a total silicon mass and an iron mass , with a 3 upper limit of . Even the upper limit for the iron mass is significantly less than the 0.3 to 0.8 expected from current models of Type Ia SNe (e.g. Höflich et al., 1998; Bravo et al., 2004). Since the observations were limited to a single line of sight through the remnant, however, the mass estimates were based on a model that assumed azimuthal symmetry about an axis along the line of sight through the center of the shell.
Additional lines of sight—“core samples”—through SN 1006 would have obvious value in elucidating the remnant structure. Winkler & Long (1997b) identified a second UV “light bulb” behind SN 1006: the QSO 1504–4152, a quasar with located 9′ NE of the remnant center. In this paper we report the first UV spectra from this object, as well as for three other background sources: a fainter () QSO only 21 north of the shell center, and two early-type stars located just inside the southern limb of the remnant.
2 Observations
2.1 Optical Identification of Background Sources
The QSO 1504–4152, hereafter Q1, first drew our attention as a faint, unresolved X-ray source in a ROSAT HRI observation of SN 1006, and we subsequently identified it as a quasar at in spectra obtained at the CTIO 1.5-m telescope (Winkler & Long, 1997a, b). Buoyed by this success, we then attempted to identify other background UV sources. In 1997 February we obtained a set of UBV images obtained of the SN 1006 region from the CTIO 0.9-m telescope. Our four contiguous 14′ square fields covered almost all of the 30′ diameter shell the SNR. From these images we identified 7 new candidates that had relatively blue colors () and that were bright enough for spectroscopic observation at UV wavelengths from HST to be practicable.
We then obtained spectra of all 7 optical candidate, plus the SM star and QSO 1504–4152, with the 4-m Blanco telescope at CTIO in good observing conditions in 1998 June 24–26 (UT). We used the RC spectrograph with the 527 line mm-1 KPGL3 grating, Blue Air Schmidt camera, and the Loral 3K CCD to cover the range 3200–6700 Å at a dispersion of . With a slit width of 15, the resolution (judged from arc lamp spectra and from night sky lines) was 3.9 Å. We reduced the spectra using standard IRAF111IRAF is distributed by the National Optical Astronomy Observatories, which is operated by the AURA, Inc. under cooperative agreement with the National Science Foundation. procedures; we used exposures of several spectrophotometric standard stars from Hamuy et al. (1992) for flux calibration.
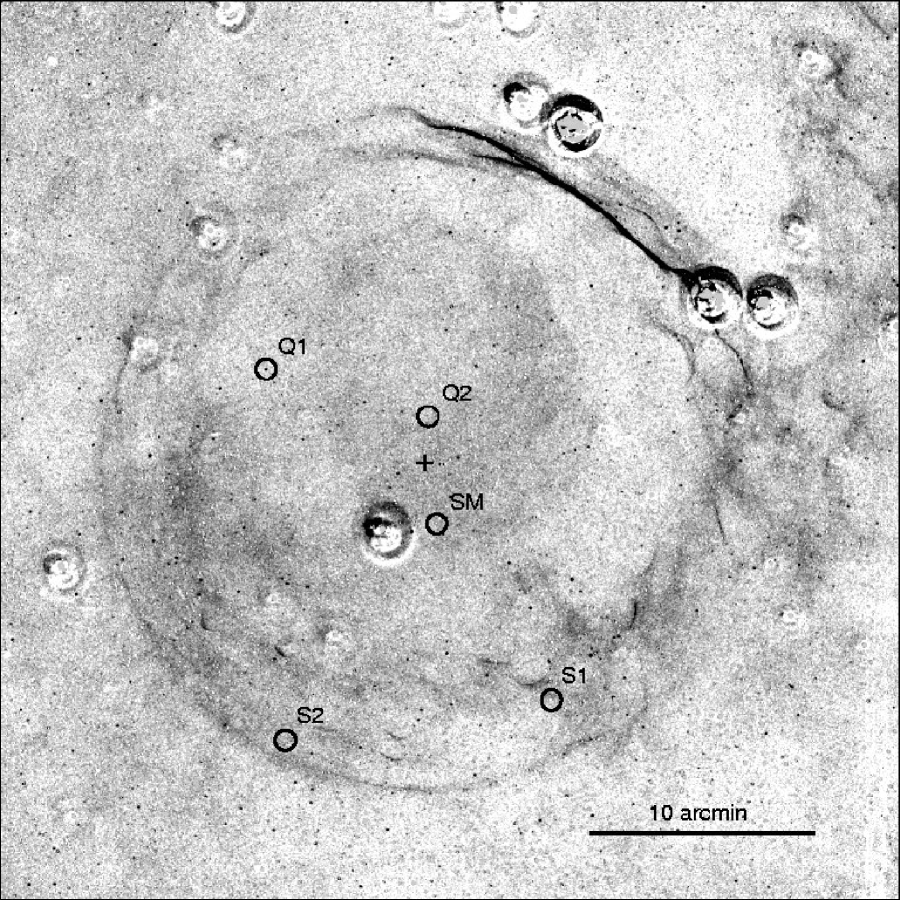
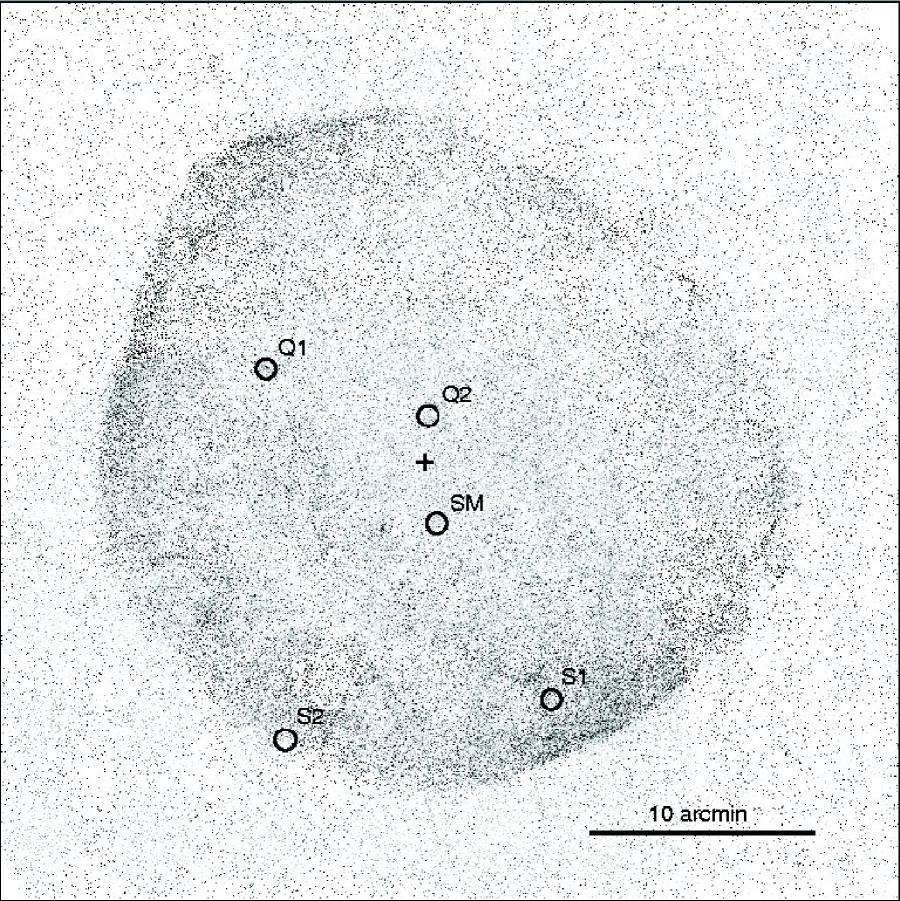
The spectra allowed us to identify three additional objects that appeared to be good candidates for “UV lightbulbs” at distances beyond SN1006, and to exclude the remainder. Figures 1 and 1b illustrate (in both H and X-ray images) the locations of these objects, as well as those of the previously identified QSO (Q1) and the SM star, relative to the SN 1006 shell. One of the candidates, hereafter Q2, is a , QSO, based on the broad emission features centered at 5665 Å and Å, which represent redshifted Mg II and C III] , respectively.222The best-fit redshift for the optical spectrum alone is , but for the UV-optical combination the best fit is . We adopt the latter value throughout this paper.

Two other candidates, hereafter designated S1 and S2, are stars located near the rim of the SNR, both with effective temperatures of about 10,000 K based on comparisons with stellar model spectra. The Balmer line profiles and the strengths of weaker lines indicate that both are probably B9V to AOV stars, as shown in Figure 3. Similar comparisons indicate that the remaining candidates are nearby DA white dwarfs, and hence uninteresting from the perspective of using them for observing absorption in SN1006. Table 1 provides positions and observational details for the three new objects, as well as for the SM star and QSO 1504–4152.
Both QSOs are obviously background sources to SN 1006, and we believe that both the stars are as well. Several lines of argument all lead to a distance to SN 1006 near 2 kpc (Schaefer, 1996). Winkler et al. (2003) used a combination of proper-motion measurements and the shock velocity (Ghavamian et al., 2002) to obtain a geometric distance to the remnant of 2.180.08 kpc, corresponding to a distance modulus . Stars S1 and S2 have apparent magnitudes and 16.61, respectively; if we assume that both are A0V stars with absolute magnitude (Drilling & Landolt, 2000) and extinction (comparable to that for the SM star333Most estimates of to the SM star cluster near this value: 0.32 (Schweizer & Middleditch, 1980), 0.31 (Wu et al., 1993), 0.34 (Blair et al., 1996), and 0.36 (HFWCS). The one discrepant estimate is 0.48 by Burleigh et al. (2000).), then the two stars have distance moduli 12.54 and 15.61, respectively, both comfortably beyond SN 1006. The exact spectral type does not change this conclusion. Even if S1, the brighter of the two stars, were as late as A2V, with an effective temperature almost 1000 K below that of our best-fit models, it would still be at a greater distance than SN 1006.
(Note that the distance to the SM star itself is quite uncertain. Schweizer & Middleditch (1980) estimated , a distance range of 0.5 to 2.5 kpc. Burleigh et al. (2000) later argued for a somewhat tighter range: kpc. But unless the absorption lines in the SM star spectrum stem from some pathological origin it must surely be beyond SN 1006.)
2.2 STIS Spectra of the Background Sources
Once a set of UV sources behind SN1006 had been identified, the next step was to obtain spectra with HST. Q1 had never been observed previously with HST, and so we obtained spectra of it as well as the three new candidates, Q2, S1 and S2. Our observations with HST were carried out with STIS using the low-resolution G140 or G230L gratings, the 52 aperture, and the FUV or NUV MAMA detector operating in photon-counting mode. The G140L spectra cover the wavelength range 1150-1740 Å with a dispersion of , while the G230L spectra cover the range 1570-3180 Å with a dispersion of . Given the velocity widths of order in the ejecta of SN1006, lines from the ejecta were expected to be (and are) well-resolved. All of the sources, except for Q2 which is quite faint in the FUV, were observed with both instrumental setups in order to obtain as complete a description of the line-of-sight abundances as possible. A log of the observations is presented in Table 2. There were no anomalies during the observations themselves.
All of the data were processed using the standard STIS pipeline and calibration files available in 2002 March in order to extract time-averaged spectra. As discussed below, both quasar spectra show clear evidence of broad absorption lines at the positions of transitions which had been detected in absorption in the IUE and HST spectra of the SM star (Wu et al., 1983; Fesen et al., 1988; Wu et al., 1993, 1997). Neither of the two stars observed shows similar absorption features in its spectrum. If our assumption that the stars lie beyond SN 1006 is correct, this indicates that low-ionization ejecta are much less prominent along the lines of sight to these objects, located near the periphery of SN 1006 shell, than along the lines of sight that pass more centrally through the remnant.

3 Results
Since the benchmark for absorption in SN 1006 is the SM star, we show in Figure 4 its complete UV-optical spectrum. We combined the (previously published) FOS data taken with three gratings—G270H, G190H (Wu et al., 1993) and G130H (Wu et al., 1997)—with our new data from the CTIO 4m. Minor inconsistencies in the absolute flux levels from the four separate observations were removed by scaling the levels to achieve consistency in the regions of overlap. We used scaling factors as follows: G130H: 0.96, G190H: 0.89, G270H: 1.00, 4m: 1.15. As can be inferred from the necessity for such scaling, there are systematic uncertainties as large as 15% in the absolute flux shown in Figure 4.


In order to investigate any posited foreground absorption against the new sources, we must compare the spectrum of each with a template (unabsorbed) spectrum from a similar source. For the two QSO’s, we have used as a template the composite QSO spectrum from Zheng et al. (1997), redshifted to match our background objects. Figures 5 and 6 show the combinations of our 4m optical spectra and STIS UV spectra for QSOs Q1 and Q2, respectively. We have dereddened these spectra by arbitrarily taking , essentially the same as that for the SM star, under the assumption that the great majority of the reddening/extinction occurs in the portion of the Galaxy between us and SN 1006, which lies at a distance of 550 pc above the Galactic plane. We used the empirical extinction function of Cardelli et al. (1989) for the dereddening. Also shown in the figures is the template QSO, redshifted to z = 0.337 and 1.026 for Q1 and Q2, respectively, and normalized spectra obtained by simply dividing our combined spectra by the appropriate template. The match between our spectra and the template is quite good in both cases—perhaps surprisingly so for combined spectra from different instruments on the ground and in space.


The clearest evidence for foreground absorption is seen in Q2, where broad absorption lines from Fe II and are apparent, as shown in a plot of this region of the normalized spectrum in Figure 7.444In actuality each of these two lines is the strongest component of a multiplet; see HFWCS for more details. Also shown in Figure 7 is the HST-FOS spectrum from the SM star, normalized by a fit to the continuum based on featureless regions of the spectrum. (This is very similar to that illustrated in Figures 5 and 6 of HFWCS.) In the Q2 spectrum the line profile for the 2383 Å line is confused by the proximity of redshifted Ly , which results in imperfect normalization of the spectrum near 2460 Å; the 2600 Å line is considerably cleaner so we use that for most of our subsequent analysis. The absorption profiles along the lines of sight to the SM star and Q2 appear quite similar; the lines in both objects show a relatively sharp blue-shifted edge and a more gradual slope on the red-shifted side. Through detailed fits to the SM star spectrum, HFWCS concluded that absorbing Fe+ is present at velocities from . The blue-shifted edge in the Q2 spectrum occurs at somewhat lower velocity: for the 2600 Å line, the edge occurs at , while in the noisier 2383 Å line, the blue edge is at .
The Fe II absorption appears to be somewhat deeper in the Q2 spectrum than in the SM star. The total equivalent width of the Fe II line complex near 2600 Å line in the Q2 spectrum is . This includes several narrow interstellar lines of Fe II and Mn II in addition to the broadened lines at 2600 Å and 2586 Å from SN 1006 itself. We removed the narrow lines and assumed that the broad lines are in the ratio of their oscillator strengths (Morton, 2003) to obtain an equivalent width of for Fe II 2600, compared with 14.8 Å for the same line in the SM star (Wu et al., 1993).
Also shown in Figure 7 is the normalized spectrum from Q1, which shows no Fe II absorption lines even approaching the width or strength of those in the Q2 or SM star spectrum. There is a pair of narrow lines at wavelengths corresponding to the two strongest members of the Fe II 2383 triplet at essentially zero velocity, but we interpret these as being primarily of interstellar origin. While we cannot rule out a small amount of Fe II associated with SN 1006, there is clearly far less than that seen in the core samples toward the two more centrally located background objects.
Figure 8 is a comparison of the region containing Si II and Si IV lines in Q1 and the SM star. Again the QSO spectrum is confused by the presence of redshifted lines in Q1 itself, in this case Ly + O VI, as well as Galactic Ly . The cleanest and strongest line is Si II , which is also the strongest absorption line in the SM star spectrum. For the SM star, the salient features are that all of the absorption is redshifted: there is a narrow component with a sharp red edge at 1290 Å, corresponding to , and a broader component that can be well fit by a Gaussian profile centered at with a dispersion () of ; these two components may be attributed to unshocked and shocked Si II, respectively (Hamilton et al., in preparation). We find that the corresponding feature in Q1 is comparable in equivalent width to that in the SM star spectrum. The Q1 absorption centroid is at , significantly less than for the SM star, and the profile appears to be more symmetrical and possibly a bit broader. The line is consistent with a Gaussian with FWHM 22.7 Å, or dispersion , as shown in the fit in Figure 8.
Q2 is so faint that we did not attempt a spectrum with the G140L setup and thus have no measurement of Si II absorption along this second line of sight at roughly the same distance from the SNR center as the SM star. We discuss the possible implications of both iron and silicon absorption for SN 1006 in the next section.
4 Discussion
The observation of similar absorption profiles in the spectra of Q2 and the SM star rules out the possibility that the SM star might have been the donor star in the pre-SNIa system that gave rise to SN 1006—an idea advanced by Wellstein et al. (1999) and discussed by Burleigh et al. (2000). Since it is surely impossible for a donor star to have a runaway velocity , sufficient for it to have outrun the expanding ejecta, this idea would require the SM star to be within the remnant shell, with some exotic origin for the broad absorption lines in its spectrum. As Burleigh et al. (2000) themselves argued, detection of similar absorption lines in another background object would exclude this possibility. Q2 is just such an object.
4.1 Iron Lines
The lines of sight to Q2 and the SM star probe distinct core samples through SN 1006 that are separated by 48 and located 20 and 28, respectively, from the projected center of the remnant. The qualitative similarity in the iron absorption profiles against these two background objects (Figure 7) strongly suggests that the distribution of absorbing material is similar and that small regional concentrations or partial shells of iron-rich ejecta are not responsible for the observed profiles. The asymmetric profiles for both sources are consistent with the interpretation advanced by HFWCS that most of the Fe II is unshocked ejecta filling the region defined by the reverse shock, but that there is a strong front-back asymmetry with the far side of the SNR expanding more rapidly than the near side. HFWCS further argued that the sharp blue edge for the 2600 Å absorption against the SM star represents the free expansion radius of Fe II that is just reaching the reverse shock. The observation of sharp blue edges for both the 2600 Å and the 2383 Å lines in the Q2 spectrum, at a somewhat different velocity than in the SM star ( for Q2, for the SM star), strengthens this argument. The different velocities mean that the reverse shock has probably penetrated a bit farther into the expanding iron on the near side of the shell in the direction toward Q2, probably reflecting inhomogeneities in the ambient density of the ISM on the near side.
The apparent absence of Fe II aborption (other than narrow interstellar lines) against Q1, which probes a core sample 83 away from the remnant center, indicates that little if any of the iron launched by the supernova explosion has advanced this far out. At a distance of 2.18 kpc, 83 corresponds to a radius of 5.6 pc and an average velocity of over the 995 years from A.D. 1006 until the date of our observations. We expect that cold ejecta will have remained essentially undecelerated since the explosion (otherwise they would have encountered a shock and been heated), so the present velocity should be close to the average one. If the iron ejecta are moving outward at , the velocity for the cold iron on the near side of the remnant as inferred from the two central core samples, then none would have reached the line of sight to Q1, consistent with our observations. This lends credence to a model calling for a high-velocity bulge on the far side of SN 1006.
HFWCS concluded, based on their detailed analysis of absorption along the single line of sight to the SM star spectrum, that there is about of Fe II within SN 1006. They argued that most of the iron should be unshocked and cold, and estimate that the ratio to obtain a estimate for the total iron mass with a upper limit of . Observations from HUT of low Fe III 1123 absorption in the SM star spectrum are also consistent with low ionization and a low total iron mass (Blair et al., 1996). Our observation of absorption against Q2 with similar profile but with equivalent width greater than that against the SM star leads us to revise estimates for the iron mass upward somewhat, to . The second line of sight removes some of the uncertainty associated with the models, so we retain the same upper limit of . The fundamental conclusion reached by all previous absorption studies of SN 1006, that the iron mass is much less than the several tenths of a solar mass expected to be associated with a Type Ia supernova remnant (e.g. Höflich et al., 1998; Bravo et al., 2004), remains unchanged. Indeed, the conclusion that iron is unexpectedly scarce in SN 1006 is solidified by demonstrating that the meager amount of iron along the path to the SM star is not an anomaly.
Other possible support for a smaller amount of iron in the centers of some SNeIa than standard Type Ia models predict comes from a new analysis of late-time infrared emission from SN 2003du, which shows a flat-topped [Fe II] 1.644 m emission profile indicative of a thick but hollow-centered iron ejecta shell (Höflich, et al., in preparation). Less than the “standard” amount of iron in the center of the young SNIa remnant 0509-67.5 in the LMC might also help explain its observed X-ray emission properties (Warren & Hughes, 2004). Finally, there have been theoretical suggestions by Kasen et al. (2004) that a substantial hole in the ejecta might result when a white dwarf explodes and engulfs its nondegenerate companion star. In any case, the UV absorption observations presented here for several sight-lines through SN 1006 make a strong case by themselves that there is significantly less iron than standard models predict in this almost certain SNIa remnant.
4.2 Silicon Lines
In the SM star, Si II 1260 shows a highly redshifted profile. Indeed it is this profile, more than the Fe II profiles, that requires a very asymmetric distribution of material along a line of sight passing near the center of the SNR. HFWCS argued that the profile comprises two components: the more redshifted component consists of material still freely expanding inside the reverse shock. The second component represents post-shock ejecta, which are physically located outside of the reverse shock but have a lower velocity, since they have been decelerated in passing through that shock. The absence of appreciable Si II absorption near zero velocity implies that there is little silicon in much of the region occupied by iron in the SNR. Likewise, the spectrum of the SM star also shows no evidence for shocked or unshocked Si II from the near side of the SNR. The possibility that some high velocity blueshifted Si II 1260 is hidden in the red wing of Si III 1206 is excluded by the absence of corresponding blueshifted Si II 1527.
The strong Si II absorption along the line of sight to Q1, which passes 83 from the center of the shell, indicates that much of the expanding silicon has advanced farther out than this line of sight. The observation that the Si II absorption is redshifted in the spectra of both the SM star and Q1 means that the asymmetry observed in the Si II absorption along the line of sight to the SM star extends over much of the far side of the SNR, consistent with a picture in which the ambient density on far side is lower than on the near side. The shift in the line centroid of only for Q1, rather than as for the SM star, can be understood qualitatively as a projection effect: the bulk velocity of the material should be radial with respect to the site of the SN explosion, so material we see farther from the center must have a greater tangential component and a lesser one along the line of sight.
The approximately Gaussian profile of redshifted Si II absorption suggests that the line of sight to Q1 is almost tangent to the reverse shock. If the line of sight to Q1 were well inside the reverse shock, then the Si II 1260 Å absorption profile would be shaped more like a top hat, with sharp blue and red edges, contrary to our observations. Conversely, if the line of sight from Q1 were well outside the reverse shock, then the Si would have been collisionally ionized to high ionization stages such as are observed in X-rays (Dyer et al., 2001; Long et al., 2003), and there would be no Si II observed in absorption, again contrary to observation.
The width of the Si II 1260 line may result from a combination of factors: (1) line-of-sight variations in the expanding shell of unshocked Si II; (2) thermal velocity broadening of the shocked Si II; and (3) a mixture of unshocked and shocked Si II, as is required to account for the absorption profile in the SM star spectrum. The Gaussian FWHM of 22.7 Å corresponds to a dispersion of . If we assume that this results entirely from the thermal velocity width of material heated on passing through the reverse shock, the reverse shock velocity would be . This is almost twice as great as the reverse shock velocity inferred from the shocked Si II at far side of the remnant along the line of sight to the SM star and is likely an overestimate. Nevertheless, it seems probable that at least some of the silicon in the core through SN 1006 sampled by the Q1 spectrum has been shocked. This is consistent with the assertions made by Long et al. (2003) based both on the clumpiness of the X-ray emission in this region and on fits to the Chandra ACIS X-ray spectra that seemed to require abundances very different from those expected from shocked interstellar material. A spectrum with higher signal-to-noise might enable one to sort out how the various effects contribute to the overall line profile.555Hamilton et al.(in preparation) are completing just such a study for the SM star based on STIS data.
4.3 Model Geometry
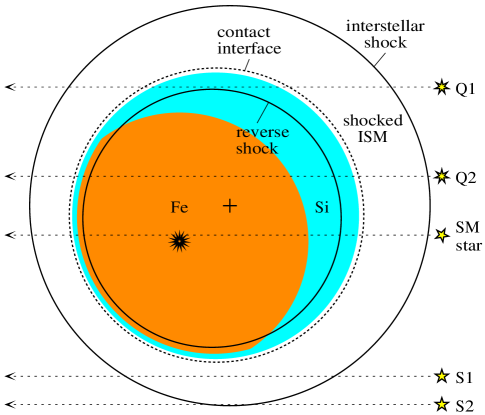
Figure 9 illustrates schematically a model for the structure of SN1006, as inferred from observations of all five background objects. The radial offsets of the background objects are set at their observed radial positions from the geometric center of the remnant, as listed in Table 1. Figure 9 shows the remnant as being almost spherical, whereas HFWCS (their Figure 8) showed the remnant as being elongated by about 20% along the line of sight. The rounder shape comes from the 20% greater distance of adopted here compared to the used by HFWCS.
The center of the original supernova explosion, marked by a cross in Figure 8, is displaced towards the near side of the remnant, as in HFWCS. The displacement of the center to the near side explains how unshocked and low-ionization shocked silicon ejecta are observed only on the far (redshifted) side, and not on the near (blueshifted) side of the remnant. In Figure 9, the line of sight from the SM star intersects the ejecta at various velocities measured from observations: the reverse shock in the iron zone at on the near side, the boundary between the iron and silicon zones at around on the far side, and the reverse shock in the Si zone at on the far side (HFWCS; see also Hamilton et al., in preparation).
In order to make the reverse shock nearly tangent to the line of sight to Q1, as argued above, the explosion center shown in Figure 9 is also displaced to the southwest. This geometry also places the SM star closer to the explosion center (as distinguished from the present remnant center) than Q2. This provides at least a qualitative explanation for the observation that the blue edge of the Fe II absorption is less blueshifted in Q2 than in the SM star.
Of course the actual geometry is probably more complicated than that shown schematically in Figure 9.
5 Summary and Conclusions
We have increased to five the total number of sight lines through the SN 1006 remnant probed by UV absorption spectroscopy. The new observations, combined with earlier ones of the SM star, lead to the following conclusions:
(1) The strong, broad Fe and Si absorption lines seen against the SM star are not an anomaly; similar features are seen in the spectra of the background quasars Q1 and Q2. This rules out any possibility that the SM star might have been the donor star in the pre-SNIa system that gave rise to SN 1006 and that the broad lines are a local phenomenon in or around the star itself.
(2) Absorption of Fe II along the line of sight to Q2, which like that to the SM star passes near the center of the SN 1006 shell, has an equivalent width greater than for the SM star and a similar asymmetric profile. This suggests that there may be slightly more iron within the SN 1006 shell than studies of the SM star have indicated; we estimate with a upper limit of . This does not change the fundamental conclusion of previous absorption studies that there is a deficiency of iron within the SN 1006 shell, compared with the 0.3 to 0.8 that a Type Ia supernova is expected to produce. Indeed, demonstration that cold iron is also scarce along a second line of sight strengthens that basic conclusion.
(3) Strong Si II absorption is seen along the line of sight to Q1, which passes 83 away from the center (57% of the shell radius), indicating that much of the expanding silicon has advanced past this point. The absorption profile is consistent with a broad Gaussian with dispersion , suggesting that the absorbing material has been heated by passing through the reverse shock. Since a single broad Gaussian seems consistent with the data, most of the material along this line of sight has probably been shocked, as would be expected if this core sample passes just outside the present position of the reverse shock.
(4) The absence of Fe II absorption associated with SN 1006 along the line of sight to Q1 indicates that the little if any iron from the SN has advanced this far, and that the ejecta have not been greatly overturned or mixed.
(5) No unusual absorption lines are seen in the spectra of two background stars located near the southern limb of the SNR shell. The silicon and iron ejecta must be confined within of the shell radius, at least at the azimuths of these two stars.
References
- Bagnulo et al. (2003) Bagnulo, S., Jehin, E., Ledoux, C., Cabanac, R., Melo, C., Gilmozzi, R., & The ESO Paranal Science Operations Team. 2003, The Messenger, 114, 10
- Blair et al. (1996) Blair, W. P., Long, K. S., & Raymond, J. C. 1996, ApJ, 468, 871
- Blair et al. (2004) Blair, W. P., Sankrit, R., Torres, S. I., Chayer, P., Danforth, C. W., & Raymond, J. C. 2004, American Astronomical Society Meeting, 204
- Bravo et al. (2004) Bravo, E., Badenes, C., & Garcia-Senz, D. 2004, ArXiv Astrophysics e-prints, astro-ph/0412155
- Burleigh et al. (2000) Burleigh, M. R., Heber, U., O’Donoghue, D., & Barstow, M. A. 2000, A&A, 356, 585
- Cardelli et al. (1989) Cardelli, J. A., Clayton, G. C., & Mathis, J. S. 1989, ApJ, 345, 245
- Drilling & Landolt (2000) Drilling, J. S. & Landolt, A. U. 2000, in Allen’s Astrophysical Quantities, Fourth Edition, ed. A. N. Cox (New York: Springer-Verlag), 381–396
- Dyer et al. (2001) Dyer, K. K., Reynolds, S. P., Borkowski, K. J., Allen, G. E., & Petre, R. 2001, ApJ, 551, 439
- Fesen et al. (1999) Fesen, R. A., Gerardy, C. L., McLin, K. M., & Hamilton, A. J. S. 1999, ApJ, 514, 195
- Fesen et al. (1989) Fesen, R. A., Saken, J. M., & Hamilton, A. J. S. 1989, ApJ, 341, L55
- Fesen et al. (1988) Fesen, R. A., Wu, C., Leventhal, M., & Hamilton, A. J. S. 1988, ApJ, 327, 164
- Ghavamian et al. (2002) Ghavamian, P., Winkler, P. F., Raymond, J. C., & Long, K. S. 2002, ApJ, 572, 888
- Höflich et al. (1998) Höflich, P., Wheeler, J. C., & Thielemann, F. K. 1998, ApJ, 495, 617
- Hamilton et al. (1997) Hamilton, A. J. S., Fesen, R. A., Wu, C.-C., Crenshaw, D. M., & Sarazin, C. L. 1997, ApJ, 481, 838, (HFWCS)
- Hamuy et al. (1992) Hamuy, M., Walker, A. R., Suntzeff, N. B., Gigoux, P., Heathcote, S. R., & Phillips, M. M. 1992, PASP, 104, 533
- Jenkins et al. (1998) Jenkins, E. B., Tripp, T. M., Fitzpatrick, E. L., Lindler, D., Danks, A. C., Beck, T. L., Bowers, C. W., Joseph, C. L., Kaiser, M. E., Kimble, R. A., Kraemer, S. B., Robinson, R. D., Timothy, J. G., Valenti, J. A., & Woodgate, B. E. 1998, ApJ, 492, L147
- Jenkins et al. (1976) Jenkins, E. B., Wallerstein, G., & Silk, J. 1976, ApJS, 32, 681
- Jenkins et al. (1984) —. 1984, ApJ, 278, 649
- Kasen et al. (2004) Kasen, D., Nugent, P., Thomas, R. C., & Wang, L. 2004, ApJ, 610, 876
- Long et al. (2003) Long, K. S., Reynolds, S. P., Raymond, J. C., Winkler, P. F., Dyer, K. K., & Petre, R. 2003, ApJ, 586, 1162
- Morton (2003) Morton, D. C. 2003, ApJS, 149, 205
- Schaefer (1996) Schaefer, B. E. 1996, ApJ, 459, 438
- Schweizer & Middleditch (1980) Schweizer, F. & Middleditch, J. 1980, ApJ, 241, 1039
- Stephenson & Clark (2002) Stephenson, F. R. & Clark, D. H. 2002, Historical Supernovae and their Remnants (Oxford: Oxford U. Press), 150–174
- Warren & Hughes (2004) Warren, J. S. & Hughes, J. P. 2004, ApJ, 608, 261
- Wellstein et al. (1999) Wellstein, S., Langer, N., Gehren, T., Burleigh, M., & Heber, U. 1999, in Astronomische Gesellschaft Meeting Abstracts, 3
- Welsh et al. (2001) Welsh, B. Y., Sfeir, D. M., Sallmen, S., & Lallement, R. 2001, A&A, 372, 516
- Winkler et al. (2003) Winkler, P. F., Gupta, G., & Long, K. S. 2003, ApJ, 531, 829
- Winkler & Long (1997a) Winkler, P. F. & Long, K. S. 1997a, ApJ, 486, L137
- Winkler & Long (1997b) —. 1997b, ApJ, 491, 829
- Wu et al. (1993) Wu, C., Crenshaw, D. M., Fesen, R. A., Hamilton, A. J. S., & Sarazin, C. L. 1993, ApJ, 416, 247
- Wu et al. (1997) Wu, C., Crenshaw, D. M., Hamilton, A. J. S., Fesen, R. A., Leventhal, M., & Sarazin, C. L. 1997, ApJ, 477, L53
- Wu et al. (1983) Wu, C.-C., Leventhal, M., Sarazin, C. L., & Gull, T. R. 1983, ApJ, 269, L5
- Zheng et al. (1997) Zheng, W., Kriss, G. A., Telfer, R. C., Grimes, J. P., & Davidsen, A. F. 1997, ApJ, 475, 469
| Distance from CenteraaThe center is defined as the center of H emission, , (Winkler et al., 2003). The radius is that of the H shell (Figure 1) at the azimuth of the source. represents the average transverse velocity (in ) of material just reaching the line of sight, assuming a distance of 2.18 kpc and an age of 995 years. | PhotometrybbCTIO 0.9m telescope, 1997 Feb. 10–11. | SpectrumccCTIO 4m Blanco telescope, 1998 June 24–26. Total exposure time in seconds; number of frames in parentheses. | |||||||||
|---|---|---|---|---|---|---|---|---|---|---|---|
| Source | R.A. (2000.) | Dec. (2000.) | ′ | % Radius | Exposure | ID and Comments | |||||
| Star 1502–4207 (S1) | 11.9 | 83 | 7420 | 1200 (2) | A0V star | ||||||
| Star (SM) | 2.8 | 19 | 1720 | 4000 (2) | sdOB star | ||||||
| QSO 1503–4155 (Q2) | 2.0 | 14 | 1280 | 4600 (3) | QSO, | ||||||
| Star 1503–4209 (S2) | 13.9 | 92 | 8650 | 600 (1) | A0V star | ||||||
| QSO 1504–4152 (Q1) | 8.3 | 57 | 5160 | 4000 (2) | QSO, | ||||||
| Source | Obs. Date | G140L Exp. | G230L Exp. |
|---|---|---|---|
| (s) | (s) | ||
| QSO-1504-4152 (Q1) | 2000-09-09 | 6000 | 2457 |
| QSO-1503-4155 (Q2) | 2001-09-06 | — | 5457 |
| STAR-1503-4209 (S2) | 2000-06-25 | 1526 | 600 |
| STAR-1502-4207 (S1) | 2000-07-09 | 6000 | 2485 |