Submitted to Monthly Notices
A high resolution UV absorption spectrum of supernova ejecta in SN1006
Abstract
We report a high resolution, far-ultraviolet, STIS E140M spectrum of the strong, broad Si II, III, and IV features produced by the ejecta of SN1006 seen in absorption against the background Schweizer-Middleditch star. The spectrum confirms the extreme sharpness of the red edge of the redshifted Si II 1260 Å feature, supporting the idea that this edge represents the location of the reverse shock moving into the freely expanding ejecta. The expansion velocity of ejecta at the reverse shock is measured to be . If the shock model is correct, then the expansion velocity should be decreasing at the observable rate of per year. The pre-shock velocity, post-shock velocity, and post-shock velocity dispersion are all measured from the Si II 1260 Å feature, and consistency of these velocities with the shock jump conditions implies that there is little or no electron heating in this fast () Si-rich shock.
keywords:
shock waves – supernovae: individual (SN1006) – supernova remnants – ultraviolet: stars1 Introduction
The supernova of 1006 AD (SN1006) was the brightest in recorded history (Stephenson & Green, 2002). It is generally held that SN1006 was a probable Type Ia, the most straightforward evidence for this being its location high above the plane of the galaxy, at the distance measured by Winkler, Gupta & Long (2003). The identification of SN1006 as Type Ia is consistent with a broad range of observational evidence and theoretical expectation. The historical supernova was exceptionally bright, and remained visible over an extended (3 year) period. There is no sign of a pulsar or other central compact object.
The most likely cause of a Type Ia supernova is thought to be the thermonuclear explosion of a white dwarf which accretes from a companion, probably a giant or main sequence star, but possibly a white dwarf (Hillebrandt & Niemeyer, 2000; Höflich et al., 2003; Höflich, 2006). Searches have so far failed to uncover any candidate star that may have been the erstwhile companion in SN1006 (Ruiz-Lapuente et al., 2003).
| Object | RA & Dec (J2000) | Date | Orbits | Exposure (s) |
|---|---|---|---|---|
| PG 0839+399 | 21 Oct 1998 | 1 | 2,494 | |
| SM star | 24-25 Jul 1999 | 8 |
The remnant of SN1006 has been extensively observed in the radio (Reynolds & Gilmore, 1986, 1993; Roger et al., 1988; Moffet, Goss & Reynolds, 1993), optical (Kirshner, Winkler & Chevalier, 1987; Smith et al., 1991; Winkler & Long, 1997; Ghavamian et al., 2002; Sollerman et al., 2003; Winkler, Gupta & Long, 2003), ultraviolet (Raymond, Blair & Long, 1995; Korreck et al., 2004), x-rays (Koyama et al., 1995; Willingale et al., 1996; Winkler & Long, 1997; Vink et al., 2000; Allen, Petre & Gotthelf, 2001; Dyer et al., 2001; Long et al., 2003; Vink et al., 2003; Bamba et al., 2003; Dyer, Reynolds & Borkowski, 2004; Vink, 2005; Kalemci et al., 2006) and -rays (Tanimori et al., 1998, 2001; Aharonian et al., 2005). The observations show a limb-brightened, roughly circular blast wave expanding into an interstellar medium of moderate density, . The x-ray image and spectrum reveal two components of emission: limb-concentrated non-thermal synchrotron radiation from relativistic electrons accelerated at the blast wave, and more generally distributed lumpy thermal emission from a hot plasma enhanced in heavy elements (Long et al., 2003, Fig. 2). The thermal x-ray emission is consistent with what might be expected from the ejecta of a Type Ia supernova explosion (Dyer et al., 2001, Table 5), but the inferences about masses and elemental abundances are model dependent, and alternative interpretations cannot be excluded (but see Badenes et al. 2003 for a more optimistic view).
One of the more direct observational evidences on the nature of SN1006 comes from absorption spectroscopy of a background OB subdwarf star discovered by Schweizer & Middleditch (1980, hereafter the SM star) just south of the projected centre of the radius remnant of SN1006. Ultraviolet spectroscopy of the SM star with the International Ultraviolet Explorer (IUE) by Wu et al. (1983) revealed broad absorption features, which Wu et al. (1983) attributed to Si II, III, and IV, and Fe II in the ejecta of SN1006. The presence of these features was confirmed in subsequent observations with IUE (Fesen & Hamilton, 1988), and at higher resolution and signal-to-noise with the Faint Object Spectrograph (FOS) on the Hubble Space Telescope (HST) (Wu et al., 1993, 1997). Blair, Long & Raymond (1996) used the Hopkins Ultraviolet Telescope (HUT) to observe the spectrum shortward of Ly, finding marginal evidence for the presence of absorption by Fe III 1123 Å. Optically, the SM star shows no evidence for absorption by SN1006 ejecta (Burleigh et al., 2000). Recently, Winkler et al. (2005) have reported observations of four more UV sources behind SN1006, finding clear evidence of absorption by SN1006 ejecta in the two sources nearer to the projected centre.
In an extensive analysis of the HST FOS spectrum of the SM star, Hamilton et al. (1997, hereafter Paper 1) argued that the unusual shape of the broad Si II 1260 Å feature, the strongest absorption feature in the 1150–2000 Å ultraviolet spectrum of the SM star, arises because the feature consists of both unshocked and shocked components. This surprising conclusion was driven by several observational facts. (1) The Si II 1260 Å feature had a sharp red edge, at , which Paper 1 identified as the position of the reverse shock front in the freely expanding ejecta of SN1006. This suggested that the reverse shock in SN1006 is currently moving into ejecta containing Si II. (2) The depth of absorption of the Si II 1260 Å feature implied that the collisional ionization time of shocked Si II is of the order of the 1000 yr age of the remnant. This implied that there should also be Si II in the shocked ejecta. (3) The blue edge of the Si II 1260 Å feature fitted nicely to a broad Gaussian profile, as expected for shocked Si II, and the same Gaussian profile accounted naturally for the slight tail of absorption observed to high velocities . (4) The velocities of unshocked and shocked gas measured from the observed Si II 1260 Å line profile were consistent with the shock jump conditions.
In this paper we report Hubble Space Telescope Imaging Spectrometer (STIS) observations of the SM star behind SN1006, with a spectral resolution of FWHM, times the resolution of the earlier FOS spectrum (Wu et al., 1997). A primary motivation for obtaining the high resolution STIS spectrum was to test the proposal of Paper 1 that the Si II 1260 Å feature indeed reveals ejecta in SN1006 undergoing a reverse shock. A key prediction of the shock model is that the red edge of the Si II 1260 Å feature, representing the position of the reverse shock, should be extremely sharp, since a shock should decelerate gas ‘instantaneously’ from the free expansion velocity to some lower bulk velocity. High resolution spectroscopy can also test for possible problems, such as saturation, or contamination by narrow lines.
One of the main sources of unquantified systematic uncertainty in interpreting the absorption features in the FOS spectrum was the possibility of contamination by stellar lines. We therefore obtained and report here STIS observations of a comparison star PG 0839+399 (Green, Schmidt & Liebert, 1986) identified by Blair et al. (1996) as having not only a similar temperature and gravity, but also similar photospheric abundances, and low extinction.
The STIS spectra reported here do not cover the Fe II 2383 Å and 2600 Å absorption features observed in the SM star with IUE (Wu et al., 1983; Fesen & Hamilton, 1988) and the FOS (Wu et al., 1993, 1997), and more recently in a second background source, the quasar QSO-1503-4155, with low-resolution STIS observations by Winkler et al. (2005).
2 Observations
| Parameter | STIS (this paper) | FOS (Paper 1) |
|---|---|---|
| Expansion velocity into reverse shock | ||
| Mean velocity of shocked Si II | ||
| Dispersion of shocked Si II | ||
| Reverse shock velocity | ||
| Shocked Si II : Si III : Si IV | : : | : : |
Far-ultraviolet echelle spectra of the SM star and of the comparison star PG 0839+399 were obtained in 1998 and 1999 with STIS using the slit, the E140M grating, and the FUV-MAMA detector. The observing log is given in Table 1. The spectra cover 1150–1700 Å in wavelength bins , or , wide. Over the relevant range of the spectra from 1220–1540 Å, the spectral resolution is 1.4 pixels, or , FWHM. The line spread function is non-Gaussian, with a narrow core and broader wings. Over 1220–1540 Å, the signal-to-noise ratio is per pixel and per pixel for the SM star and PG 0839+399 respectively.
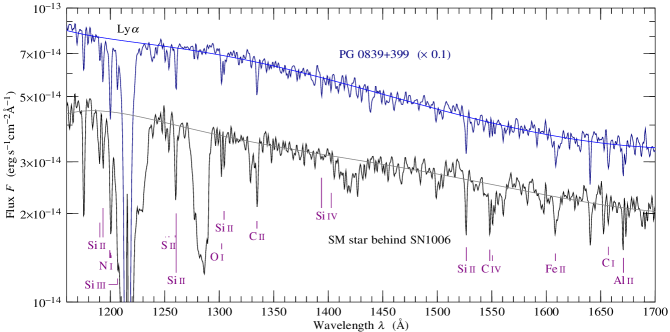
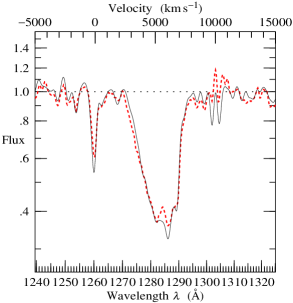
Figure 1 shows the STIS E140M spectra of the SM star and of the comparison star PG 0839+399. Each spectrum has been convolved with a near-Gaussian with a FWHM of . The near-Gaussian is a function proportional to for , with . Such a smoothing function mostly shares the nice theoretical properties of Gaussian smoothing, but extends over only a finite number of pixels. The smoothing is broad so as to bring out the broad absorption features in the spectrum of the SM star; higher resolution versions of the spectra are shown below in §3. There are a few narrow gaps in the spectra longward of , and the spectra were linearly interpolated across these before being smoothed.
The small scale structure in the various spectra in Figure 1 is not noise, but real, mostly stellar features. This fact can be inferred from the good agreement between spectra from the individual exposures of the SM star, apparent for example in the high-resolution zoom of the Si II 1260 Å feature shown in Figure 3 below.
The stellar lines of the comparison star PG 0839+399 are blueshifted, by , relative to those of the SM star. Narrow interstellar absorption lines in PG 0839+399 show no discernible shift relative to those in the SM star.
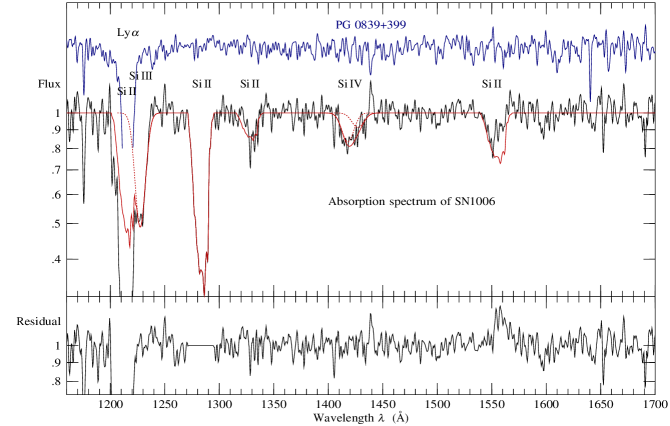
Figure 2 shows the ratio of the spectrum of the SM star to that of the comparison star PG 0839+399. Before their ratio was taken, both spectra were linearly interpolated across narrow interstellar resonance lines, the spectrum of PG 0839+399 was redshifted by to mesh its stellar lines with those of the SM star, and both spectra were smoothed to a resolution of FWHM, the same as in Figure 1. The continuum was then removed by fitting unabsorbed parts of the ratio spectrum to a quintic polynomial in log flux versus inverse wavelength. The continuum fitting is intended to remove differences both in the intrinsic continua of the spectra and in the extinction. We tried correcting the continua for the extinction alone, measured by Blair et al. (1996, Table 2) to be for the SM star and for PG 0839+399, using the extinction curve of Cardelli, Clayton & Mathis (1989), but this correction leaves noticeable differences in the continua, particularly at shorter wavelengths, so we preferred the empirical polynomial fit.
The ratio spectrum of Figure 2 shows broad absorption features, which, following Wu et al. (1983) and subsequent authors (Fesen & Hamilton, 1988; Wu et al., 1993, 1997; Hamilton et al., 1997), we attribute to redshifted Si II, III, and IV in the ejecta of SN1006.
As in the individual spectra shown in Figure 1, the small scale structure in the ratio spectrum of Figure 2 is not noise, but real, mostly stellar features. It is thus apparent that the spectral type and elemental abundances of the comparison star PG 0839+399 are not identical to those of the SM star.
The smooth line passing through the absorption spectrum in Figure 2 is a model in which the weaker Si II 1304 Å and Si II 1527 Å features are assumed to have the same profile as the strong Si II 1260 Å feature, with strengths in proportion to their wavelengths times oscillator strengths, as expected if the lines are optically thin. The Si III 1206 Å and Si IV 1394, 1403 Å features are assumed to have Gaussian profiles with the same width as that measured in §3.1 for the shocked component of the Si II 1260 Å feature.
3 Results
3.1 Si II 1260 Å feature
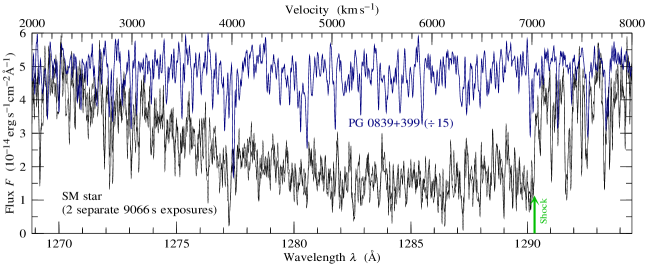
Figure 3 shows the STIS spectrum of the SM star at high resolution in the vicinity of the redshifted Si II 1260 Å absorption feature. The Figure shows individually the two long exposure spectra, each, of the SM star, and the spectrum of the comparison star PG 0839+399, the last shifted by to mesh its stellar lines with those of the SM star, and divided by to bring its continuum to approximately the same level as that of the SM star. Each spectrum has been smoothed with a near Gaussian of FWHM, just slightly greater than the intrinsic resolution of the spectrum.
The arrow at marks the velocity of the sharp red edge of the feature, the putative position of the reverse shock moving into the freely expanding Si II ejecta.
The spectrum would seem to confirm the key prediction of the shock hypothesis, that the edge of the feature should be extremely sharp. At the steepest point, the flux shown in Figure 3 rises over an interval of 7 pixels from an absorption fraction of at to an absorption fraction of at . We take the position of the reverse shock to be , at the centre of the steep interval, and this is the value given in Table 2.
We have compared the shape of the steep interval to that expected for a step function smoothed over the line spread function of STIS with the E140M grating and slit, and conclude that the edge is consistent with being unresolved.
It is natural to assign the uncertainty of the location of the reverse shock to be , since that is the extent of the steep interval. However, if at some time in the future a second epoch observation is taken at similar resolution and signal-to-noise, then by comparing the line profiles near the shock, it should be possible to measure the change in the position of the shock with significantly higher resolution. Given the quality of the present spectrum, we judge that it should be possible to measure the change in the position of the shock to better than a pixel, about . We therefore choose to quote in Table 2 two separate errors on the position of the shock, a relative eror of , which is an estimate of the uncertainty in the relative position of the shock between two observations of similar quality at two different times, and an absolute error of , which is an estimate of the uncertainty in the absolute position of the shock front in the freely expanding ejecta.
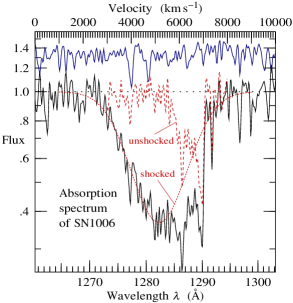
Figure 3 also supports a second proposition of the shock model, that the Si II 1260 Å absorption feature is optically thin. If the feature were produced by dense, optically thick knots of ejecta, a possibility discussed by Fesen et al. (1988) and Fesen & Hamilton (1988), then the absorption feature would be choppier, hitting zero at various wavelengths. The deepest part of the absorption trough, over 1280–1290 Å, remains clear above zero.
Figure 4 shows the absorption spectrum of SN1006, the ratio of the spectrum of the SM star to that of the comparison star PG 0839+399, in the vicinity of the Si II 1260 Å absorption feature. The Figure is essentially a zoomed-in version of Figure 2, but at four times the spectral resolution. As with Figure 2, both spectra were first linearly interpolated across narrow interstellar resonance lines, and the spectrum of PG 0839+399 was redshifted by . Both spectra were smoothed with a near Gaussian of FWHM before their ratio was taken, and the ratio was then corrected by the same quintic polynomial as in Figure 2.
The maximum velocity of unshocked Si II represents the position of the reverse shock, and as discussed in Paper 1, Si II passing through the reverse shock will be decelerated suddenly from the free expansion velocity of to a lower bulk velocity. The collisional ionization time of the shocked Si II is comparable to the age of the remnant, so it is expected that Si II should persist after being shocked. The shocked Si II should contribute a broad Gaussian profile of absorption. Fitting the blue edge of the Si II 1260 Å feature to a Gaussian, we find the best fit shown in Figure 4. The best fit parameters of the Gaussian fit are a mean of , and a dispersion of , as listed in Table 2.
Table 2 also gives, for reference, values previously measured from the FOS data in Paper 1. The FOS velocities listed in Table 2 are as given by Paper 1, and have not been corrected for the shift of the FOS spectrum measured in §3.2 below. It is to be noted that the uncertainties on the STIS parameters are, except for the much more precise measurement of the expansion velocity into the reverse shock, not much different from the quoted uncertainties on the FOS parameters. As in Paper 1, the stated uncertainties are formal 1 standard deviation statistical errors, and do not include the systematic uncertainty associated with the stellar spectrum or with placement of the continuum. In the present paper the systematics are under better control, thanks to the template stellar spectrum from the comparison star PG 0839+399, so that, notwithstanding the comparable statistical errors, the STIS values in Table 2 are more reliable, and are to be preferred.
The consistency of the measured velocities can be checked, as in Paper 1, against the jump conditions for a strong shock. The shock jump conditions predict that the three-dimensional velocity dispersion of the ions should be related to the deceleration of the shocked gas by energy conservation
| (1) |
provided that all the shock energy goes into ions. From the measured 1-dimensional dispersion given in Table 2, the observed 3-dimensional dispersion is
| (2) |
The observed deceleration is the difference between the measured free expansion velocity of the unshocked gas at the reverse shock front, and the measured mean velocity of the Gaussian velocity distribution of shocked gas, which is
| (3) |
As previously found in Paper 1, these values are in good agreement (the observed dispersion exceeds that predicted from the deceleration by standard deviations), encouraging the view that the shock interpretation is basically correct.
The reverse shock velocity corresponding to the observed dispersion is
| (4) |
which is listed in Table 2.
As remarked above, the relation (1) is valid only if all the shock energy goes into ions, with negligible energy going into heating electrons. If some of the shock energy went into electrons, then the predicted ion velocity dispersion would be decreased, which would worsen the agreement with the shock jump conditions. Thus, if the shock interpretation of the Si II 1260 Å feature is accepted, then the measured velocities constitute direct evidence that little electron heating occurs in shocks of this kind. This is consistent with other observational evidence that little electron heating occurs in the fast shocks in SN1006 (Laming et al., 1996; Ghavamian et al., 2002; Vink et al., 2003; Vink, 2005).
3.2 Evolution of the reverse shock
As the reverse shock propagates into the Si II ejecta, the free expansion velocity at the position of the reverse shock should decrease with time as
| (5) |
Given the measured shock velocity , equation (4), and the known age of the remnant at the 1999 epoch of observation, equation (5) predicts that the expansion velocity of the reverse shock should be decreasing at a rate of
| (6) |
We have attempted to measure the expected change in the position of the reverse shock between the FOS and STIS data. The time that elapsed between the FOS observations, taken during 17–20 September 1993 (Wu et al., 1997), and the STIS observations, taken during 24–25 July 1999, is 2135 days, or 5.85 years, so if the shock model is correct then it is expected that the position of the reverse shock should have changed by , that is by
| (7) |
between the FOS and STIS observations.
To measure the change in the position of the reverse shock as accurately as possible, we carried out a differential comparison of the FOS and STIS spectra. The FOS spectrum was taken by Wu et al. (1997) using the diameter circular aperture, the G130H grating, and the blue detector. The uncertainties in the comparison are dominated by uncertainties in the FOS spectrum. We took the error in each FOS spectral bin from the photon-counting noise tabulated in the HST spectral data file, multiplied by an empirical factor of 1.2 suggested by the scatter in the flux difference between adjacent spectral bins. Values and uncertainties of parameters given below are deduced from the minimum and deviation in the of the difference between the FOS and STIS spectra.
To compare the FOS and STIS spectra, we first smoothed the STIS spectrum with a near-Gaussian to the resolution of the FOS spectrum. Fitting the smoothed STIS spectrum to the FOS spectrum yields a best fit resolution of FWHM, somewhat larger than the nominal FWHM of the line spread function of the FOS G130H spectrum in the configuration used. Comparison of stellar and interstellar lines in unabsorbed (by SN1006 ejecta) ranges of the spectrum over 1240–1400 Å indicate that the FOS spectrum is shifted by relative to the STIS spectrum. To bring the FOS lines into registration with those of STIS, we therefore shifted the FOS spectrum by . The FOS and STIS continua differ somewhat, the FOS continuum varying from high near 1170 Å to about low near 1400 Å. To cancel this variation, we fitted the log of the FOS to STIS flux ratio to a 19th order polynomial as a function of wavelength, and divided the FOS spectrum by the fitted ratio. Despite the high order, the correcting polynomial varies moderately and smoothly with wavelength.
Figure 5 compares the resulting adjusted FOS spectrum to the smoothed STIS spectrum in the vicinity of the Si II 1260 Å feature.
Having made these preliminary adjustments, we measured the change in the velocity of the shock front between the FOS and STIS spectra from the shift in wavelength of the sharp edge at 1289.5–1291 Å. The measured shift of the edge of the STIS spectrum relative to the FOS spectrum is
| (8) |
in which approximately half the error comes from uncertainty in the wavelength of the edge, and the other half from an estimated uncertainty in the relative normalization of the FOS and STIS continua. We note that each FOS spectral bin is wide, so the error in the shift is about half an FOS spectral bin.
3.3 Si III and Si IV features
As in Paper 1, we have fitted the Si III 1206 Å and Si IV 1394, 1403 Å features in the absorption spectrum of SN1006 to a combination of unshocked and shocked components, the two components being assumed to have the same profiles as the unshocked and shocked components of the Si II 1260 Å feature shown in Figure 4. The results are essentially the same as found in Paper 1: the Si III and Si IV profiles are consistent with being entirely shocked, with no evidence of any unshocked component.
Figure 2 shows, in dotted lines, the fitted Gaussian profiles of shocked Si III and Si IV, the centre and width of the Gaussian in each case being fixed equal to those measured from the Si II 1260 Å feature, as given in Table 2. The best fit ratios of number densities of shocked Si III and Si IV relative to shocked Si II are listed in Table 2. As elsewhere in this paper and in Paper 1, the quoted uncertainties are formal errors, and do not include systematic uncertainties associated with the stellar spectrum or with placement of the continuum. The systematic uncertainty could well exceed the statistical uncertainty.
If the width of the Gaussian is permitted to be a free parameter, the centre being held fixed, then the Si III profile prefers a slightly narrower profile, , while the Si IV profile prefers a slightly broader profile, , but in both cases the width is consistent with the dispersion of the Si II profile.
If not only the width but also the centre of the Gaussian are permitted to be free parameters (which yields a reliable result only for Si IV, since the blue edge of Si III is confused by Ly), then the Si IV profile prefers a slightly broader width, , still consistent with that of Si II, but a lower central velocity of , which is 2– below the centre measured from Si II, suggesting weakly that Si IV may perhaps extend to somewhat lower velocities than Si II. Examination of the Si IV line profile, Figure 2, indicates that the fit is pulled to lower velocities mainly by an absorption spike at 1405 Å (not at Si IV 1403 Å!). The spike is not so prominent in the FOS spectrum, which does however show, like the STIS spectrum, a slight excess of Si IV absorption at lower velocities.
In Paper 1, the Si IV preferred a significantly broader width of . The narrower width measured here is to a large extent a consequence of dividing by the template stellar spectrum of PG 0839+399 – compare the raw Si IV profile of the SM star in Figure 1 to the corrected Si IV profile in Figure 2.
Since the collisional ionization time of Si II is comparable to the age of the remnant (Paper 1), it is not surprising that collisional ionization of the shocked Si II should lead to observable amounts of shocked Si III and Si IV.
Irradiation of unshocked ejecta by UV and x-ray emission from the reverse shock could in principle photoionize Si II to Si III and Si IV. Indeed, Paper 1 remarked that the ratios of the observed column densities of Si II, III, and IV are close to the unshocked ratios predicted in photoionization trials similar to those described by Hamilton & Sarazin (1984), in which the deflagrated white dwarf model CDTG7 of Woosley (Woosley 1987, private communication), similar to model CDTG5 of Woosley & Weaver (1987), is evolved into a uniform ambient medium. Thus the fact that the observations point to negligible amounts of unshocked Si III and Si IV places constraints on the explosion model – for example, the model considered by Hamilton & Sarazin (1984) produces more unshocked Si III and Si IV than observed.
In Paper 1 it was argued that, under a ‘simplest’ set of assumptions, there should be an observable column density of blueshifted Si IV, although this prediction is sensitive to the assumptions, and is not robust. The STIS spectrum, Figure 2, shows no evidence of blueshifted Si IV absorption along this sight line, in agreement with previous observations.
3.4 Weaker Si II features
The absorption spectrum of SN1006 in Figure 2 shows, in addition to the broad, redshifted Si II 1260 Å feature, weaker features of Si II 1304 Å and Si II 1527 Å.
Fesen et al. (1988) first pointed out that the Si II 1527 Å feature is anomalously weak compared to the principal Si II 1260 Å feature. The discrepancy was confirmed by the FOS observations (Wu et al., 1997), and is confirmed again in the present observations, Figure 2.
The high quality of the STIS spectra establishes beyond doubt that the discrepancy is real, not just noise. As remarked in §2, the small scale structure in the absorption spectrum shown in Figure 2 is real, not noise, and must be attributed, at least in unabsorbed (by SN1006) regions of the spectra, to differences between the stellar spectra of the SM star and the comparison PG 0839+399 star.
The bottom panel of Figure 2 shows the residual spectrum obtained by dividing the absorption spectrum by a model in which the weaker Si II 1304 Å and Si II 1527 Å features are assumed to have the same profile as the strong Si II 1260 Å feature. It is evident that the most prominent residual (besides Ly) is around the anomalous Si II 1527 Å feature. By contrast, the Si II 1304 Å feature appears to be consistent with Si II 1260 Å, in the sense that the level of fluctuation in the residual is comparable to that in unabsorbed (by SN1006) parts of the spectrum. The principal anomaly of the Si II 1527 Å feature is that it is missing absorption on the red side of the line, by perhaps a factor of 2. The Si II 1304 Å feature does not share this anomaly.
Note that the red side of the Si II 1304 Å feature is affected by interstellar C II 1334.5 Å, while the blue side of the Si II 1527 Å feature is affected by interstellar C IV 1548.2, 1550.8 Å. However, these interstellar lines absorb only a narrow interval of the high resolution STIS spectra, and their presence does not change any conclusions.
Fesen et al. (1988) proposed that the Si II 1260 Å feature might be augmented by a contribution from S II 1250.6, 1253.8, 1259.5 Å. Paper 1 argued against this proposal on the grounds that that the combined oscillator strength of the S II multiplet, , is only 1/30th that of the Si II 1260.4 Å line, whose oscillator strength is (Morton, 1991). This, along with the fact that explosion models predict that S and Si are synthesized together in a cosmic ratio of order , suggested that S II is likely to contribute no more than 2% to the Si II 1260 Å feature.
Could the S:Si ratio in the SN1006 ejecta be substantially higher than the cosmic ratio of ? Recent studies of Type Ia supernovae have favored off-centre delayed detonation models, in which an explosion begins as a subsonic deflagration, which at some point develops into a supersonic detonation (Höflich, 2006). Si and S are synthesized in the detonation phase by partial burning to nuclear statistical equilibrium. The overall S:Si mass ratio is , but the ratio can be higher at lower expansion velocities where the burning is more complete. For example, the S:Si ratio approaches at an expansion velocity of in model CS15DD1 of Iwamoto et al. (1999). Even at such enhanced abundance, S would contribute less than 10% to the Si II 1260 Å feature.
Since the chief anomaly of the Si II 1527 Å feature is that it is missing absorption to the red side, an explanation in terms of S II absorption would be more plausible if S II were mainly unshocked, with little shocked S II. In that case S II 1250.6, 1253.8, 1259.5 Å would contribute absorption to the unshocked component on the red side of the strong Si II 1260 Å feature, but not to the shocked Gaussian component on its blue side. However, the collisional ionization rate of S II is similar to that of Si II at any electron temperature exceeding (Lennon et al., 1988; Voronov, 1997), so if S II does contribute to the Si II 1260 Å feature, then S II should contribute to both unshocked and shocked components in about the same amounts as Si II. Thus S II, even if present, does not account naturally for the different line profiles of the Si II 1527 Å and Si II 1260 Å features. A loophole in the above argument is that if the S:Si ratio is strongly varying with radius, from in the unshocked gas to or so in the shocked gas, then it might be possible to arrange that S II contributes appreciably only to the unshocked component on the red side of the strong Si II 1260 Å feature. But this possibility seems contrived.
It should be remarked that even if S II does contribute appreciably to the Si II 1260 Å feature, that would not alter the principal conclusion of this paper, that the sharp red edge of the strong Si II 1260 Å feature indicates a shock front.
Therefore, in the absence of any good alternative, we are forced to the conclusion that any discrepancy between the Si II lines must arise from differences between the stellar spectra of the SM star and the comparison PG 0839+399 star. Certainly this is a plausible conclusion given the clear differences between the spectra at wavelengths unaffected by absorption from SN1006 ejecta. It would be useful in the future to use theoretical model atmospheres of OB subdwarfs to resolve the discrepancies better than we have been able to do in this paper.
4 Summary
In this paper we have reported a high resolution ( FWHM) STIS spectrum of the broad Si II, III, and IV features produced by ejecta in SN1006, seen in absorption against the SM star (Schweizer & Middleditch, 1980) which lies behind and near the projected centre of the remnant of SN1006.
The Si II 1260 Å feature, the strongest absorption feature, is observed to have an unresolved sharp red edge at , supporting the proposal of Paper 1 that this edge represents the location of the reverse shock moving into Si II ejecta.
The shock model predicts that the position of the reverse shock should be changing at the observable rate of per year. We have attempted to measure the change between the position of the reverse shock over the 6 year interval between the FOS and STIS data. The measured change of is consistent with the predicted change of , but is also consistent with no change. A future precise detection of the predicted change would confirm beyond reasonable doubt that the Si II 1260 Å feature indeed reveals Si II in the process of being shocked.
The pre-shock velocity (), the post-shock bulk velocity (), and the post-shock velocity dispersion () of the Si II are all measured from the Si II 1260 Å profile. Agreement between the measured velocities and the shock jump conditions requires that almost all the shock energy goes into ions, with little or no electron heating. This is consistent with other observational evidence that little electron heating occurs in the fast shocks in SN1006 (Laming et al., 1996; Ghavamian et al., 2002; Vink et al., 2003; Vink, 2005).
The STIS spectrum is consistent with the analysis of Paper 1, which was based on the lower resolution FOS spectrum of the SM star, and the conclusions of that paper remain unchanged.
Acknowledgements
We thank Frank Winkler for encouraging us to write up this paper and for comments on the manuscript, Tom Ayres for advice on the reduction of the STIS spectra, and Pierre Chayer for advice about the spectra of OB subdwarf stars. Support for this work was provided by NASA through grant number GO-7349 from the Space Telescope Science Institute, which is operated by AURA, Inc., under NASA contract NAS 5-26555.
References
- Aharonian et al. (2005) Aharonian F. et al. (97 authors; H.E.S.S. Collaboration), 2005, A&A, 437, 135
- Allen et al. (2001) Allen G. E., Petre R., Gotthelf E. V., 2001, ApJ, 558, 739
- Badenes et al. (2003) Badenes C., Bravo E., Borkowski K. J., Domínguez, I., 2003, ApJ, 593, 358
- Bamba et al. (2003) Bamba A., Yamazaki R., Ueno M., Koyama K., 2003, ApJ, 589, 827
- Blair et al. (1996) Blair W. P., Long K. S., Raymond J. C., 1996, ApJ, 468, 871
- Burleigh et al. (2000) Burleigh M. R., Heber U., O’Donoghue D., Barstow M. A., 2000, A&A, 356, 585
- Cardelli et al. (1989) Cardelli J. A., Clayton G. C., Mathis J. S., 1989, ApJ, 345, 245
- Dyer et al. (2004) Dyer K. K., Reynolds S. P., Borkowski K. J., 2004, ApJ, 600, 752
- Dyer et al. (2001) Dyer K. K., Reynolds S. P., Borkowski K. J., Allen G. E., Petre R., 2001, ApJ, 551, 439
- Fesen & Hamilton (1988) Fesen R. A., Hamilton A. J. S., 1988, in A Decade of UV Astronomy with IUE, ESA SP-281, Vol. 1, p. 121
- Fesen et al. (1988) Fesen R. A., Wu C.-C., Leventhal M., Hamilton A. J. S., 1988, ApJ, 327, 164
- Ghavamian et al. (2002) Ghavamian P., Winkler P. F., Raymond J. C., Long K. S., ApJ, 572, 888
- Green et al. (1986) Green R. F., Schmidt M., Liebert J., 1986, ApJS, 61, 305
- Hamilton et al. (1997) Hamilton A. J. S., Fesen R. A., Wu C.-C., Crenshaw D. M., Sarazin C. L., 1997, ApJ, 418, 838 (Paper 1)
- Hamilton & Sarazin (1984) Hamilton A. J. S., Sarazin C. L., 1984, ApJ, 287, 282
- Hillebrandt & Niemeyer (2000) Hillebrandt W., Niemeyer J. C., 2000, ARA&A, 38, 191
- Höflich (2006) Höflich P., 2006, Nuc. Phys. A, in press
- Höflich et al. (2003) Höflich P., Gerardy C., Linder E., Marion H., 2003, in “Stellar Candles”, ed. Alloin D. & Gieren W., Lecture Notes in Physics 635 (Springer) p. 203 (astro-ph/0301334)
- Iwamoto et al. (1999) Iwamoto K., Brachwitz F., Nomoto K., Kishimoto N., Umeda H., Hix W. R., Thielemann F., 1999, ApJS, 125, 439
- Kirshner et al. (1987) Kirshner R. P., Winkler P. F., Chevalier R. A., 1987, ApJ, 315, L135
- Korreck et al. (2004) Korreck K. E., Raymond J. C., Zurbuchen T. H., Ghavamian P., 2004, ApJ, 615, 280
- Koyama et al. (1995) Koyama K., Petre R., Gotthelf E. V., Hwang U., Matsuura M., Ozaki M., Holt S. S., 1995, Nature, 378, 255
- Laming et al. (1996) Laming J. M., Raymond J. C., B. M. McLaughlin, Blair W. P., 1996 ApJ, 472, 267
- Lennon et al. (1988) Lennon M. A., Bell K. L., Gilbody H. B., Hughes J. G., Kingston A. E., Murray M. J., & Smith F. J., 1988, J. Phys. Chem. Ref. Data, 17, 1285
- Long et al. (2003) Long K. S., Reynolds S. P., Raymond J. C., Winkler P. F., Dyer K. K., Petre R., 2003, ApJ, 586, 1162
- Moffet et al. (1993) Moffett D. A., Goss W. M., Reynolds S. P., 1993, AJ, 106, 1566
- Morton (1991) Morton D. C., 1991, ApJS, 77, 119
- Raymond et al. (1995) Raymond J. C., Blair W. P., Long K. S., 1995, ApJ, 454, L31
- Reynolds & Gilmore (1986) Reynolds S. P., Gilmore D. M., 1986, AJ, 92, 1138
- Reynolds & Gilmore (1993) Reynolds S. P., Gilmore D. M., 1993, AJ, 106, 272
- Roger et al. (1988) Roger R. S., Milne D. K., Kesteven M. J., Wellington K. J., Haynes R. F., 1988, ApJ, 332, 940
- Ruiz-Lapuente et al. (2003) Ruiz-Lapuente P., Comeron F., Smartt S., Kurucz R., Mendez J., Canal R., Filippenko A., Chornock R., 2003, in “From Twilight to Highlight: the Physics of Supernovae”, ed. Hillebrandt W. & Leibundgut B. (Springer), p. 140 (astro-ph/0304109)
- Schweizer & Middleditch (1980) Schweizer F., Middleditch J., 1980, ApJ, 241, 1039
- Sollerman et al. (2003) Sollerman J., Ghavamian P., Lundqvist P., Smith R. C., 2003 A&A, 407, 249
- Smith et al. (1991) Smith R. C., Kirshner R. P., Blair W. P., Winkler P. F., 1991, ApJ, 375, 652; erratum in ApJ, 384, 665
- Stephenson & Green (2002) Stephenson F. R., Green D. A., 2002, Historical Supernovae and the Remnants (Clarendon Press, Oxford)
- Tanimori et al. (1998) Tanimori T., Hayami Y., Kamei S., et al. (39 authors), ApJ, 497, L25
- Tanimori et al. (2001) Tanimori T., Naito T., Yoshida T., et al. (15 authors; CANGAROO collaboration), 2001, Proc. 27th International Cosmic Ray Conference, Hamburg, Germany, p. 2465
- Vink (2005) Vink J., 2005, in X-ray Diagnostics for Astrophysical Plasmas: Theory, Experiment, and Observation, ed. Smith R. K., AIP Conference Proceedings, 774, p. 241 (astro-ph/0412447)
- Vink et al. (2000) Vink J., Kaastra J. S., Bleeker J. A. M., Preite-Martinez A., 2000 A&A, 354, 931
- Vink et al. (2003) Vink J., Laming J. M., Gu M. F., Rasmussen A., Kaastra J. S., 2003, ApJ, 587, L31
- Voronov (1997) Voronov G. S., 1997, Atomic Data and Nuclear Data Tables, 65, 1
- Willingale et al. (1996) Willingale R., West R. G., Pye J. P., Stewart G. C., 1996, MNRAS, 278, 749
- Winkler et al. (2005) Winkler P. F., Long K. S., Hamilton A. J. S., Fesen R. A., 2005, ApJ, 624, 189
- Winkler et al. (2003) Winkler P. F., Gupta G., Long K. S., 2003, ApJ, 585, 324
- Winkler & Long (1997) Winkler P. F., Long K. S., 1997, ApJ, 491, 829
- Woosley & Weaver (1987) Woosley S. E., Weaver T. A., 1987, in IAU Coll. 89, Radiation Hydrodynamics in Stars and Compact Objects, ed. Mihalas D. & Winkler K.-H. A. (Berlin: Springer-Verlag), p. 91
- Wu et al. (1993) Wu C.-C., Crenshaw D. M., Fesen R. A., Hamilton A. J. S., Sarazin C. L., 1993, ApJ, 416, 247
- Wu et al. (1997) Wu C.-C., Crenshaw D. M., Hamilton A. J. S., Fesen R. A., Leventhal M., Sarazin C. L., 1997, ApJ, 477, L53
- Wu et al. (1983) Wu C.-C., Leventhal M., Sarazin C. L., Gull T. R., 1983, ApJ, 269, L5
- Kalemci et al. (2006) Kalemci E., Reynolds S. P., Boggs S. E., Lund N., Chenevez J., Renaud M., Rho J., 2006, ApJ, in press (astro-ph/0602335)