A Spitzer mid-infrared spectral survey of mass-losing carbon stars in the Large Magellanic Cloud
Abstract
We present a Spitzer Space Telescope spectroscopic survey of mass-losing carbon stars (and one oxygen-rich star) in the Large Magellanic Cloud. The stars represent the superwind phase on the Asymptotic Giant Branch, which forms a major source of dust for the interstellar medium in galaxies. The spectra cover the wavelength range 5–38 m. They show varying combinations of dust continuum, dust emission features (SiC, MgS) and molecular absorption bands (C2H2, HCN). A set of four narrow bands, dubbed the Manchester system, is used to define the infrared continuum for dusty carbon stars. The relations between the continuum colours and the strength of the dust and molecular features are studied, and are compared to Galactic stars of similar colours. The circumstellar 7-m C2H2 band is found to be stronger at lower metallicity, from a comparison of stars in the Galaxy, the LMC and the SMC. This is explained by dredge-up of carbon, causing higher C/O ratios at low metallicity (less O). A possible 10-m absorption feature seen in our spectra may be due to C3. This band has also been identified with interstellar silicate or silicon-nitrite dust. We investigate the strength and central wavelength of the SiC and MgS dust bands as function of colour and metallicity. The line-to-continuum ratio of these bands shows some indication of being lower at low metallicity. The MgS band is only seen at dust temperatures below 600 K. We discuss the selection of carbon versus oxygen-rich AGB stars using the JK vs. KA colours, and show that these colours are relatively insensitive to chemical type. Metal-poor carbon stars form amorphous carbon dust from self-produced carbon. This type of dust forms more readily in the presence of a higher C/O ratio. Low metallicity carbon dust may contain a smaller fraction of SiC and MgS constituents, which do depend on metallicity. The formation efficiency of oxygen-rich dust depends more strongly on metallicity. We suggest that in lower-metallicity environments, the dust input into the Interstellar Medium by AGB stars is efficient but may be strongly biassed towards carbonaceous dust, as compared to the Galaxy.
keywords:
Galaxies: Magellanic Clouds; stars: stars: AGB and post-AGB – stars: carbon – stars: mass loss – stars: infrared dust1 Introduction
Low and intermediate-mass stars (–, hereinafter LIMS) make up 90% of all the stars which have died in the Universe up to the present time. During their late evolution, after entering the high luminosity asymptotic giant branch (AGB) phase, the stars eject their hydrogen-rich outer layers during a phase of catastrophic mass loss: the so-called superwind phase. After this final burst of activity, the star remains as a hot, compact white dwarf of mass 0.6–1.4 M⊙. The expanding ejecta surrounding the star become ionized and form a planetary nebula, before dispersing into the interstellar medium.
During the superwind, the star tends to be self-obscured by dust which forms in the ejecta. Dredge-up of primary carbon (produced by triple- burning) may turn the star into a carbon star. At the low effective temperature of AGB stars, the ejecta are largely molecular. The first and most stable molecule to form is CO: this locks up the least abundant of the C and O atoms. Other molecules and dust form from the remaining atoms. The chemistry changes dramatically as the C/O ratio passes unity, and this affects both the gas-phase species (Millar et al., 2000; Willacy & Millar, 1997) and the dust composition (Treffers & Cohen, 1974). In carbon stars, the C/O ratio (by number) is more than unity, and carbon-rich molecules (e.g. C2H2, HCN) and carbonaceous dust (Hony, 2002) result, whilst in oxygen stars (C/O), metal oxides and silicate dust (Cami, 2002) form.
The mass-loss process is important for three reasons. First, it determines the mass distribution of stellar remnants, including e.g. the lower mass limit of type-II supernovae progenitors (Zijlstra, 2004). Second, the physics and interplay of stellar pulsation, shock waves, dust formation and radiation pressure which drives the mass loss are still little understood. Third, stellar mass loss drives galactic evolution through replenishment and enrichment of the Interstellar Medium (ISM). On this last point, mass-loss from LIMS contributes roughly half the total gas recycled by all stars (Maeder, 1992), creates an amount of carbon roughly equal to that produced by supernovae and Wolf-Rayet stars (Dray et al., 2003; Gavilán et al., 2005) and is the main source of carbonaceous interstellar dust (Edmunds, 2001; Dwek, 1998). LIMS are the only confirmed source of the primary nitrogen required to explain observed abundances in objects in the early universe, are the main source of 13C (Hajduk et al., 2005) and heavy s-process elements (Goriely & Mowlavi, 2000; Wanajo et al., 2006), and are the major stellar source of lithium (Romano et al., 2001).

The AGB and post-AGB evolution is dominated by the superwind mass loss. Theoretical models (e.g. Sandin & Höfner, 2003) cannot yet predict mass-loss rates from stellar parameters: instead observational knowledge is required of the mass-loss rates as a function of mass, luminosity and metallicity. However, the observational relations are themselves not well calibrated: local Galactic stars have poorly known distances and unknown progenitor masses, while extra-galactic stars are in general too faint to detect the mass-loss tracers. Important work has been done on Bulge stars (Ortiz et al., 2002). The main tracer for the superwind is the dust, but dust emits in the thermal infrared. Surveys by the Infrared Astronomical Satellite (IRAS) uncovered a number of luminous self-obscured AGB stars in the Magellanic Clouds (Reid, 1991; Zijlstra et al., 1996). A larger number of these stars was discovered more recently with the Midcourse Space Experiment (MSX) satellite (Egan et al., 2001). The Infrared Space Observatory (ISO) made it possible to measure mass-loss rates, but only for the most massive stars and the highest mass-loss rates (e.g. van Loon et al., 1999a).
The Spitzer Space Telescope (Werner et al., 2004) for the first time provides the sensitivity necessary to obtain mass-loss rates for the whole range of AGB masses and luminosities in the Magellanic Clouds. These stars have well-known distances, meaning that absolute luminosities can be easily obtained. The general abundance of field stars may be estimated from the well-studied age-metallicity relations, and abundances have been derived explicitly for many star clusters. We have thus undertaken a survey of stars all along the AGB branch in the Large Magellanic Cloud and the Small Magellanic Cloud (hereinafter LMC and SMC respectively) with Spitzer. In this paper we present the LMC stars observed in our survey. Data for the SMC stars and the analysis of mass-loss rates will appear in subsequent papers.
2 Target selection

The (, ) diagram in Fig. 1(a) shows most of the AGB stars which are known mid-IR point sources in the LMC. Also shown is a representative sample of the much more numerous field stars without thick dust shells. The most numerous stars in any stellar population are low-mass stars. In Fig. 1(a), these stars evolve up the AGB in at and , before they develop high mass-loss rates and thick dust shells and evolve to and . Fig. 1(a) also includes massive AGB stars (, ), deriving from intermediate-mass progenitor stars.
Stars observed in the current survey are shown in Fig. 1(b). We selected targets in both the SMC and the LMC from the Midcourse Space Experiment (MSX) catalog (Egan et al., 2001), the IRAS point source catalog, the ISO catalog of variable AGB stars in the SMC (Cioni et al., 2003), long-period variables in the Magellanic Clouds (e.g. Wood et al., 1983; Feast et al., 1989), and the intermediate-age clusters NGC419 and NGC1978, both of which have a known mid-infrared source. Targets were selected to span the long sequence of increasing mass loss in LIMS which stretches from to (7,) in Fig. 1(a). (The bright O-rich object near in Fig. 1(b) was not a target but is an object which was accidently observed when Spitzer selected it in the peak-up field). It turns out that only two of the LMC sources were oxygen rich, one of which was found to be a massive young stellar object (van Loon et al., 2005b). Here we present the carbon-rich sources in the LMC. The SMC sample will be presented elsewhere.
Table 1 lists the 29 stars included here. The objects have been included in various catalogues over time, accumulating different names. We adopt the oldest available name for each object, but Table 1 gives the cross references to names used by Reid et al. (1990), Egan et al. (2001) and in the MSX catalogue. The adopted positions are from 2MASS counterparts and differ slightly from the MSX positions.
| Adopted name | MSX source | other name | RA | Dec | J | H | Ks | A | |
| (J2000) | mag | mag | mag | mJy | |||||
| carbon rich | |||||||||
| MSX LMC 219 | 051119.5684227 | 05 11 19.52 | 68 42 27.9 | 15.61 | 14.67 | 13.14 | 204 | ||
| IRAS 051326941 | 051250.8693749 | MSX LMC 223 | 05 12 51.07 | 69 37 50.3 | 17.81 | 15.68 | 13.36 | 259 | |
| MSX LMC 349 | 051726.9685458 | 05 17 26.94 | 68 54 58.2 | 17.44 | 16.88 | 14.82 | 193 | ||
| MSX LMC 341 | 052100.5692054 | 05 21 00.37 | 69 20 55.3 | 17.49 | 15.9: | 13.151 | 210 | ||
| MSX LMC 663 | 052244.5693826 | 05 22 44.00 | 69 38 28.1 | 12.60 | 11.33 | 10.20 | 75 | ||
| MSX LMC 494 | 052309.6691744 | 05 23 09.11 | 69 17 49.1 | 13.08 | 11.71 | 10.51 | 94 | ||
| MSX LMC 441 | 052438.7702357 | 05 24 38.62 | 70 23 57.1 | 17.16 | 16.44 | 14.48 | 200 | ||
| MSX LMC 443 | 052505.9701011 | 05 25 05.69 | 70 10 10.6 | 14.54 | 13.72 | 11.54 | 150 | ||
| MSX LMC 601 | 052650.9693136 | 05 26 50.83 | 69 31 36.9 | 13.88 | 11.99 | 10.52 | 172 | ||
| NGC 1978 IR4 | WBT 815 | 05 28 44.50 | 66 14 04.0 | 11.49: | 10.34: | 9.68 | 70: | ||
| NGC 1978 MIR1 | 05 28 47.20 | 66 14 13.6 | 16.67 | 12.45 | 124 | ||||
| NGC 1978 IR1 | WBT 1268 | 05 28 40.17 | 66 13 54.2 | 13.78 | 12.78 | 11.73 | 77 | ||
| IRAS 052786942 | 052724.3693944 | MSX LMC 635 | 05 27 24.12 | 69 39 45.0 | 17.53 | 15.59 | 12.35 | 683 | |
| MSX LMC 754 | 052811.4703359 | 05 28 11.48 | 70 33 58.7 | 15.98: | 13.70 | 11.89 | 93: | ||
| MSX LMC 679 | 052848.5694801 | 05 28 48.62 | 69 48 01.3 | 15.84 | 14.57 | 12.48 | 121 | ||
| MSX LMC 743 | 053454.1702925 | 05 34 53.74 | 70 29 24.8 | 14.13 | 13.22 | 13.27 | 165 | ||
| MSX LMC 749 | 053527.1695229 | 05 35 26.86 | 69 52 27.9 | 15.06 | 12.93 | 11.05 | 142 | ||
| MSX LMC 967 | 053637.2694725 | 05 36 36.71 | 69 47 22.6 | 13.48 | 12.00 | 10.67 | 87: | ||
| IRAS 045576753 | MSX LMC 1238 | 04 55 38.98 | 67 49 10.7 | 16.18 | 14.49 | 12.397 | 157 | ||
| IRAS 050096616 | MSX LMC 1278 | 05 01 04.43 | 66 12 40.4 | 15.64 | 14.57 | 12.40 | 240 | ||
| IRAS 052916700 | GRRV 38 | 05 29 07.60 | 66 58 15.0 | 12.45 | 10.91 | 9.91 | 81: | ||
| IRAS 052957121 | MSX LMC 692 | 05 28 46.62 | 71 19 12.5 | 16.80: | 14.32 | 12.18 | 204 | ||
| TRM 88 | MSX LMC 310 | 05 20 19.38 | 66 35 47.8 | 14.76 | 12.81 | 11.10 | 169 | ||
| IRAS 051126755 | MSX LMC 44, TRM4 | 05 11 10.47 | 67 52 10.5 | 16.41: | 14.07 | 11.69 | 451 | ||
| IRAS 051906748 | MSX LMC 307, TRM20 | 05 18 56.26 | 67 45 04.4 | 18.21 | 15.91 | 13.10 | 209 | ||
| IRAS 051136739 | MSX LMC 47, TRM24 | 05 11 13.89 | 67 36 16.1 | 17.72 | 14.77 | 12.49 | 233 | ||
| TRM 72 | MSX LMC 29 | 05 11 38.65 | 66 51 09.8 | 14.34 | 12.36 | 10.74 | 122 | ||
| IRAS 053606648 | MSX LMC 872, TRM77 | 05 36 01.24 | 66 46 39.7 | 18.04 | 16.07: | 13.28 | 192 | ||
| oxygen rich | |||||||||
| IRAS 050036712 | MSX LMC 1280 | 05 00 19.00 | 67 07 58.0 | 12.04 | 10.46 | 9.32 | 205 | ||
The JHKs photometry in Table 1 is taken from the 2MASS All-sky catalog. It is based on a single epoch only and does not sample the variability. Where further data is available, we list JHKL photometry averaged over the cycle in Table 2. Also listed are pulsation periods, taken from Whitelock et al. (2003), Wood (1998), Nishida et al. (2000), Ita et al. (2004) and Groenewegen (2004). Where available, periods from Whitelock et al. (2003) are listed in preference because of the larger number of observations used. Photometry is taken from the first three sources, with values from Wood listed in preference, where available. Especially the L-band filters differ substantially between the sources; the photometry is in the original system. For MSX LMC 967, the photometry is an average of two observations only: 2MASS and a single measurement from Ita et al. (2004).
Fig. 2 shows the versus colour-magnitude diagram, using photometry listed above supplemented with data from van Loon et al. (2006). The stars follow the line of increasing mass loss defined in Fig. 1(a). Neither figure includes the stars which are faintest at K, as these show only uper limits for J.
| Adopted name | J | H | K | L | P |
|---|---|---|---|---|---|
| mag | mag | mag | mag | days | |
| MSX LMC 663 | 455: | ||||
| MSX LMC 494 | 458 | ||||
| MSX LMC 601 | 546 | ||||
| NGC 1978 IR1 | 14.26 | 12.01 | 10.51 | – | 491 |
| MSX LMC 749 | 329, 589 | ||||
| MSX LMC 967 | (14.2) | (12.5) | (10.8) | – | 572 |
| IRAS 045576753 | 13.97 | 11.78 | 9.11 | 765 | |
| IRAS 050096616 | 13.06 | 11.29 | 8.94 | 658 | |
| GRRV 38 | 13.04 | 11.33 | 10.17 | 8.86 | 483 |
| IRAS 052957121 | 12.96 | 10.99 | 8.83 | 682 | |
| TRM 88 | 14.22 | 12.10 | 10.30 | 8.26 | 544 |
| IRAS 051126755 | 17.65 | 15.11 | 12.29 | 8.89 | 830 |
| IRAS 051906748 | 16.11 | 12.72 | 8.71 | 939 | |
| IRAS 051136739 | 16.84 | 14.63 | 12.17 | 8.93 | 700 |
| TRM 72 | 15.50 | 13.33 | 11.39 | 8.92 | 631 |
| IRAS 053606648 | 15.50 | 12.87 | 9.24 | 538 | |
| IRAS 050036712 | 12.90 | 11.26 | 9.95 | 8.49 | 883 |
2.1 Comments on individual stars
Three stars in Table 1 are located in the cluster NGC 1978, as indicated by their names. The cluster was studied by Tanabé et al. (1997); it has an age of yr, a turn-off mass of about 1.5 and a metallicity [Fe/H] (van Loon et al., 2005a). One star, MIR-1, is a known obscured LPV, one other is an MSX-detected star, and the third (IR4, van Loon et al., 2005a; Will et al., 1995) is an AGB star with no listed MSX point-source counterpart. This last star is seen on MSX images, from which van Loon et al. (2005a) estimate a flux density of 70 mJy in MSX band A (6.8–10.8 micron).
IRAS 045576753 is also located in a (small) cluster, KMHK 285 (Bica et al., 1999; van Loon et al., 2005a), but this cluster is little studied. The age is estimated as and the metallicity is not known.
MSX LMC 494 is identified with a large amplitude variable observed with the Optical Gravitational Lensing Experiment, OGLE 052309.18691747.0.
LMC MSX 663 is also a long-period OGLE variable but its OGLE amplitude is very small (Groenewegen, 2004). It is an optically bright AGB star previously classified as an S star (Cioni et al., 2001). However, optical spectra show that it is a symbiotic carbon star with strong emission lines (Wood et al, in preparation).
IRAS 052916700 was identified with a nearby variable star, GRRV 38 (Glass & Reid, 1985), but the coordinates of the IRAS source differ by 30 arcsec from this star. The IRAS point source is likely unrelated. There is confusion with an extended mid-infrared source approximately 6 arcminutes east. MSX only has the stellar source, but nothing at the position of the IRAS source. The identification of the star (Zijlstra et al., 1996) most likely occurred serendipitously. GRRV 38 is a carbon star (van Loon et al., 1999b); the infrared colours indicate little or no obscuration. Below we will use the name GRRV 38 for this object.
For TRM 88, Wood (1998) and Whitelock et al. (2003) report main periods of 565 and 544 days respectively. The light curve is affected by long-term secular changes (Whitelock et al., 2003) due to variable circumstellar extinction (Feast et al., 2003).
IRAS 050096616 and TRM 72 also show evidence for long-term variations in the light curves (Whitelock et al., 2003).
TRM 72 should not be confused with the well-studied CH star WORC 106 (Feast & Whitelock, 1992) which is located 30 arcsec away.
3 Observations
We observed our targets with the Infrared Spectrograph (IRS) (Houck et al., 2004) on the Spitzer Space Telescope using the low-resolution modules Short-Low (SL) and Long-Low (LL), which together cover wavelengths from 5 to 38 m. The slits in SL are roughly perpendicular to LL, and each module has two separate apertures, with the longer wavelengths observed in first order and the lower in second order. In order of increasing wavelength, the four spectral segments are known as SL2, SL1, LL2, and LL1. In addition, a “bonus” order covers the overlap between the first and second orders in each module; this order is a small piece of the first-order spectrum obtained when the source is in the second-order aperture. When the source is in one aperture, the other aperture is exposed to a section of nearby sky, providing a background measurement, e.g. in SL2 when the source is in the SL1 aperture. Each source was observed in two nod positions in each aperture. The resolution varies between 64 and 128, depending on the order and wavelength. The slit dimensions are approximately 3.5 57 for SL and 10.5 168 for LL (width length).
Different exposure times were used depending on expected target flux. For SL, 12 to 120-sec exposure times were used per segment. For LL1, exposure times ranged from 60 to 960 sec, and for LL2 from 180 to 960 sec. Observations were taken in standard staring mode.
Flat-fielded images were generated by the Spitzer Science Center (SSC). We replaced bad pixels with values estimated from neighbouring pixels (using the imclean.pro package), and removed the background emission by differencing images aperture-by-aperture in SL (e.g. SL1SL2 and vice versa), and nod-by-nod in LL. Spectra were extracted from the images using the software provided with the Spitzer IRS Custom Extractor (SPICE) available from the SSC. They were calibrated making a full spectral correction using HR 6348 (K0 III) as a standard star in SL and HR 6348, HD 166780 (K4 III), and HD 173511 (K5 III) in LL. Individual images were extracted separately and then co-added. Nods were combined, then spectral segments were combined by making scalar multiplicative corrections for pointing-induced throughput errors (normalizing to the best centered segment). The accuracy of the overall spectral shape is limited to a few percent. The matching across the different sections (e.g. LL2 to LL1) may leave some residuals.
The standard wavelength calibration is accurate to 0.06 micron in SL and 0.15 micron in LL. Flux calibration is accurate to 5 per cent. The response curve is known to a few per cent, but residuals at this level may remain. The largest residual calibration errors are due to pointing uncertainties. The LL array is affected by fringing which in most cases has been corrected. More details on calibration issues can be found in Sloan et al. (2003).
The spectra of the carbon stars are shown in Fig. 3 and 4. They are ordered by dust temperature, from blue spectra to red. The spectra show numerous absorption and emission bands of molecules and dust resonances, superposed on the dust continuum. We will first discuss these bands, separated into dust and molecular features. The following section will discuss the continuum spectral energy distribution.


Some objects show residual interstellar lines, due to incomplete cancellation of the background emission. These lines are found at 33.5 m ([S III]), 34.8 m ([Si II]), and 36.0 m ([Ne III]). An apparent feature at 30.5 m seen in a few spectra is an artifact, due to a hot pixel.
The object MSX LMC 663 exhibits an IRS spectrum which is very different from the others, as shown in Fig. 5. It is affected by interstellar emission in the background measurement, causing the offset measurements to disagree; however, the rise beyond 25 m appears to be intrinsic to the star and not due to background emission. Shortward, the spectrum shows little evidence for dust but the absorption bands are different in shape from those of the other carbon stars.

IRAS 050036712 is the only O-rich AGB star in our sample (one other object was classified as a massive young stellar object, and is published in van Loon et al., 2005b). It has an OH maser (Marshall et al., 2004) but only the blue-shifted component is detected. The Spitzer spectrum is dominated by the silicate emission bands at 10 and 18 m, with perhaps a hint of CO2 absorption at 13.5 m and SiO absorption at 8.6 m. (SiO bands tend to be weak in LMC Miras: Matsuura et al., 2005). The 10-m feature is typical for a lower mass-loss rate: it is comparable to that of the LMC AGB star IRAS 045446849 (Dijkstra et al., 2005) with a mass-loss rate of (van Loon et al., 1999a). .

3.1 Bolometric magnitudes
For a number of our targets, bolometric magnitudes were derived by Wood (1998) and Whitelock et al. (2003). Table 1 lists the bolometric magnitudes derived from the Spitzer spectra and JHKs 2MASS photometry. Where multi-epoch photometry was available (Table 2), those were used instead of the single-epoch 2MASS data. The spectra were smoothed by a factor of 20. The J-band upper limit was used as a real magnitude where necessary: this has no measurable effect on the result (changing it by 1 mag affected the bolometric flux by less than 1 per cent). Zero flux was assumed at frequencies of 0 Hz and Hz. A fourth-order polynomial was fitted (using IDL) to the spectra and data points and the total flux was obtained by integration under the fit. For the blue carbon stars, an uncertainty is introduced by the lack of data points between 2 and 5m. Variability is the main limitation to the accuracy: the K-band magnitude can vary by up to 1–2 mag in extreme cases (Le Bertre, 1992; Wood, 1998; Whitelock et al., 2003). The result was converted to absolute magnitudes assuming a distance modulus of 18.5 (e.g., Alves et al., 2002). The distance modulus varies by approximately 0.1 magnitude over the face of the bar (Lah et al., 2005) but we did not correct for such geometric effects.

The histogram of the bolometric magnitudes is shown in Fig. 7.
4 Emission and absorption bands
4.1 Dust bands
Carbon stars show two major dust bands in this spectral region, at 11.3 and 30 m. Both features are seen in the majority of the current sample, although not in all. Two other spectral features have been suggested as being due to dust, but below we argue against this possibility.
4.1.1 SiC dust emission
The well-known 11.3-m band is due to solid -SiC (e.g. Papoular et al., 1998; Clément et al., 2003). The central wavelength shows some variability in Galactic carbon stars, ranging between 11.15 and 11.7 m. Longer wavelengths are correlated with lower dust (continuum) temperatures (Baron et al., 1987). Clément et al. (2003) find that the wavelength shift to the red can be reproduced in SiC particle conglomerates, and they suggest that conglomerates form at higher density in the wind. In this case the correlation with the dust temperature is an indirect one, caused by a larger optical depth in the dust shell. SiC absorption components are discussed by Speck et al. (2005).
4.1.2 MgS dust emission
The 30-m resonance is commonly seen in carbon-rich environments, in AGB stars, post-AGB stars and planetary nebulae (Forrest et al., 1981; Hony, 2002). It consists of two subpeaks, at 26 and 33 m (Volk et al., 2002). The two peaks always appear together, arguing for an origin in the same mineral. The resonance is attributed to MgS (Goebel & Moseley, 1985) which forms via grain-surface reaction between Mg and H2S (Nuth et al., 1985); the two peaks have been attributed to different grain shapes (Hony et al., 2002). A contribution from CaS to the features cannot be fully excluded, but the absence of any feature in oxygen-rich environments argues against this (Goebel & Moseley, 1985). The peak wavelength of the MgS feature shifts with temperature, which makes it an important temperature diagnostic (Hony & Bouwman, 2004). Hony et al. (2002) argue that solid MgS may survive into the ISM.
4.1.3 Doubtful features
Two objects show indications of a broad, weak hump between 16 and 23 m, with unclear identification. It is most noticeable in the symbiotic C star LMC MSX 663, and may be seen weakly in MSX LMC 754, a carbon star with hot dust. Neither object shows evidence for MgS. The feature is likely an artifact caused by the broad molecular C2H2 absorption band to the blue.
A possible emission feature at 8.6 m has been described in IRAS LRS (Low Resolution Spectrometer) spectra of Galactic carbon stars (Willems, 1988; Sloan et al., 1998). The feature correlates in strength with the SiC band and the 3 m band. However, its reality is disputed: strong absorption at 7.5 m (Aoki et al., 1999) together with 10 m absorption can mimic an emission band. The spectra in our LMC sample show strong absorption at 7.5 m and absorption at 10 m, making it more likely that the 8.6 m peak is simply the continuum between two molecular bands, which we will assume below.
4.1.4 10 micron absorption
This absorption feature, which has been attributed to a dust component, is discussed in Section 4.3.
4.2 Molecular bands
The molecular bands are all at the short wavelength range of the IRS spectra. Gautschy-Loidl et al. (2004) discuss the contribution of different molecules to the 5–20-m wavelength range. Example models for individual bands were calculated by Jørgensen et al. (2000): their models are shown at the of Figs. 3 and 4
4.2.1 13.7 micron
The narrow 13.7-m band is prominent in most of the spectra. This band is due to the Q-branch C2H2 transition (Tsuji, 1984; Aoki et al., 1999; Cernicharo et al., 1999). The narrow band is sitting in the much broader P,R branches, giving rise to an absorption feature extending from 12 to 16-m, which is best seen in the spectrum of IRAS 051906748. The 11.3-m SiC emission feature makes it difficult to judge how strong this broad absorption band is. Models of Galactic carbon stars (Gautschy-Loidl et al., 2004) predict a much stronger broad band than is observed. This can be explained if the mass-losing envelope adds a molecular emission feature. The sharp 13.7-m band is very strong in our spectra, while in Galactic stars it has been dubbed the ’weak’ feature (Gautschy-Loidl et al., 2004). The sharp feature originates from colder gas, while hot (up to photospheric temperatures) gas mainly shows the broad band (Jørgensen et al., 2000).
4.2.2 14.3 micron
The 14.3-m HCN band seen in Galactic carbon stars (Aoki et al., 1999; Cernicharo et al., 1999) is weak in our sample. It is probably present in the spectrum of TRM 72. Otherwise the feature is not clear, and is certainly much weaker than the C2H2 band. This is similar to the situation in Galactic stars, where its weakness is attributed to in-fill by an emission component (Aoki et al., 1999).
4.2.3 7.5 micron
A noticeable absorption band is present at 7.5 m. Galactic carbon stars have contributions in this wavelength region from C2H2, HCN and CS (Goebel et al., 1981; Aoki et al., 1998). The sample of Aoki et al. (1998) consists of blue carbon stars, which differ in effective temperature from our sample.
The shape of the two shallow features found in our spectra resembles C2H2. The diatomic molecule CS shows a band head which we do not see, and the HCN band is located at shorter wavelength, typically centered around 7.0 m (although this central wavelength depends on the excitation temperature). Comparison of our LMC spectra and Galactic spectra indicates a difference in the shape of the 7.5-m band, supporting different origins for Galactic and LMC carbon stars. Matsuura et al. (2002a); Matsuura et al. (2005) show that at low metallicity, C2H2 becomes more abundant compared to HCN. Following this, we identify the observed band for LMC stars with C2H2.
4.2.4 5 micron
At the blue edge of the spectra the spectral energy distributions drop sharply, due to a strong absorption band which extends beyond the blue limit of the wavelength range. There are two molecules which contribute at this wavelength in carbon-rich environments: CO and C3 (Jørgensen et al., 2000). CO is of photospheric origin and is present even in K stars. Its presence in e.g. the unobscured source GRRV 38 does not require a circumstellar shell. C3 also is photospheric in carbon stars. The two bands differ at the red end: C3 ends at 6 m, while CO tapers off slowly up to 8 m.
SiS has three bands at 6.6–6.7 m but the IRS resolution is not high enough to detect these; would be required.
4.3 The 10-micron band
An absorption feature at 10 m may be present in most stars. It is seen only occasionally in Galactic carbon stars (Volk et al., 2000; Sloan et al., 1998). Jørgensen et al. (2000) find it in R Scl but not in three other carbon stars they study. The origin is disputed. Clément et al. (2005) fit this band using solid silicon-nitrite particles, Si3N4. Speck et al. (1997) and Volk et al. (2000) suggest interstellar silicate absorption; to fit the shape, additional SiC absorption is required. Jørgensen et al. (2000) identify the band instead with C3 (see their Fig. 11).
The presence of the band in our LMC stars argues against the interstellar origin proposed by Speck et al. (1997), because the line-of-sight extinction to the LMC is too small to give significant silicate absorption. A contribution from SiC absorption, as required by the silicate hypothesis, is also ruled out: this would only be in absorption in dense, cool shells, while we see the 10-m absorption even in blue, unobscured stars.
This last point, the presence of the feature in all stars, argues against a dust source and bring into question the suggested identification (Clément et al., 2005) with silicon-nitrite. A molecular origin is favoured, in particular a molecule with a photospheric origin.
We finally note the prevalence of the feature in our sample, as compared to Galactic stars. This points towards a molecule which is more abundant in the LMC (at low metallicity) than in the Galaxy. Matsuura et al. (2002a) have shown that this is the case for carbon-bearing molecules, due to a higher C/O ratio. The combined effect, at lower metallicity, of increased efficiency of third dredge-up of carbon (Wood, 1981) and lower oxygen abundance leads to higher C/O ratios at lower metallicity.
The identification suggested by Jørgensen et al. (2000) fits our available constraints. We therefore favour C3 as the probable carrier. However, confirmation will require a laboratory measurement of its 10-m spectrum.
4.4 Band strengths
| Features | [m] | Blue continuum [m] | Red continuum [m] |
|---|---|---|---|
| C2H2 | 7.5 | 6.08-6.77 | 8.22-8.55 |
| SiC | 11.3 | 9.50-10.10 | 12.80-13.40 |
| C2H2 | 13.7 | 12.80-13.40 | 14.10-14.70 |

We define the strength of the molecular absorption bands through their equivalent widths, and quantify the dust emission bands by their integrated line-to-continuum ratio. We use the adjacent continuum to define a linear (sloping) continuum distribution across each band and define the equivalent width in the usual way. The wavelenghts used to estimate the continuum for the C2H2 (7.5 m), SiC (11.3 m) and C2H2 (13.7 m) are listed in Table 3. For the 13.7-m band, the equivalent width mainly refers to the narrow component: the broad component extends beyond the chosen continuum wavelengths.
The continuum underneath the MgS band cannot be measured in this way, because the band is too broad and extends beyond the red edge of the spectral coverage of the IRS. We therefore instead use a black body to approximate the continuum, and give the strength as a line-to-continuum ratio integrated over the feature up to 38 m. The black body is defined using the [16.5][21.5] colour discussed below (see Fig. 8). Table 4 lists the resulting values.
| target | EW (7.5 m) | EW (13.7 m) | L/C (SiC) | L/C (MgS) | T(K) | |
|---|---|---|---|---|---|---|
| TRM 72 | 0.0520.005 | 0.0680.006 | 0.0730.002 | 11.37 | 0 | 1018 |
| IRAS 04557 | 0.1560.004 | 0.0660.003 | 0.1230.003 | 11.30 | 0.412 | 426 |
| IRAS 05009 | 0.0690.005 | 0.0620.004 | 0.1590.003 | 11.31 | 0.249 | 619 |
| IRAS 05112 | 0.1210.005 | 0.0660.003 | 0.0990.002 | 11.34 | 0.271 | 396 |
| IRAS 05113 | 0.1330.008 | 0.0490.004 | 0.0940.004 | 11.34 | 0.215 | 540 |
| IRAS 05132 | 0.0920.006 | 0.0710.005 | 0.1170.004 | 11.27 | 0.198 | 557 |
| IRAS 05190 | 0.1350.004 | 0.0740.004 | 0.1040.003 | 11.37 | 0.374 | 398 |
| IRAS 05278 | 0.0820.004 | 0.0750.003 | 0.1110.003 | 11.32 | 0.407 | 421 |
| GRRV 38 | 0.2180.023 | 0.1180.025 | 0.1430.019 | 11.14 | 0 | 858 |
| IRAS 05295 | 0.0920.007 | 0.0570.004 | 0.0860.002 | 11.34 | 0.162 | 462 |
| IRAS 05360 | 0.0920.004 | 0.0510.006 | 0.1800.006 | 11.19 | 0.624 | 395 |
| MSX LMC 219 | 0.1110.005 | 0.0610.004 | 0.1080.003 | 11.29 | 0.336 | 393 |
| MSX LMC 341 | 0.0830.007 | 0.0630.005 | 0.1530.004 | 11.16 | 0.637 | 482 |
| MSX LMC 349 | 0.0790.007 | 0.0490.005 | 0.1730.004 | 11.18 | 0.713 | 470 |
| MSX LMC 441 | 0.1290.007 | 0.0560.004 | 0.1250.003 | 11.26 | 0.446 | 427 |
| MSX LMC 443 | 0.1350.008 | 0.0540.007 | 0.1840.006 | 11.18 | 0.459 | 467 |
| MSX LMC 494 | 0.1090.007 | 0.0390.003 | 0.0800.003 | 11.31 | 0 | 780 |
| MSX LMC 601 | 0.0160.005 | 0.0600.005 | 0.0560.003 | 11.30 | 0 | 703 |
| MSX LMC 679 | 0.1220.006 | 0.0440.004 | 0.1510.004 | 11.22 | 0.477 | 415 |
| MSX LMC 743 | 0.1580.005 | 0.0420.004 | 0.1560.004 | 11.24 | 0.383 | 455 |
| MSX LMC 749 | 0.1200.003 | 0.0760.003 | 0.0580.004 | 11.25 | 0 | 865 |
| MSX LMC 754 | 0.1210.006 | 0.0530.004 | 0.1460.006 | 11.32 | 0 | 726 |
| MSX LMC 967 | 0.0850.003 | 0.0580.003 | 0.0860.003 | 11.30 | 0 | 742 |
| NGC 1978 MIR1 | 0.1570.004 | 0.0640.006 | 0.1620.005 | 11.30 | 0.528 | 446 |
| NGC 1978 IR1 | 0.1230.003 | 0.0700.004 | 0.0940.004 | 11.23 | 0 | 1179 |
| NGC 1978 IR4 | 0.1720.010 | 0.0820.009 | 0.1070.006 | 11.50 | 0 | |
| TRM 88 | 0.0510.006 | 0.0640.005 | 0.0650.004 | 11.26 | 0 | 684 |
5 Continuum definition: The Manchester system
| central [m] | -range [m] | [Jy] |
|---|---|---|
| 6.4 | 6.25–6.55 | 96.5 |
| 9.3 | 9.1–9.5 | 45.7 |
| 16.5 | 16–17 | 15.4 |
| 21.5 | 21–22 | 9.1 |

Much of the observed spectral range is covered by the molecular and dust bands discussed above. This leaves the continuum poorly defined: one needs to select specific wavelength regions which avoid these bands. The broadband IRAS filters are clearly not a good approximation. The blue continuum is most affected by molecular bands; the red continuum is in many cases obliterated beyond 15 m by the 30-m MgS band.
We have selected four narrow regions which can be used for dusty carbon stars (not for oxygen-rich stars!). The regions avoid most, but not all, of the obvious absorption and emission bands. The continuum bands are defined in Table 5. The bands will be called the Manchester system. Table 5 also lists the adopted zeropoint for the bands. These are extrapolated from the standard bands, and aim to return a zero colour for a Rayleigh-Jeans tail.
The 6.4-m band is situated between the SiS bands at 6.6 m and CS at 7 m on the red side, and the CO band at 5 m on the blue (Aoki et al., 1998). The wing of the CO feature may still affect the chosen band. There is also overlap with the PAH 6.2-m band but this band requires UV excitation and is seen in planetary nebulae and post-AGB stars but not in AGB star spectra.
The 9.3-m band is blueward of the SiC dust band, and red of the CS bands and C2H2 bands at 7–8 m (Aoki et al., 1999). There are also bands from molecules such as NH3 and C2H4 which may depress the continuum by a few per cent (Cernicharo et al., 2001a). However, it is situated in the C3 band discussed above, which is the main uncertainty in this spectral region and is significant for spectra dominated by photospheric emission. For these stars, the 9.3-m band will underestimate the true continuum.
The two bands at 16.5 and 21.5 m do not overlap with any strong molecular or dust features in carbon-rich material: it is situated just redward of the broad P-branch 14-micron C2H2 band, which extends to 16 m. There is a weak hydrocarbon feature at the blue edge of the chosen band (Cernicharo et al., 2001b). The strong 21-m dust feature which is still unidentified is seen in post-AGB stars only. The Manchester system should therefore be used for carbon-rich AGB stars only. The regions also avoid potential instrumental problems in the IRS, such as the LL1/LL2 interface.
The continuum fluxes of all observed targets in the Manchester system are listed in Table 6. These are derived by integrating the IRS spectra over the bands. We give the colours using the zeropoints of Table 5. Similar colours for SMC stars are given in Sloan et al. (2006). Table 6 lists a black-body colour temperature derived from the [16.5][21.5] colour. For the bluest spectra, the values become poorly defined as the red colour approaches the Rayleigh-Jeans limit, but for the majority of objects a reasonable value is derived. Apart from NGC 1978 IR1 with photospheric colours, the colour temperatures range from 1200 K for NGC1978 IR1 to around 400 K for the coolest objects.
| target | [6.4][9.5] | [16.5][21.5] | ||||
|---|---|---|---|---|---|---|
| [Jy] | [Jy] | [Jy] | [Jy] | [mag] | [mag] | |
| TRM 72 | 0.2110.001 | 0.2010.000 | 0.1190.001 | 0.0790.001 | 0.7580.005 | 0.1280.015 |
| IRAS 04557 | 0.1330.001 | 0.1740.001 | 0.1280.001 | 0.1020.001 | 1.1040.010 | 0.3360.009 |
| IRAS 05009 | 0.2280.001 | 0.2470.001 | 0.1560.001 | 0.1120.001 | 0.8980.005 | 0.2200.013 |
| IRAS 05112 | 0.2310.002 | 0.3090.001 | 0.2330.001 | 0.1920.001 | 1.1270.008 | 0.3360.007 |
| IRAS 05113 | 0.1600.001 | 0.2090.001 | 0.1540.001 | 0.1150.001 | 1.0980.008 | 0.2560.011 |
| IRAS 05132 | 0.1430.001 | 0.1810.001 | 0.1320.001 | 0.0980.001 | 1.0680.008 | 0.2470.016 |
| IRAS 05190 | 0.2250.002 | 0.3360.000 | 0.2950.001 | 0.2420.001 | 1.2470.010 | 0.3630.007 |
| IRAS 05278 | 0.6040.003 | 0.8070.002 | 0.5630.004 | 0.4540.002 | 1.1260.006 | 0.3410.008 |
| GRRV 38 | 0.0670.001 | 0.0370.001 | 0.0210.001 | 0.0140.000 | 0.1650.033 | 0.1540.032 |
| IRAS 05295 | 0.1500.001 | 0.1710.000 | 0.1150.001 | 0.0900.001 | 0.9530.006 | 0.3060.009 |
| IRAS 05360 | 0.1070.001 | 0.1350.001 | 0.0890.001 | 0.0740.001 | 1.0620.006 | 0.3670.014 |
| MSX LMC 219 | 0.1120.001 | 0.1480.001 | 0.0970.000 | 0.0800.001 | 1.1120.009 | 0.3700.009 |
| MSX LMC 341 | 0.1090.000 | 0.1260.001 | 0.0780.001 | 0.0600.000 | 0.9630.006 | 0.2910.012 |
| MSX LMC 349 | 0.1410.001 | 0.1660.000 | 0.1030.001 | 0.0800.001 | 0.9940.007 | 0.3000.009 |
| MSX LMC 441 | 0.1370.001 | 0.1810.001 | 0.1190.001 | 0.0960.000 | 1.1150.013 | 0.3350.008 |
| MSX LMC 443 | 0.0830.001 | 0.0920.000 | 0.0550.000 | 0.0420.000 | 0.9180.008 | 0.3020.014 |
| MSX LMC 494 | 0.0940.000 | 0.0730.000 | 0.0350.000 | 0.0240.000 | 0.5400.006 | 0.1700.018 |
| MSX LMC 601 | 0.1150.001 | 0.1240.000 | 0.0740.000 | 0.0520.001 | 0.8940.006 | 0.1910.012 |
| MSX LMC 663 | 0.1160.001 | 0.1020.000 | 0.0780.000 | 0.0720.000 | 0.6770.006 | 0.4780.007 |
| MSX LMC 679 | 0.1350.001 | 0.1440.000 | 0.0850.001 | 0.0690.000 | 0.8860.006 | 0.3460.010 |
| MSX LMC 743 | 0.0930.000 | 0.1130.000 | 0.0670.000 | 0.0530.000 | 1.0260.006 | 0.3110.009 |
| MSX LMC 749 | 0.2380.001 | 0.1960.000 | 0.1010.000 | 0.0680.001 | 0.6020.003 | 0.1520.011 |
| MSX LMC 754 | 0.0860.000 | 0.0720.000 | 0.0330.000 | 0.0230.000 | 0.6140.009 | 0.1840.014 |
| MSX LMC 967 | 0.1820.000 | 0.1440.001 | 0.0740.001 | 0.0510.000 | 0.5580.005 | 0.1800.011 |
| NGC 1978 MIR1 | 0.1120.001 | 0.1160.000 | 0.0720.001 | 0.0570.000 | 0.8520.006 | 0.3180.009 |
| NGC 1978 IR4 | 0.0420.000 | 0.0210.000 | 0.0120.000 | 0.0070.000 | 0.0790.024 | 0.0080.031 |
| NGC 1978 IR2 | 0.0450.001 | 0.0220.000 | 0.0120.000 | 0.0060.000 | 0.0610.025 | 0.1340.026 |
| NGC 1978 IR1 | 0.1060.000 | 0.0840.001 | 0.0390.000 | 0.0250.000 | 0.5540.007 | 0.1100.016 |
| TRM 88 | 0.0980.001 | 0.0940.001 | 0.0520.001 | 0.0370.000 | 0.7690.009 | 0.1960.013 |
6 Continuum colours and optical depth
6.1 Manchester colours
The IRS colour–colour diagram based on the Manchester bands for our targets is shown in Fig. 9. Error bars are indicated where the size of the bars exceeds the size of the symbol. We note that the errors are calculated from the tabulated noise on the spectrum, and do not include systematic effects such as calibration uncertainties or background subtraction. The majority of the stars fall on a well determined sequence. There three exceptions: two stars are much bluer in [6.4][9.3], and one star is too red in [16.5][21.5] by approximately 0.25 mag.
The first two stars are GRRV 38 and NGC 1978 IR4. Both of these have spectral energy distributions largely consistent with naked carbon stars. They are also faint in the IRS wavelength range and the colours have larger uncertainties than for the other stars, but the errorbars shown on the figure indicate that the flux uncertainties do not affect their positions in this diagram. The last star is MSX LMC 663, in which the [21.5] band includes an additional emission component.
All other stars show continuum emission dominated by circumstellar dust over all wavelenghts considered here. The good correlation between the two colours confirms the choice of the continuum regions.
6.2 Comparison models
We calculated a series of benchmark dust models, to compare the colours. The models used the DUSTY code, with a density distribution of a radiation-driven wind (Elitzur & Ivezić, 2001), . Models were run with an optical depth at 1 m ranging from 0.01 to 100. For the central star we assumed a black body of K. The inner radius of the shell was set at a dust temperature of 1000 K. A dust mixture of 95 per cent amorphous carbon and 5 per cent SiC was used. The resultant spectra were used to measure the flux through the bandpasses, converted to colours using the zeropoints of Table 5. Such models lack the important molecular bands and are not meant to fit the observed spectra: this will be the subject of a forthcoming paper.
The models are systematically too red in [16.5][21.5] by about 0.15 mag. The drawn line in Fig. 9 shows the models, where we shifted the model tracks down by 0.15 mag to compensate for the offset. The cause of the offset is not known.
The models for yield a colour of [6.4][9.3]. At these wavelengths, a 2800 K black body is considerably redder than a Rayleigh-Jeans curve. The observed cutoff in this colour (Fig. 9) is consistent with the models, but the two stars with photospheric spectra are considerably bluer. This blueshift reflects the effect of photospheric molecular bands, such as suppression of the [9.3] flux by the proposed C3 band. In support of this supression by C3, the [6.4][9.3] colour of the symbiotic C star MSX LMC 663, which also has little dust but different photospheric molecular bands, is in good agreement with the models.
We conclude that [6.4][9.3] is indicative of a naked carbon star. The implication is that the Manchester [9.3] band may not define a stellar continuum for a naked carbon star, but it can be used instead to judge the strength of the absorption band.
6.3 Optical depth

High optical depth in a circumstellar shell affects the spectral energy distribution in two ways. Extinction within the wavelength of interest suppresses the bluest bands, and absorption of optical and near-infrared stellar emission lowers the dust temperature further out.111In individual cases, density variations which differ from an distribution can lead to dust temperatures which mimic optical-depth effects. This is illustrated for our sample in Fig. 10.
The left panel shows the K-magnitude versus the [6.4][9.3] colour. The relation between redder colour and fainter K-band magnitude in Fig. 10 confirms the effects of optical depth. The right panel shows the K-band versus the [9.3] band magnitude: the latter is not affected by extinction within the range of optical depths probed by our sample. It is also close to the peak of the dust spectral energy distribution, and varies little as function of temperature. Indeed, the distribution of [9.3] magnitudes remains fairly narrow while the K-band magnitude fades. (One outlier in this plot is IRAS 052786942, which has a higher bolometric luminosity.) At brighter K, the [9.3] magnitude becomes a little fainter, tracing the effect of less dust.
The drawn curves show the same models as discussed in section 6.2. For a single luminosity, it shows the expected behaviour with increasing optical depth, excluding the effects of molecular bands. As the depth of the shell increases, first the [9.3] magnitude becomes brighter, before the K-band begins to fade sharply beyond a critical optical depth. The curves follow the general behaviour of the observed spectra, but we again note that no attempt has been made to fit the data.
The optical depth is a measure of the mass-loss rate. The models imply that the K [9.3] colour can be used as an indicator for the optical depth. The dashed line in the right panel of Fig.10 shows a constant K [9.3] corresponding to the onset of K-band fading. The filled symbols (squares and triangles) show sources with 30-m MgS emission. The dashed line shows that the presence of especially this band is related to the optical depth in the shell.
7 Discussion
7.1 Carbon star colour selection
Almost all sources presented here are carbon stars. Only two oxygen-rich objects were found in our entire sample of LMC stars, and only one is classified as an AGB star.
On one hand, this result is entirely expected. The stars at the beginning of the mass-loss sequence shown in Fig 1(a) are already optical carbon stars and it is expected that more evolved stars on the sequence would also be C stars. Such an expectation would only break down for massive and relatively rare AGB stars that lie above the the sequence of Fig. 1(a) since such stars do not ever become carbon stars.

On the other hand, based on the colour classification of Egan et al. (2001), a higher fraction of oxygen-rich dust shells would be expected. The colour criterion to separate oxygen-rich and carbon-rich stars, suggested by Egan et al. (2001), is based on the JK versus KA colours. The diagram is shown in Fig. 11. The hashed regions indicate the colour range shown by their model carbon stars (left panel) and oxygen stars (right panel), based on the SKY model of Wainscoat et al. (1992). Overplotted are the location of the stars in our sample. These mostly have colours redder than shown by any of the model carbon stars included in the SKY model. The distribution of our stars suggests that the SKY model can be extrapolated to redder stars. For obscured stars, there is considerable overlap in continuum colours between oxygen-rich and carbon-rich stars.
There is however an effect from the silicate feature wich dominates the 10-m spectrum of oxygen-rich stars. The effect is shown for the IRAS 12-m band by van Loon et al. (1997). At low mass-loss rates, the silicate is strongly in emission and enhances the K[12]. At higher mass-loss rates, the silicate becomes a strong absorption feature which reduces the K[12]. At a particular JK, oxygen-rich stars with low mass-loss rates are redder in K[12] than carbon stars, whilst for high mass-loss rates the opposite is true. Inevitably, there is a range where classification is not possible using these colours.
The KA colour shows a similar intrusion by silicate, but the MSX A-band (6.8–10.8 m) contains more continuum and less silicate than does the IRAS 12-m band, and therefore the flux in the A-band does not decline as much when silicate goes into absorption. We calculated similar models as in Section 6.2, but for oxygen-rich dust. The stellar temperature was taken as 3200 K, and an Ossenkopf et al. (1992) warm ’circumstellar’ silicate model was assumed. (These silicate optical constants may not be optimal for circumstellar dust.) The dashed line in the right panel of Fig. 11 shows the resulting track with optical depth. It does indeed traverse the region used by Egan et al. (2001) but the KA colour reaches an effective limit whilst the JK colour continues to redden. The accuracy of this track is limited. The carbon-rich models of Section 6.2 could not be used, because the molecular bands are rather important for the stellar and circumstellar spectra at these wavelengths, and these bands are missing from the DUSTY models. Instead we draw a line through the observed data points, which are known to be true locations of carbon stars. At the highest mass-loss rates, this track is likely to steepen considerably and to run close to the model-track for oxygen-rich stars. At low mass-loss rate C and O-rich stars are well-separated, but not at high .

We used ISO/SWS and 2MASS data of Galactic stars to further examine the usefulness of nature of the JK vs KA diagram. The ISO/SWS spectra (Kraemer et al., 2002) are convolved with the MSX A-band filter transmission curve. The zero magnitude for MSX is taken from Cohen et al. (2000). The ISO/SWS stars are cross-correlated with the 2MASS data base and SIMBAD for identifications. Selection criteria are for ISO/SWS, and 2MASS flags either a,b,c,d in all of the JHK bands. This restricts the Galactic sample to 271 spectra. Some stars were observed several times and all of the A-band magnitudes were analysed individually. Spectral types range from B-type to M- and C-types, and post-AGB stars and PNe (all of them are WC), as well as young stellar objects are included. The M-type stars are all giants, sub-super giants, or super giants; no dwarfs or sub-dwarfs are selected.
The JK vs KA diagram for this Galactic sample is shown in Fig. 12. Early-type stars have increasing JK while KA remains constant, due to continuum H- absorption. This H- absorption is still important for early M-type stars, while circumstellar excess affects both colours among late M-type stars. C-type refers to spectroscopically known carbon stars; these form a relatively narrow sequence. The isolated carbon star at [KA] is AFGL 5625: it shows a feature-less spectrum (i.e. no SiC), except for 14-m C2H2. The OH/IR stars show a large range of colours; OH/IR stars with [KA] show silicate emission with self-absorption on top (e.g., CRL 2199, WX Psc), whilst OH/IR stars with [KA] show silicate absorption.
The separation between C-type and M-type stars with low mass-loss rates () is due to photospheric, near-infrared molecular bands. For oxygen-rich Mira stars, the Ks-flux is suppressed by water absorption (e.g., Tej et al., 2003; Matsuura et al., 2002b). For carbon stars, the J-band flux is suppressed by C2 and CN absorption (Loidl et al., 2001). At high mass-loss rates, the carbon stars have well-defined colours which overlap with the (more scattered) oxygen-rich stars. Extremely red stars have no counterpart in the LMC sample of Egan et al. (2001). This may be because of the 2MASS detection limit.
At high mass-loss rates, the Egan et al. diagram cannot distinguish carbon and oxygen-rich stars on an individual basis. However, stars on the carbon-star sequence are statistically more likely to be carbon stars. Our selected stars fall on this sequence. At low mass-loss rates the Egan et al. colours of our targets are consistent with a carbon-rich nature. The sole oxygen-rich AGB star, IRAS 050036712, has colours consistent with the carbon-rich sequence (JK, KA), but at the blue end of the range where the two types overlap.
7.2 Molecules
All molecules suggested to be present (C3, HCN, C2H2) are so-called parent molecules, which form in the photosphere, and are found throughout the outflow, up to the photodissociation region at 1–3 (Millar & Herbst, 1994; Millar et al., 2001). Especially C2H2 is fundamental in the chemistry leading to large organic molecules such as PAHs. The abundance of these molecules is an important parameter for our understanding of chemistry in low-metallicity shells. van Loon et al. (1999b) noticed that the 3.1-m band in LMC stars was of the same strength as in Galactic stars, and suggested that the lower metallicity was compensated by a higher C/O ratio. Matsuura et al. (2002a); Matsuura et al. (2005) find that C2H2 is more abundant in LMC and SMC stars than in Galactic comparison stars, based on the 3.1 and 3.8-m absorption bands. Chemical models (Matsuura et al., 2002a) confirm the sensitivity of C2H2 to the C/O ratio. The carbon enhancement from third dredge-up leads to a higher C/O ratio for lower initial oxygen abundance. van Loon et al. (2006) confirm that HCN is weak compared to C2H2 and that CS is absent, using the shape and structure in the 3.8-m absorption. They also show that the bands become sharper for stars with stronger pulsation, and interpret this as evidence for cold molecular gas at some distance above the stellar photosphere.
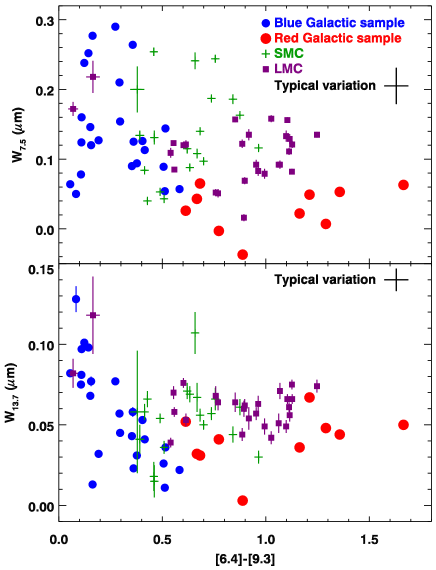
The equivalent widths of the molecular bands are listed in Table 4. Fig. 13 plots these values for the C2H2 7.5 m and 13.7 m bands as a function of the [6.4][9.3] colour. The squares in the panels indicate the LMC stars. Especially the 13.7-m band shows a narrow range in equivalent width. The 7.5-m band show a large range, but neither correlates well with infrared colour. The two ’naked’ carbon stars show stronger bands. The equivalent width of the 13.7-m feature excludes the wings of the broad component, and may therefore underestimate its strength for hot (photospheric) gas.
Sloan et al. (2006) compare the strengths of these features for Galactic carbon stars and SMC carbon stars. They find that for stars with [6.4][9.3] 0.6, the C2H2 bands are stronger in the SMC than in the Galaxy, the difference being more readily apparent at 7.5 m than at 13.7 m. The difference of strength between Galactic, LMC and SMC stars is interpreted as due to higher abundances of C2H2 in the SMC, in accordance with the prediction of Matsuura et al. (2005). Fig. 13 includes the Galactic and SMC samples. The equivalent widths are measured in the same way for all stars. The Galactic sample (based on ISO spectra) is divided in ’blue’ and ’red’ stars, based on whether the [6.4][9.3] colour is bluer than the lowest extinction DUSTY model (Section 6.2): blueward colours are indicative of naked carbon stars.
The Galactic sample has a large range of [6.4][9.3] colour. The SMC sample in contrast shows a very limited colour range. For the same mass-loss rate one may expect lower metallicity stars to have lower optical depths because of a lower dust abundance. The SMC stars should show a lower [6.4][9.3] than the LMC stars, whilst the Galactic stars should show the reddest colours. This effect is best seen for [6.4][9.3]. In the models of Section 6.2, an increase of a factor of 3 in optical depth reddens the [6.4][9.3] from 0.8 to 0.9, from 1.05 to 1.3, and from 1.3 to 1.8. The metallicity effect on colour is therefore much stronger for the redder stars, consistent with the distribution in the figure.
The bluest objects, which are expected to be naked carbon stars, are almost exclusively Galactic stars, with two LMC objects. This is a selection effect, in that only mass-losing stars were selected for the various Magellanic Cloud surveys. For the redder stars, the shift in colour with optical depth suggests the Galactic stars with [6.4][9.3] between 1.2 and 1.8 should be compared with the LMC stars between 1.0 and 1.2, and the SMC stars around 0.9. In the top panel, this shows a significant relation, with the 7.5-m feature becoming much stronger for lower metallicity. For the bluer mass-losing stars, where there is little change of colour with optical depth, the LMC stars have a stronger 7.5-m band than Galactic stars, but there is no clear offset between LMC and SMC stars.
Overall, this provides some evidence for the suggestion that the C2H2 bands are stronger in lower metallicity environments. For the 13.5-m band, a small shift is also seen between the Galactic and the LMC stars, although less convincing than at 7.5m, but the LMC and SMC stars show comparable equivalent widths.
The fact that the C2H2 bands show a relatively small range in equivalent width for a large range of colour temperatures, confirms that the molecule is located throughout the shell.
7.3 Dust
7.3.1 Temperature dependence
The Spitzer spectra show that SiC dust bands are observed for most or all carbon stars, but the MgS band is present in only a subset. This already indicates that the MgS mineral forms under more restricted conditions. The occurrence and strength of the two bands is plotted for the LMC stars in Fig. 14, as function of the continuum temperature (derived from [16.5][21.5]) and of the [6.4][9.3] colour, as tracer of optical depth. The sources are put in three different groups: the circles indicate stars without an MgS feature; triangles show stars with MgS and with weak SiC (defined as a line-to-continuum ratio less than 0.14); squares show stars with MgS and stronger SiC.
The figure shows that the presence of MgS correlates strongly with the dust temperature. There is a sharp division at a (black body) temperature of K: none of the stars with hotter dust show MgS, whilst all stars with cooler dust do. Between dust temperatures of 500 and 600 K the MgS feature is relatively weak, and at lower temperatures the feature is stronger and shows a large range of line-to-continuum ratio. In contrast, SiC tends to be weaker at high dust temperatures but is almost always present. Panel d indicates that increasing SiC strength is accompanied by rapidly increasing MgS. The difference can be understood in terms of the formation mechanism of the different dust species. Solid SiC condenses directly from the gas, at high temperatures. MgS grows as a surface on pre-existing grains (Nuth et al., 1985): this process only starts at temperatures around 600 K, and is complete around 300 K.

Fig. 15 shows a less common way to look at MgS, using the relation with pulsation period of the star (taken from Table 2). The double-period star is not plotted. The MgS feature is seen in general for stars with periods longer than 650 days. The relation is an indirect one, in the sense that the longest period stars tend to have the highest mass-loss rates.

7.3.2 Metallicity dependence
Fig. 16 compares the strengths of the SiC and MgS features in our LMC sample with the SMC and Galactic samples of Sloan et al. (2006). Sloan et al. find that the SiC and MgS features are weaker in the SMC than in the Galaxy. This is expected, as Mg, Si and S are not produced in AGB stars and their abundance should scale directly with metallicity. Our data show a more complicated picture, however.
The line-to-continuum ratios are plotted against [6.4][9.3], which is a measure of optical depth. As before, for the higher-mass-loss stars the optical depth is less in the SMC, while at low optical depth SMC, LMC and Galactic stars can be compared at the same value for [6.4][9.3]. The top panel shows that at low optical depth ([6.4][9.3] ), there is a clear sequence with the SiC line-to-continuum ratio diminishing with decreasing metallicity. At higher optical depth, the three samples indicate very similar ratios. Stars with ’naked carbon star’ colours show a high line-to-continuum ratio, related to the weakness of the continuum, with a sequence clearly offset from the dusty stars. It is possible that here the continuum used to measure the band strength is affected by molecular absorption bands, giving an artifically enhanced feature. The SiC band is flanked by two photospheric bands, attributed to C2H2 and C3, and a true continuum cannot easily be defined.
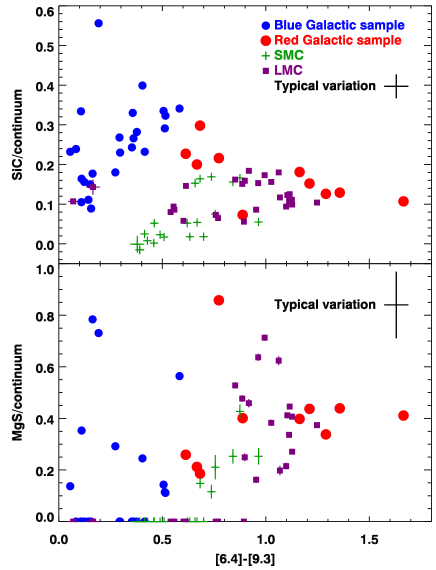
The MgS feature is illustrated in the bottom panel of Fig. 16. There is an indication that the MgS band is weaker in the SMC than in comparable Galactic and LMC stars. The LMC stars show a very large scatter and it is not possible to draw conclusions regarding its typical strength. We note that the continuum underneath the feature is not well defined in Spitzer spectra because of its long-wavelength cutoff.
In both cases the line-to-continuum ratio in dusty stars compares the band strength with the underlying dust continuum, assumed to be due to amorphous carbon. As the carbon is dredged-up in the star while the mineral constituents are not, the ratio is expected to decrease with decreasing metallicity. However, this is also affected by the dust condensation process. If seeds are needed to grow the amorphous carbon grains (e.g. TiC), the relation between mineral and amorphous carbon dust could be more complicated. Especially the SMC data indicate that the emissivity ratio between minerals and amorphous carbon dust is lower at low metallicity, but the LMC data is inconclusive on this point.
The abundance of SiC is limited by the enriched carbon and the unenriched silicon. The abundance of MgS is limited by two unenriched elements. If the condensation is 100 per cent efficient, both will be affected similarly by metallicity. If the condensation operates at lower efficiency, the formation becomes limited by the collision rate and the the abundance of MgS would more strongly dependent on metallicity than SiC ([MgS], while [SiC], where is the fractional abundance of metals). (Temperature effects may also contribute, as lower opacity gives rise to higher dust temperatures.) The spectra presented here do not support such a strong dependence on metallicity, but favour a linear relation. This supports a high condensation efficiency for MgS. Confirmation will require detailed modelling of the dust spectra.

7.3.3 Central wavelengths
The central wavelengths of the dust bands are important diagnostics (Speck et al., 2005; Hony et al., 2002) of the dust environment. We define the central wavelength (hereinafter ) as the wavelength which disects the flux distribution in the band: i.e. after continuum subtraction, half the band flux arises redward and half blueward. This definition is more stable against noise on the spectral energy distribution than the wavelength of peak emission strength. However, for MgS only part of the band is covered by the Spitzer spectra and the derived central wavelength reflects this.
Fig. 17 shows the observed variation of , as a function of the [6.4][9.3] colour. Sloan et al. (2006) have shown that for Galactic carbon stars with [6.4][9.3] 0.5, increases monotonically with [6.4][9.3] colour, from m up to m for the reddest source of their sample. For bluer colours reddens again: their relation is indicated by the dashed line. Speck et al. (2005) argue that red carbon-rich stars can show the SiC in self-absorption and full-absorption. This absorption occurs at 10.8 m, so that an increase of the amount of SiC dust leading to self-absorption will cause a redward shift of . The presence of an absorption component in all stars remains to be proven.
The inverse shift to longer wavelength of , for stars with [6.4][9.3] 0.5, is not yet explained. This colour corresponds to naked carbon stars, where the [9.3] band may be suppressed by a photospheric molecular band. This band borders the SiC feature, and may overlap with it in wavelength. This would have a similar effect as the self-absorption proposed by Speck et al. (2005), and could self consistently explain why a bluer [6.4][9.3] colour (deeper 10-m absorption) correlates with a redder SiC feature. Note that the broad molecular absorptions at 10 and 13 m may give the impression of an intermediate emission band: the actual presence of SiC in such stars may be in doubt.
In our LMC sample, we observe that is redder for the stars with weaker SiC features (triangles in Fig. 17). These stars have slightly redder [6.4][9.3] as shown in Fig. 14. This can in principle be interpreted as being due to self-absorption weakening the band, although other explanations are possible. In our sample, the dust continuum temperature has no discernable influence on .
The LMC stars with MgS (triangles and squares: cool dust) follow the slope of the relation of Sloan et al. (2006), but offset towards redder [6.4][9.3]. An alternative view would be that at the same optical depth, LMC stars have a bluer . This may reflect the broad C2H2 R-band at 12–14 m, depressing the apparent red continuum. A stronger C2H2 band in LMC stars would shift the observed to shorter wavelength.
Fig. 18 shows the central wavelength of the MgS feature (hereinafter , defined as for the SiC feature central wavelength) as a function of the temperature derived from the [16.5][21.5] colour. From a large sample of Galactic evolved stars, Hony et al. (2002) show that the central wavelength of the MgS feature is independent of continuum temperatures. They explain this by the fact that MgS is partially heated by mid-IR radiation. In our sample, the MgS band is observed only in stars spread over a small range of continuum temperatures, making it difficult to find any correlation between and the temperature. The suggestion of longer for higher dust temperatures is not conclusive. Our LMC sample shows similar to Galactic stars observed by Hony et al. within the same temperature range. Fig. 19 show the shape of the continuum-substracted MgS feature. This figure confirms that there is no apparent correlation between the MgS feature shape and the dust continuum temperature. The short-wavelength band edge has a similar shape in all spectra. There is some separation between stars with relatively flat MgS band and stars whhere the band diminishes towards the red, but this separation does not show an evident correlation with dust temperature.


7.3.4 Oxygen-rich dust
The current sample contains almost exclusively carbon-rich stars. Oxygen-rich mass-losing stars do exist in the LMC, as found in the sample of, e.g., Trams et al. (1999) (see also Dijkstra et al., 2005). Comparing the JK versus KA diagram for MSX sources in Egan et al. (2001), with the diagrams in Section 7.1, shows that the majority of cocoon LMC stars have colours consistent with the carbon star sequence, but some stars are bluer in KA and these could be oxygen-rich.
The higher efficiency of third dredge-up at low metallicity turns LIMS into carbon stars relatively early on the AGB: the existence of optical (i.e. unobscured) carbon stars show that in the LMC this typically occurs before the onset of the high mass-loss phase. Oxygen-rich mass-losing stars will most likely be either stars with initial masses large than about 4 M⊙, where hot bottom burning prevents the star from becoming carbon-rich, or low-mass stars.
Dust formation in oxygen-rich stars is dependent on metallicity-dependent minerals, such as corundum and various silicates. Oxygen-rich stars may therefore show relatively poor dust formation efficiency at low metallicity. For some stars, this could in principle delay the superwind phase sufficiently to allow them to become a carbon star. Carbon stars are less affected by metallicity, as dust is produced from self-enriched carbon. It would be of interest to test whether the LMC stars show any evidence for a delayed or weaker superwind for oxygen-rich stars.
The predominance of mass-losing carbon stars implies that dust enrichment of the ISM at low metallicity by AGB stars will be strongly dominated by amorphous carbon dust, as compared to the Galaxy.
7.4 Three groups
In Sect. 7.3.1, we have shown that the plot of the strength of the dust bands versus colours or temperatures permits us to identify three distincts group of carbon stars in our LMC sample. The three groups can be defined as: (1) stars with a strong SiC feature and MgS, (2) stars with a weak SiC feature and MgS, and (3) stars without an MgS feature.

Fig. 20 shows the spectral shapes of stars within those three groups, obtained by averaging the different spectra within each group.
The shape of the SiC band is essentially identical between the first two groups. The continuum on either side is different. The narrow 13.7-m band weakens as SiC becomes weaker, but the broad band between 12 and 16 m becomes much more prominent. This is best seen by comparing the slopes of the spectra. The blue slopes of the continua (5–9 m) also show a difference between the three groups.
Such a classifiation can be compared with that proposed by Kraemer et al. (2002), who divide dusty carbon-rich stars into red (CR) and blue (CE). In our sample, about 10 stars would be classified as CE and the remainder (apart from the symbiotic C star) as CR. In the Galactic ISO sample of Kraemer et al. (2002), CE stars are somewhat more dominant. This difference is likely to be caused by selection effects.
8 Conclusions
We have presented a Spitzer survey of 29 mass-losing Asymptotic Giant Branch stars in the Large Magellanic Cloud. Most are classified as carbon stars, based on the infrared spectra. One of the C stars is also a symbiotic star. Two oxygen-rich stars were also present in the original survey: one was found to be a high-mass young stellar object and is presented in van Loon et al. (2005b).
The spectra cover the wavelength range 5–38 m. The short wavelength range, up to 16 m, is dominated by absorption bands caused by circumstellar and/or photospheric molecules. At the short edge, bands of CO and C3 cause a sharp drop of the stellar energy distribution towards the blue end of the spectral range. Absorption bands at 7.5 and 13.7 m are due to acetylene, C2H2. The 13.7m band contains both a narrow and a broad component, the latter tracing hotter gas. These bands are also seen in two naked carbon stars in our sample.
Dust emission bands are present in our sample at 11 and at 30 m, due respectively to SiC and MgS. The first band is present in almost every object, regardless of dust temperature. MgS is only present when the dust temperature is below 650 K, approximately in half the sample. This is consistent with how these minerals form: SiC condenses directly out of the gas phase, but MgS is deposited on existing dust grains below a critical temperature.
Because of the many bands in the spectrum, continuum definition is difficult. We define a set of four narrow bands, called the Manchester system, which can be used to trace the continuum for dusty carbon stars. The bands are centred at 6.4, 9.3, 16.5 and 21.5 m. The [6.4][9.3] colour is shown to be a measure of the optical depth in the shell. The [16.5][21.5] colour can be used to measure the dust temperature. Two naked carbon stars show much bluer colours in [6.4][9.3] than expected from models. This is attributed to suppression of the [9.3] band by a molecular band, which is apparent in many of the stars but is particularly clear in stars with photospheric infrared emission. A 10-m absorption band in carbon stars has previously been attributed to interstellar silicate, but this assignment can be ruled our for the LMC stars. A recent assignment to silicon-nitrite particles can also be ruled out for emission at photospheric temperatures. This supports the identification with a C3 band, as proposed by Jørgensen et al. (2000).
The classification scheme of mass-losing stars by Egan et al. (2001) is investigated. Based on this scheme, some stars in our sample were expected to be oxygen-rich. We show from current data, from dust models and from ISO spectra of Galactic stars, that for high mass-loss stars, the JK, KA colours cannot easily distinguish oxygen-rich from carbon-rich stars. The fact that almost all our sample was found to be carbon rich reflects the fact that they lie on a sequence of increasing mass-loss rate, with the stars becoming carbon stars even before they develop thin dust shells.
We investigate the strengths of the molecular and dust bands as function of metallicity, based on a comparison with carbon stars in the Galaxy and the SMC. The 7.5-m C2H2 band shows evidence for increasing equivalent width with decreasing metallicity. The 13.7-m band does not clearly show this. The SiC band shows evidence for a much lower line-to-continuum ration at the lowest metalicity (the SMC) but no strong difference between the LMC and the Galaxy. For MgS there is an indication for a sequence of decreasing line-to-continuum ratio with decreasing metallicity. We show that the central wavelength of the SiC feature depends on the [6.4][9.3] colour, consistent with Sloan et al. (2006). It is however important to realize the uncertainty of the continuum determination, affected by the molecular absorption bands on either side.
The increasing strength of acetylene bands with decreasing metallicity can be explained by the effect of carbon dredge-up: a fixed amount of added carbon gives a higher C/O ratio at lower metallicity (less O), leaving more free carbon after the formation of CO. This may also be the cause of the C3 bands which we see. SiC and MgS do not benefit form this effect, and their abundance is expected to scale more directly with metallicity.
We finally note that dust formation in oxygen-rich stars is dependent on metallicity-dependent minerals, such as corundum and various silicates. Oxygen-rich stars may therefore show relatively poor dust formation efficiency at low metallicity. Carbon stars, on the other hand, depend for dust on self-produced carbon and can have high efficiency of forming amorphous carbon dust. The earlier formation of carbon stars due to third dredge-up, together with a possible difference in dust formation efficiency, means that dust enrichment of the ISM at low metallicity by AGB stars will be dominated by amorphous carbon dust, as compared to the Galaxy.
Acknowledgements
We appreciate the efforts of the IRS team at Cornell. AAZ, EL and MM acknowledge PPARC rolling grant support. PPARC also supported this research via a visitor grant. PRW acknowledges the support provided by a grant from the Australian Research Council. MM thanks the UMIST Peter Allen Travelling Grant. M. Cohen kindly provided us with the MSX filter transmission curve.
References
- Alves et al. (2002) Alves D. R., Rejkuba M., Minniti D., Cook K. H., 2002, ApJ, 573, L51
- Aoki et al. (1998) Aoki W., Tsuji T., Ohnaka K., 1998, A&A, 340, 222
- Aoki et al. (1999) Aoki W., Tsuji T., Ohnaka K., 1999, A&A, 350, 945
- Baron et al. (1987) Baron Y., Papoular R., Jourdain de Muizon M., Pegourie B., 1987, A&A, 186, 271
- Bica et al. (1999) Bica E. L. D., Schmitt H. R., Dutra C. M., Oliveira H. L., 1999, AJ, 117, 238
- Cami (2002) Cami J., 2002, Ph.D. Thesis, University of Amsterdam
- Cernicharo et al. (2001a) Cernicharo J., Heras A. M., Pardo J. R., Tielens A. G. G. M., Guélin M., Dartois E., Neri R., Waters L. B. F. M., 2001a, ApJ, 546, L127
- Cernicharo et al. (2001b) Cernicharo J., Heras A. M., Tielens A. G. G. M., Pardo J. R., Herpin F., Guélin M., Waters L. B. F. M., 2001b, ApJ, 546, L123
- Cernicharo et al. (1999) Cernicharo J., Yamamura I., González-Alfonso E., de Jong T., Heras A., Escribano R., Ortigoso J., 1999, ApJ, 526, L41
- Cioni et al. (2003) Cioni M.-R. L., Blommaert J. A. D. L., Groenewegen M. A. T., Habing H. J., Hron J., Kerschbaum F., Loup C., Omont A., van Loon J. T., Whitelock P. A., Zijlstra A. A., 2003, A&A, 406, 51
- Cioni et al. (2001) Cioni M.-R. L., Marquette J.-B., Loup C., Azzopardi M., Habing H. J., Lasserre T., Lesquoy E., 2001, A&A, 377, 945
- Clément et al. (2003) Clément D., Mutschke H., Klein R., Henning T., 2003, ApJ, 594, 642
- Clément et al. (2005) Clément D., Mutschke H., Klein R., Jäger C., Dorschner J., Sturm E., Henning T., 2005, ApJ, 621, 985
- Cohen et al. (2000) Cohen M., Hammersley P. L., Egan M. P., 2000, AJ, 120, 3362
- Dijkstra et al. (2005) Dijkstra C., Speck A. K., Reid R. B., Abraham P., 2005, ApJ, 633, L133
- Dray et al. (2003) Dray L. M., Tout C. A., Karakas A. I., Lattanzio J. C., 2003, MNRAS, 338, 973
- Dwek (1998) Dwek E., 1998, ApJ, 501, 643
- Edmunds (2001) Edmunds M. G., 2001, MNRAS, 328, 223
- Egan et al. (2001) Egan M. P., Van Dyk S. D., Price S. D., 2001, AJ, 122, 1844
- Elitzur & Ivezić (2001) Elitzur M., Ivezić Ž., 2001, MNRAS, 327, 403
- Feast et al. (1989) Feast M. W., Glass I. S., Whitelock P. A., Catchpole R. M., 1989, MNRAS, 241, 375
- Feast & Whitelock (1992) Feast M. W., Whitelock P. A., 1992, MNRAS, 259, 6
- Feast et al. (2003) Feast M. W., Whitelock P. A., Marang F., 2003, MNRAS, 346, 878
- Forrest et al. (1981) Forrest W. J., Houck J. R., McCarthy J. F., 1981, ApJ, 248, 195
- Gautschy-Loidl et al. (2004) Gautschy-Loidl R., Höfner S., Jørgensen U. G., Hron J., 2004, A&A, 422, 289
- Gavilán et al. (2005) Gavilán M., Buell J. F., Mollá M., 2005, A&A, 432, 861
- Glass & Reid (1985) Glass I. S., Reid N., 1985, MNRAS, 214, 405
- Goebel et al. (1981) Goebel J. H., Bregman J. D., Witteborn F. C., Taylor B. J., Willner S. P., 1981, ApJ, 246, 455
- Goebel & Moseley (1985) Goebel J. H., Moseley S. H., 1985, ApJ, 290, L35
- Goriely & Mowlavi (2000) Goriely S., Mowlavi N., 2000, A&A, 362, 599
- Groenewegen (2004) Groenewegen M. A. T., 2004, A&A, 425, 595
- Hajduk et al. (2005) Hajduk M., Zijlstra A. A., Herwig F., van Hoof P. A. M., Kerber F., Kimeswenger S., Pollacco D. L., Evans A., Lopéz J. A., Bryce M., Eyres S. P. S., Matsuura M., 2005, Science, 308, 231
- Hony (2002) Hony S., 2002, Ph.D. Thesis, University of Amsterdam
- Hony & Bouwman (2004) Hony S., Bouwman J., 2004, A&A, 413, 981
- Hony et al. (2002) Hony S., Waters L. B. F. M., Tielens A. G. G. M., 2002, A&A, 390, 533
- Houck et al. (2004) Houck J. R., Roellig T. L., van Cleve J., Forrest W. J., Herter T., Lawrence C. R., Matthews K., Reitsema H. J., et al. 2004, ApJS, 154, 18
- Ita et al. (2004) Ita Y., Tanabé T., Matsunaga N., Nakajima Y., Nagashima C., Nagayama T., Kato D., Kurita M., Nagata T., Sato S., Tamura M., Nakaya H., Nakada Y., 2004, MNRAS, 353, 705
- Jørgensen et al. (2000) Jørgensen U. G., Hron J., Loidl R., 2000, A&A, 356, 253
- Kraemer et al. (2002) Kraemer K. E., Sloan G. C., Price S. D., Walker H. J., 2002, ApJS, 140, 389
- Lah et al. (2005) Lah P., Kiss L. L., Bedding T. R., 2005, MNRAS, 359, L42
- Le Bertre (1992) Le Bertre T., 1992, A&AS, 94, 377
- Loidl et al. (2001) Loidl R., Lançon A., Jørgensen U. G., 2001, A&A, 371, 1065
- Maeder (1992) Maeder A., 1992, A&A, 264, 105
- Marshall et al. (2004) Marshall J. R., van Loon J. T., Matsuura M., Wood P. R., Zijlstra A. A., Whitelock P. A., 2004, MNRAS, 355, 1348
- Matsuura et al. (2002b) Matsuura M., Yamamura I., Cami J., Onaka T., Murakami H., 2002b, A&A, 383, 972
- Matsuura et al. (2005) Matsuura M., Zijlstra A. A., van Loon J. T., Yamamura I., Markwick A. J., Whitelock P. A., Woods P. M., Marshall J. R., Feast M. W., Waters L. B. F. M., 2005, A&A, 434, 691
- Matsuura et al. (2002a) Matsuura M., Zijlstra A. A., van Loon J. T., Yamamura I., Markwick A. J., Woods P. M., Waters L. B. F. M., 2002a, ApJ, 580, L133
- Millar et al. (2001) Millar T. J., Flores J. R., Markwick A. J., 2001, MNRAS, 327, 1173
- Millar & Herbst (1994) Millar T. J., Herbst E., 1994, A&A, 288, 561
- Millar et al. (2000) Millar T. J., Herbst E., Bettens R. P. A., 2000, MNRAS, 316, 195
- Nishida et al. (2000) Nishida S., Tanabé T., Nakada Y., Matsumoto S., Sekiguchi K., Glass I. S., 2000, MNRAS, 313, 136
- Nuth et al. (1985) Nuth J. A., Moseley S. H., Silverberg R. F., Goebel J. H., Moore W. J., 1985, ApJ, 290, L41
- Ortiz et al. (2002) Ortiz R., Blommaert J. A. D. L., Copet E., Ganesh S., Habing H. J., Messineo M., Omont A., Schultheis M., Schuller F., 2002, A&A, 388, 279
- Ossenkopf et al. (1992) Ossenkopf V., Henning T., Mathis J. S., 1992, A&A, 261, 567
- Papoular et al. (1998) Papoular R., Cauchetier M., Begin S., Lecaer G., 1998, A&A, 329, 1035
- Reid (1991) Reid N., 1991, ApJ, 382, 143
- Reid et al. (1990) Reid N., Tinney C., Mould J., 1990, ApJ, 348, 98
- Romano et al. (2001) Romano D., Matteucci F., Ventura P., D’Antona F., 2001, A&A, 374, 646
- Sandin & Höfner (2003) Sandin C., Höfner S., 2003, A&A, 398, 253
- Sloan et al. (2006) Sloan G. C., Kraemer K. E., Matsuura M., Wood P. R., Price S. D., Egan M. P., 2006, ApJ, subm
- Sloan et al. (1998) Sloan G. C., Little-Marenin I. R., Price S. D., 1998, AJ, 115, 809
- Sloan et al. (2003) Sloan G. C., Nerenberg P. S., Russell M. R., 2003, IRS Technical Report 03001
- Speck et al. (1997) Speck A. K., Barlow M. J., Skinner C. J., 1997, MNRAS, 288, 431
- Speck et al. (2005) Speck A. K., Thompson G. D., Hofmeister A. M., 2005, ApJ, 634, 426
- Tanabé et al. (1997) Tanabé T., Nishida S., Matsumoto S., Onaka T., Nakada Y., Soyano T., Ono T., Sekiguchi K., Glass I. S., 1997, Nature, 385, 509
- Tej et al. (2003) Tej A., Lançon A., Scholz M., Wood P. R., 2003, A&A, 412, 481
- Trams et al. (1999) Trams N. R., van Loon J. T., Waters L. B. F. M., Zijlstra A. A., Loup C., Whitelock P. A., Groenewegen M. A. T., Blommaert J. A. D. L., Siebenmorgen R., Heske A., Feast M. W., 1999, A&A, 346, 843
- Treffers & Cohen (1974) Treffers R., Cohen M., 1974, ApJ, 188, 545
- Tsuji (1984) Tsuji T., 1984, A&A, 134, 24
- van Loon et al. (1999a) van Loon J. T., Groenewegen M. A. T., de Koter A., Trams N. R., Waters L. B. F. M., Zijlstra A. A., Whitelock P. A., Loup C., 1999a, A&A, 351, 559
- van Loon et al. (2006) van Loon J. T., Marshall J. R., Matsuura M., Zijlstra A. A., Wood P. R., Cohen M., Yamamura I., 2006, A&A, in press
- van Loon et al. (2005a) van Loon J. T., Marshall J. R., Zijlstra A. A., 2005a, A&A, 442, 597
- van Loon et al. (2005b) van Loon J. T., Oliveira J. M., Wood P. R., Zijlstra A. A., Sloan G. C., Matsuura M., Whitelock P. A., Groenewegen M. A. T., Blommaert J. A. D. L., Cioni M.-R. L., Hony S., Loup C., Waters L. B. F. M., 2005b, MNRAS, 364, L71
- van Loon et al. (1999b) van Loon J. T., Zijlstra A. A., Groenewegen M. A. T., 1999b, A&A, 346, 805
- van Loon et al. (1997) van Loon J. T., Zijlstra A. A., Whitelock P. A., Waters L. B. F. M., Loup C., Trams N. R., 1997, A&A, 325, 585
- Volk et al. (2002) Volk K., Kwok S., Hrivnak B. J., Szczerba R., 2002, ApJ, 567, 412
- Volk et al. (2000) Volk K., Xiong G., Kwok S., 2000, ApJ, 530, 408
- Wainscoat et al. (1992) Wainscoat R. J., Cohen M., Volk K., Walker H. J., Schwartz D. E., 1992, ApJS, 83, 111
- Wanajo et al. (2006) Wanajo S., Nomoto K., Iwamoto N., Ishimaru Y., Beers T. C., 2006, ApJ, 636, 842
- Werner et al. (2004) Werner M. W., Roellig T. L., Low F. J., Rieke G. H., Rieke M., et al. 2004, ApJS, 154, 1
- Whitelock et al. (2003) Whitelock P. A., Feast M. W., van Loon J. T., Zijlstra A. A., 2003, MNRAS, 342, 86
- Will et al. (1995) Will J.-M., Bomans D. J., Tucholke H.-J., de Boer K. S., Grebel E. K., Richtler T., Seggewiss W., Vallenari A., 1995, A&AS, 112, 367
- Willacy & Millar (1997) Willacy K., Millar T. J., 1997, A&A, 324, 237
- Willems (1988) Willems F. J., 1988, A&A, 203, 51
- Wood (1981) Wood P. R., 1981, in ASSL Vol. 88: Physical Processes in Red Giants. p 135
- Wood (1998) Wood P. R., 1998, A&A, 338, 592
- Wood et al. (1983) Wood P. R., Bessell M. S., Fox M. W., 1983, ApJ, 272, 99
- Zijlstra (2004) Zijlstra A. A., 2004, MNRAS, 348, L23
- Zijlstra et al. (1996) Zijlstra A. A., Loup C., Waters L. B. F. M., Whitelock P. A., van Loon J. T., Guglielmo F., 1996, MNRAS, 279, 32