The Size of the Cooling Region of Hot Gas in Two Elliptical Galaxies
Abstract
Some early-type galaxies show O VI emission, a tracer of gas at 105.5 K, and a predicted product of gas cooling from the X-ray emitting temperatures. We studied the spatial extent and velocity structure of this cooling gas by obtaining spectra of the O VI doublet in NGC 4636 and NGC 5846 with the Far Ultraviolet Spectroscopic Explorer. For NGC 4636, the central LWRS pointing shows that the O VI lines are double-peaked and symmetrical about the systemic velocity of the galaxy, with a separation of 210 km s-1. A LWRS observation 30″ from the center failed to show additional O VI emission. For NGC 5846, three spectra were obtained with 4″ 20″ apertures (MDRS) at the center and 4″ to the east and west of the center. The O VI line flux seen in the previous LWRS is contained in the sum of the smaller apertures, with most of the flux in a single non-central MDRS aperture, suggesting a size for the emission 0.5 kpc; the emission consists of a blue and red peak. For both galaxies, the O VI velocity structure is similar to that of the optical [NII] emission and is consistent with rotation. The compactness and velocity structure of the O VI emission rules out cooling flow models with broadly distributed mass drop-out but is consistent with cooling flow models where the cooling occurs primarily in the central region. The 104 K gas may be the end state of the O VI emitting gas.
1 Introduction
Most early-type galaxies have hot X-ray emitting gas, and from the density and temperature of the gas (107 K), the cooling time is much less than a Hubble time in the central 10 kpc (review in Mathews & Brighenti 2003). The X-ray observations led investigators to develop a model where the gas cools into neutral or warm ionized material, possibly forming stars as the endpoint of the process. This cooling flow model of early-type galaxies has met with mixed success. On one hand, the mass loss from the stars is observed directly (Athey et al., 2002), and at least some of this mass loss thermalizes and becomes the hot X-ray emitting gas. It was expected that the gas would radiatively cool yet the expected multi-temperature gas is not seen at X-ray wavelengths (Xu et al., 2002). However, from ultraviolet line emission studies, and in particular O VI, there is evidence for gas having cooled below the temperature of the ambient hot medium (Bregman, Miller, & Irwin, 2001). We analyzed a sample of 24 nearby early-type galaxies for their X-ray emission as well as their O VI emission (using the Far Ultraviolet Spectroscopic Explorer) and found that more than a third of the galaxies had O VI emission (Bregman et al., 2005). The O VI ion has an ionization potential of 113.9 eV, making it difficult to produce through photoionization. It is almost certainly ionized by collisional processes and it is only common at gas temperatures near 105.5 K, about a factor of 30 below the temperature of the ambient medium.
Models suggest that as the gas radiatively cools, it can undergo thermal instabilities and the nature of the instabilities determines where the gas cools within the galaxy. Initially, it was thought that thermal instabilities would grow over a wide range of radii (e.g., Mathews & Bregman 1978) but subsequent calculations showed that the inflow of the gas suppresses the growth rate of radial modes, although the instability can occur for some non-radial modes and modes involving imbedded magnetic fields (Balbus, 1988; Balbus & Soker, 1989; Balbus, 1991). If the growth of thermal instabilities is supressed, the gas will cool primarily in the central region of the galaxies. If enough thermal instabilities can grow, or if nonlinear perturbations are present, caused by processes such as the mass loss around individual stars, the cooling of the X-ray emitting gas may be more distributed.
The distribution of the cooling gas can be parameterized within hydrodynamic models, such as the time-independent models of Sarazin & Ashe (1989), where the local mass dropout rate (the conversion of hot to cool gas that no longer contributes significantly to buoyancy) is . In this parameterization, corresponds to no mass drop-out, to a mass loss rate given by the instantaneous cooling time, and to a more rapid rate of cooling and mass drop-out. The weak growth of thermal instabilities would suggest a value for near zero, while efficient thermal instability growth (linear and non-linear perturbations) would correspond to q of unity. The different choices of lead to different X-ray surface brightness profiles and luminosities, with low values of leading to higher total X-ray luminosities and more sharply peaked X-ray profiles. Based on the observations at that time, Sarazin & Ashe (1989) argued for models where rather than low values.
The value of affects both the spatial distribution of the cooling gas as well as its velocity, with low values of corresponding to larger flow velocities to satisfy the mass conservation equation. At a radius of 0.5 kpc, the inflow velocities are 15 km s-1 for and 40 km s-1 for (Sarazin & Ashe, 1989). Whereas such velocities cannot be observed with current X-ray instrumentation, it is accessible through observations of the O VI 1032,1038 lines, where the resolution of FUSE is 15 km s-1. Therefore, we have used FUSE to examine both the line width and spatial distribution of the O VI line for two early-type galaxies that we detected in our larger survey, NGC 4636 and NGC 5846. Previously we used a Hubble constant of 50 km s-1 Mpc-1 and the velocity distance given by Faber et al. (1989), leading to a distance for NGC 4636 of 26.7 Mpc. A more recent distance determination is given by Tonry et al. (2001), where d = 14.7 Mpc for NGC 4636, although Dirsch, Schuberth, & Richtler (2005) argue for a distance of 17.7 Mpc based on their globular cluster data; here we adopt a distance of 16 Mpc. For NGC 5846, we use the distance of 24.9 Mpc obtained by Tonry et al. (2001).
2 Central and Off-Center FUSE Observations of NGC 4636
2.1 Observations
The first observation, of the central region of NGC 4636 with the large square aperture (LWRS; 30″ square; equivalent in area to a circle of 17″ radius), was discussed by Bregman, Miller, & Irwin (2001), who reported detections of both the strong and weak line that were narrow. Since that time, the pipeline data processing has improved and led to some changes in the spectrum. Originally a wavelength shift needed to be introduced in order for the Galactic absorption lines to occur at the correct wavelengths, but with the newer data reduction (versions 2.4 and later of CALFUSE give the same results), the shift is less than 0.1 Å (30 km s-1), which is about as well as we can measure the lines in this data set. Also, in Bregman, Miller, & Irwin (2001), both O VI lines were single-peaked, with the peaks differing in redshift from the galaxy by about 120 km s-1. With the more recent reduction, which corrects more precisely for the background, the lines are double-peaked (Figure 1), with the galaxy redshift lying exactly between the two peaks. Each of the peaks is relatively narrow, with the strongest feature (the red peak of the stronger line) being about 0.25 Å wide FWHM (75 km s-1); the weaker features are all about 0.1-0.15 Å wide (all velocities, velocity widths, and line strengths are measured from the unsmoothed data). The separation of the two peaks for the strong line is about 210 km s-1, and this is about the same for the weaker O VI 1038 line. Also, the line flux for the strong line is about twice that of the weak line, which is the expected ratio when this doublet is optically thin. The flux for the 1032 line is 4.010-15 erg cm-2 s-1 (20% uncertainty, mainly due to the placement of the continuum) and for the 1038 line it is 2.5 times 10-15 erg cm-2 s-1 with similar uncertainty. The line centers are at 1035.07 Å and 1040.85 Å, or redshifts of 910 km s-1 and 933 km s-1 (uncertainties of 20 km s-1), which are indistinguishable from the stellar redshift of the galaxy, 938 km s-1.
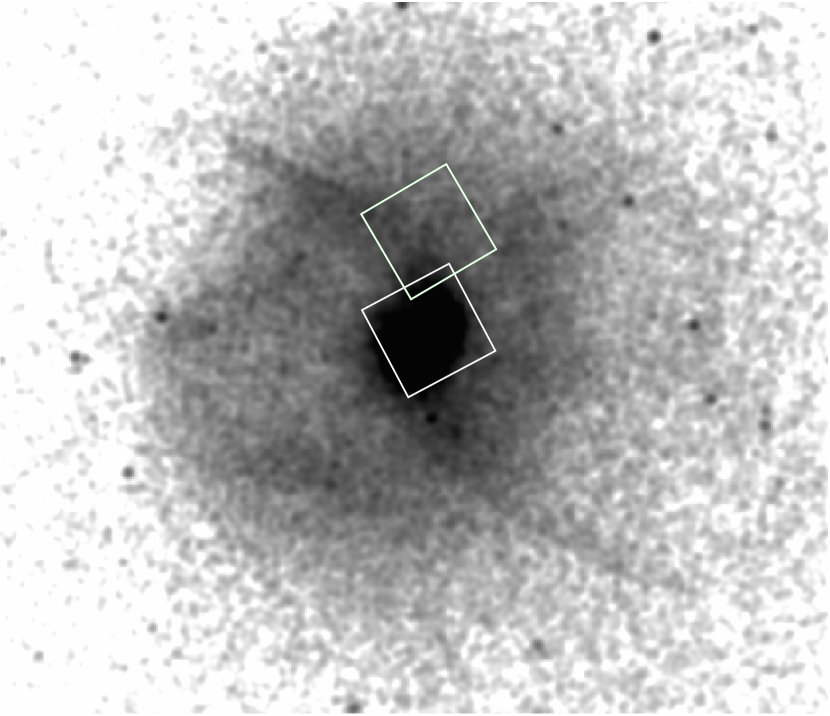
We obtained an off-center pointing with the LWRS for 15.4 ksec in which 13.1 ksec occurred during night, more than twice the observing time of the central pointing. The large aperture was placed 30″ away from the center so that the central pointing and the off-center pointing were adjacent, aside from a slight shift in the position angle (Figure 2). This pointing includes emission from r = 1-3 kpc (15-45″). No spectral features were detected (Figure 3). It was expected that the continuum of the galaxy would be too faint to detect, given optical surface brightness distribution and the instrumental sensitivity. Formally, the flux for the stronger O VI 1032 line is 0.310-16 510-16 erg cm-2 s-1, so the 3 upper limit is 1.510-15 erg cm-2 s-1.
2.2 Interpretation
The lack of extended O VI emission constrains a cooling model of . In the cooling prescription given above with q near unity, the cooling rate within an aperture is proportional to the integral of the surface brightness within the aperture. The mean X-ray surface brightness within the off-center aperture is 0.28 times that of the aperture located at the central region (based on Chandra data with point sources subtracted; Athey, Bregman, and Irwin 2005), so the predicted line strength would have been F(1032) = 1.110-15 erg cm-2 s-1. This would have been a 2.2 detection had it been present, and as no line is detected, we rule out the presence of this line at the 98% confidence level. The failure to see this line at the off-center location is consistent with the cooling of the gas being centrally contained, which supports models with relatively little mass dropout (e.g., models are favored). In concluding that there is a lack of off-center emission, we have assumed that the single off-center pointing is representative of other azimuthal locations at the same radial distance from the center.
The narrow structures of the O VI emission lines also indicate that the emission line gas is smaller than the 30″ square LWRS aperture. If the line uniformly filled the aperture, the resolution of the instrument is reduced to 100 km s-1 FWHM (0.34 Å). Since we see O VI line features 0.1-0.25 Å wide, the emitting gas is smaller than the aperture, approximately by a factor of two. The observations are consistent with O VI gas lying within a radius of 10″.
Under the assumption that all of the O VI emission is contained in the central pointing, we can calculate a mass cooling rate. For an extinction of AB = 0.12 mag (Schlegel, Finkbeiner, & Davis, 1998) and A(1035 Å)/AV = 4.0 (Cardelli et al., 1989), the luminosity of the strong line is L(1032) = 1.71038 erg s-1. For the conversion from L(1032) to a mass cooling rate, we use the value discussed by Bregman, Miller, & Irwin (2001) (see Edgar & Chevalier 1986 and Voit, Donahue, & Slavin 1994), which leads to = 0.19 0.04 M⊙ yr-1. The cooling rate predicted from the Sarazin & Ashe (1989) model gives 0.87 M⊙ yr-1 if we use the X-ray luminosity from the entire galaxy and 0.48 M⊙ yr-1 if we use the X-ray luminosity from within Re = 101″ (). The mass loss rate from stars, based on theoretical stellar evolutionary models is 0.59 M⊙ yr-1 (see discussion in Athey et al. 2002), similar to the X-ray cooling rates but about three times the O VI cooling rate. These values are 2.5-4.6 times greater than the cooling rate inferred from the O VI observations. To reach consistency between the model and the observed values, either cooling flows are time dependent or most of the mass lost by stars does not enter the flow.
The presence of a symmetrical double-peaked line can be used to rule out spherically symmetric infall. For an infall model, an optically-thin spherical shell will have a box-like flat-topped profile that is twice the width of the infall velocity. If the emitting volume is approximated as a series of shells and with a radial velocity gradient, the emission line will be the sum of flat-topped profiles. A model such as this will never be double-peaked, so the O VI emission line data are inconsistent with spherically symmetric infall.
A rotating disk can produce a double-horned profile, and if such a structure were present in O VI gas, it might also be apparent in cooler emission line gas, in dust, or in the stellar surface brightness distribution. No central stellar disk is detected in the infrared from HST NICMOS observations (Ravindranath et al., 2001), and they do not confirm the faint irregular dust extinction features reported by van Dokkum & Franx (1995), for which the observations were obtained with the HST PC prior to the installation of COSTAR. Optical emission line studies using the H+[NII] lines (Buson et al., 1993; Zeilinger et al., 1996) detect 104 K line emission that is distributed over the inner 10″ radius region, similar to the size suggested from the O VI observations. The emission line gas is described as being ring-like because it has a central minimum but then radially decreases in surface brightness. Their long-slit spectra show lines with velocity dispersions of 100-200 km s-1 (greatest toward the center) and line centers that can vary by 100 km s-1 or more. The variation in the line center suggests to us rotation along several position angles (e.g., P.A. of 85°), so some of this gas appears to be participating in rotation. The velocity structure in the H+[NII] emission lines supports the interpretation that the double-horned profile in the O VI gas is due to rotation. The separation of the O VI emission peaks implies a projected rotational velocity of 105 km s-1, which would imply an inclination angle of 20°.
It seems reasonable to identify this 104 K gas as the end-product of the O VI emitting material. The radial distribution of the 104 K gas places it within the location of the O VI gas, and the velocity properties are similar. The size of the region with 104 K gas (700 pc) is larger than that inferred from the models (100 pc), a drawback to this interpretation. Also, the size of the 104 K gas is similar to the bright central region seen in X-rays. The mass of the 104 K gas is highly uncertain due to the unkown filling factor of the material.
3 Higher Spatial Resolution Observations of NGC 5846
3.1 Observations and Data Reduction
Since the emission from NGC 4636 seems to be centrally peaked, we had a program to map the central region of NGC 4636 with the medium aperture (MDRS; 4″ by 20″), which would also lead to more accurate line width information. Unfortunately, loss of a reaction wheel made scheduling of the observations impossible, so the galaxy NGC 5846 was observed instead. Although fainter in its O VI emission, it is a similar galaxy in that it lies in the center of its group and has optical emission line gas detected.
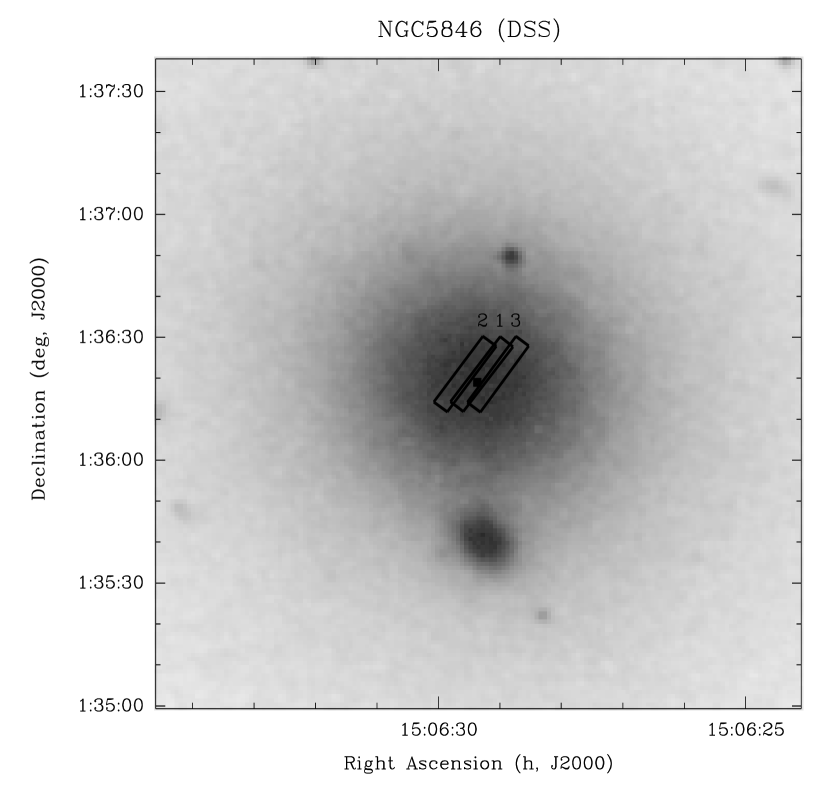
The FUSE observations of NGC 5846 (IDs C0640101, C0640201, and C0640301) were obtained 2004 April 5–6 with the MDRS aperture in timetag mode, with exposure times of 21.3, 19.8, and 20.6 ksec, respectively. The location of the apertures on NGC 5846 is shown in Figure 4, which have a slight overlap. The earlier central pointing with the large aperture was for 9.6 ksec and is reported upon in Bregman et al. (2005).
The data reduction and calibration was executed in two different ways in an effort to optimize the background subtraction and improve the resulting S/N. In the first method, we combined the exposures of detector segment LiF1A for each observation using the procedure TTAG_COMBINE before applying the CALFUSE pipeline (version 2.4) to each combined observation. We created both background subtracted and non-background subtracted spectra for day-plus-night and night-only observations.
In the second method, we applied only the first three steps of the pipeline on each individual exposure (i.e. initializing the header and computing the Doppler correction). We then extracted a rectangular region around the O VI emitting region in the MDRS spectrum and collapsed the extracted region perpendicular the wavelength dispersion axis to obtain a one-dimensional spectrum for each exposure. In the case of background subtraction, we extracted a rectangular region above and below the MDRS aperture and subtracted the one-dimensional, smoothed average background spectrum from the corresponding MDRS spectrum. We used the positions of the five O I airglow lines (1027.431 Å, 1028.157 Å, 1039.230 Å, 1040.943 Å, and 1041.688 Å) surrounding the O VI doublet to derive possible offsets between the individual exposures. The spectra were then shifted by the corresponding amounts, before they were combined into one spectrum for each observation. The O I airglow lines in the combined spectra were fitted, and their positions yielded the linear wavelength solution for the small spectral region. For each observation, a day-plus-night and a night-only spectrum were extracted using pulse height limits 2–25. The derived wavelength solutions were adjusted to heliocentric wavelengths. An effective area of 26.5 cm2 was used to flux-calibrate the spectra.
3.2 Measurements
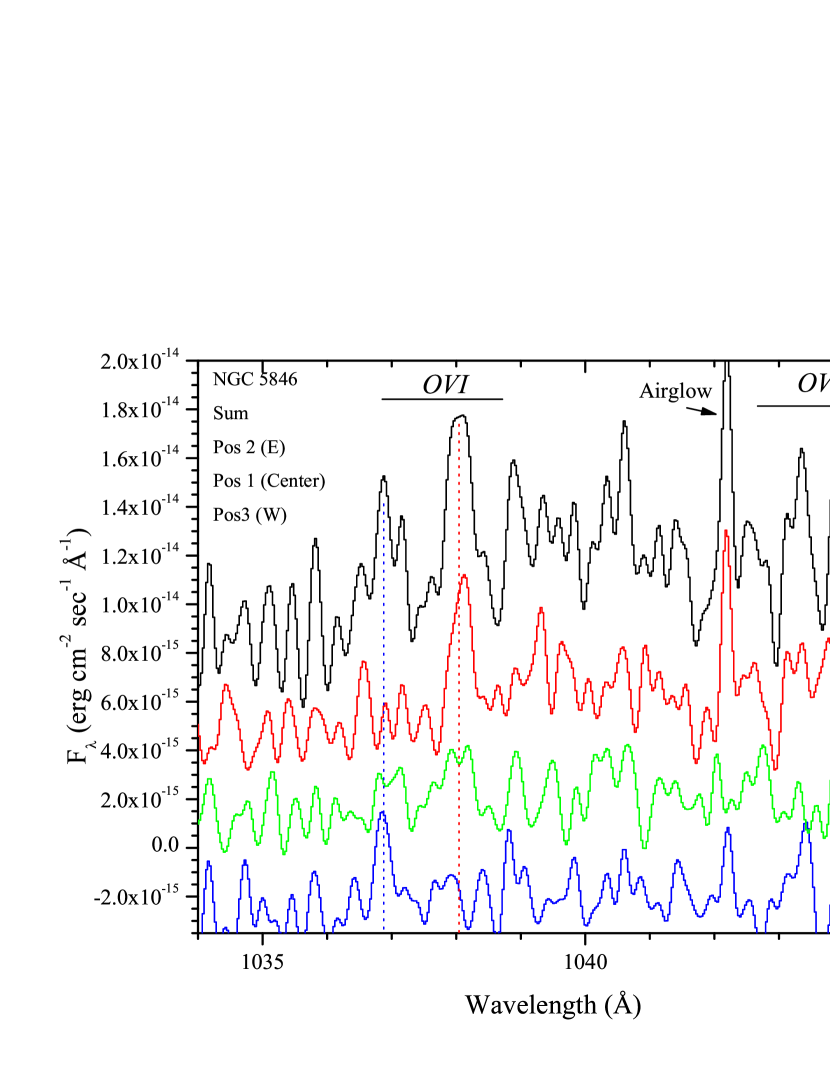
The resulting spectra were binned by 8 pixels to improve the signal-to-noise ratio. A comparison between the day-plus-night and night-only spectra and between background subtracted and non-background subtracted spectra revealed that the night-only spectra without background subtraction in general yielded the better signal-to-noise ratios, so we used these spectra for the analysis. The systemic velocity of NGC 5846 ( km s-1) shifts the O VI 1038 emission line just beyond the O I airglow lines into a region of scattered light on the detector. Since this emission line is intrinsically weaker than the 1032 emission line (up to a factor of two), the 1038 emission line became impossible to measure in the spectra in which O VI 1032 was detected (Figure 5).
The O VI 1032 emission line was fit in a variety of ways, with most of the uncertainty due to the placement of the continuum. We subtracted a linear fit to the continuum, which includes the background, to the region 1033-1042 Å, excluding the line region. Other approaches to the line extraction, such as using a constant to fit the continuum, or using the background-subtracted data provided by the FUSE pipeline did not lead to changes in the line widths or line centers, but could cause changes in the line fluxes of 20%. Gaussians were fit to the blue and red parts of the line, and the residuals are consistent with a normal distribution.
The red component of the redshifted O VI 1032 line has a line center at 1038.07 0.05 Å, a line width of 102 27 km s-1, and a flux of 2.6810-15 erg cm-2 s-1 0.6910-15 erg cm-2 s-1 (a 4 result). Nearly all of the flux from this line is due to position 2, and when the individual positions are analyzed separately, it is the only location with a signal above 3 (at 3.2). The contribution from position 1 is 2.2, and the contribution from position 3 is less than 1.
The weaker blue line only constitutes a 2.5 measurement, it has a line center at 1036.91 0.05 Å, a line width of 85 38 km s-1, and a flux of 1.5610-15 erg cm-2 s-1 0.6310-15 erg cm-2 s-1. Nearly all of the contribution to this feature is from position 3, while the fluxes added from locations 1 and 2 are not statistically significant. When adding both the blue and red components together, the total line flux is 4.2410-15 erg cm-2 s-1 0.9310-15 erg cm-2 s-1. Using the summed spectrum, the red line peak occurs at +6915 km s-1 from the systemic velocity of NGC 5846, while the blue line peaks at -26617 km s-1 relative to the galaxy.
From the spectra (Figure 5), there is the suggestion of a weakening of the red component and a strengthening of the blue component along the direction east to west. While this is similar to the structure of the optical [NII] emission (discussed further below; Plana et al. 1998), higher signal-to-noise data would be desirable to quantify this trend independently for the O VI line emission.
3.3 Interpretation
One of the goals is to determine the extent of the O VI emission and the other is to gain more information on the line width, especially in comparison to the observation taken with the large aperture. In analyzing the LWRS data (Bregman et al., 2005), we first note that if the O VI 1032 emission line were at the systemic velocity of NGC 5846, it would lie at 1037.8 Å. The width and structure of the line is difficult to determine because Galactic absorption lines modify the underlying line shape. The blue side is partly absorbed by the strong Galactic C II 1036.34 absorption line, while three Galactic H2 lines absorb the line at 1036.54 Å (on the blue side), at 1037.14 Å and at 1038.16 Å (the weakest of the three lines; on the red side of the O VI line; see Bregman et al. 2005). Nevertheless, the line appears to have a width of approximately 1 Å FWHM, or 330 km s-1 and a line flux of 3.010-15 erg cm-2 s-1 before the Galactic extinction correction. To within the uncertainties, the LWRS flux is the same as the line flux measured with the sum of the MDRS apertures, suggesting that the emission is relatively compact.
From the observations with the MDRS aperture, the line strength just at position 2 accounts for most of the total line emission, indicating that most of the emission falls within a small region, probably only a few arcseconds in radius and a few arcseconds away from the nucleus (4″ is 480 pc). This offset from the nucleus is much larger than the usual pointing uncertainty, so we have investigated the uncertainty in the optical positions. The optical position of NGC 5846 is based upon the Sloan Digitial Sky Survey calibration, which claims an accuracy of 0.5″ . We conclude that for unknown reasons, the peak in the O VI emission is offset from the nucleus.
We find that the O VI line centroids and widths are nearly consistent with what one would expect if the O VI gas and the 104 K gas had the same velocity field. The velocity field of the 104 K gas that was determined with a scanning Fabry-Perot instrument for the H and [NII] 6584 lines (Plana et al., 1998). They find that the [NII] 6584 emission is brightest in the nuclear region, decreasing in intensity so that it is no longer visible beyond 10-15″ from the center. The line emission is roughly symmetrical, there is a bit more flux to the east, which is the location of position 2 where we detected the strongest O VI emission. The velocity field of the 104 K gas shows a major axis from SE to NW (PA of 130°), along which the radial velocity changes from 1820 km s-1 in the SE to 1550 km s-1 in the NW (relative to the systemic velocity of 1714 km s-1, this is +105 km s-1 in the SE and -164 km s-1 in the NW). The O VI line width seen in the LWRS observations would be representative of the total velocity range. The O VI line at position 2, which is redshifted from the systemic velocity of the galaxy by about 69 km s-1, is approximately the velocity one would expect from an aperture on the eastern side of the nucleus from the velocity field of Plana et al. (1998). Also, the range of velocities is only expected to be 50–100 km s-1, similar to the observed line width. The O VI emission from position 3 (and the blue component of position 1) is blueshifted from the systemic velocity, as is the [NII] gas, but it is more blueshifted than the [NII] gas by about 100 km s-1. This additional blueshift may occur because one of the H2 lines absorbs some emission (at 1037.1 Å) or because there is infall. The O VI emission from the central location (position 1) is consistent with both blue and red emission components, as would be expected since the slit does not have the same position angle as the rotation axis.
To calculate the luminosity and mass cooling rate, we use an average of the MDRS and LWRS observations, or F(1032) = 3.610-15 erg cm-2 s-1. After correcting for the Galactic extinction of AB = 0.237 mag (Schlegel, Finkbeiner, & Davis, 1998), the flux is 7.110-15 erg cm-2 s-1 and the luminosity is 5.21038 erg s-1, or a mass cooling rate of 0.58 M⊙ yr-1. It is difficult to estimate the amount of the line removed by the various Galactic absorption lines, but it is unlikely to add more than 50% to the line luminosity. There is very little evidence for dust extinction within NGC 5846 (Verdoes Kleijn & de Zeeuw, 2005), so no corrections of this nature are applied.
The mass flux rate inferred from the X-ray data give values of 1.2 M⊙ yr-1 (0.81 M⊙ yr-1 within Re), or a factor of 1.4–2.1 above the cooling rate inferred from the O VI luminosity. Given the uncertainty in the O VI luminosity due to the error and a poorly known Galactic absorption line correction, as well as model uncertainties, the theoretical and observed cooling rates may be consistent with each other. The stellar mass loss rate for NGC 5846 is about 0.73 M⊙ yr-1 (Athey et al., 2002), similar to the O VI cooling rate. These data are consistent with a model where the mass lost from stars becomes thermalized and eventually cools to 104 K, producing O VI emission in the process.
4 Conclusions and Final Comments
The observations for both NGC 4636 and NGC 5846 indicate a size for the O VI emission line gas that is probably less than 10″ in NGC 4636 (0.8 kpc) and in the case of NGC 5846, is dominated by a region only 4″ in size (0.5 kpc). This compact size rules out cooling flow models where mass drop-out occurs over a range of radii throughout the galaxy (provided that these off–center pointings are representative of regions at these radii). Based on the model of Sarazin & Ashe (1989), the limits on the size of the O VI emission region, and the ratio of observed to predicted cooling rates, we can rule out for NGC 4636 and for NGC 5846. The line structure and line widths support this picture and suggest that the O VI emitting gas has either formed a rotating disk or is in the process of doing so.
The central regions of both galaxies are bright in diffuse X-ray emission, although as noted for NGC 4636, O VII emission is not detected at luminosities corresponding to similar values of the cooling rate (Xu et al., 2002). Also, our analysis of the XMM-Newton RGS spectrum of NGC 5846 does not show the O VII line either (in preparation). In order to reach consistency with the O VI emission line data, a turbulent mixing layer would need to occur that would move the gas quickly from its ambient temperature to below 7105 K (Slavin, Shull, & Begelman, 1993; Bregman et al., 2005).
At the rate that the gas is cooling, it cannot accumulate for more than 107–108 yr or a significant amount of neutral gas would be detectable as 21 cm emission, in conflict with upper limits (Roberts et al., 1991). Either this gas feeds a black hole, causing intermittent behavior of an active galactic nucleus, or the gas is consumed in star formation. Both galaxies have similar 1.4 GHz radio luminosities (21 mJy for NGC 5846 and 78 mJy for NGC 4636; Condon et al. 1998), which may suggest the presence of some type of AGN activity, and there may be evidence for an interaction between a radio jet and the hot ambient medium (Jones et al., 2002). Star formation, if present, has eluded previous efforts to detect it, but observations with the Spitzer observatory may prove more definitive.
References
- Athey et al. (2002) Athey, A., Bregman, J.N., Bregman, J.D., Temi, P., & Sauvage, M. 2002, ApJ, 571, 272
- Athey, Bregman, and Irwin (2005) Athey, A.E., Bregman, J.N., & Irwin, J.A. 2005, ApJS, submitted
- Balbus (1988) Balbus, S. A. 1988, ApJ, 328, 395
- Balbus (1991) Balbus, S. A. 1991, ApJ, 372, 25
- Balbus & Soker (1989) Balbus, S. A., & Soker, N. 1989, ApJ, 341, 611
- Bregman et al. (2005) Bregman, J.N., Miller, E.D., Athey, A.E., & Irwin, J.A. 2005, ApJ, submitted
- Bregman, Miller, & Irwin (2001) Bregman, J.N., Miller, E.D., & Irwin, J.A. 2001, ApJ, 553, L125
- Buson et al. (1993) Buson, L. M., et al. 1993, A&A, 280, 409
- Cardelli et al. (1989) Cardelli, J. A., Clayton, G. C., & Mathis, J. S. 1989, ApJ, 345, 245
- Condon et al. (1998) Condon, J. J., Cotton, W. D., Greisen, E. W., Yin, Q. F., Perley, R. A., Taylor, G. B., & Broderick, J. J. 1998, AJ, 115, 1693
- Dirsch, Schuberth, & Richtler (2005) Dirsch, B., Schuberth, Y., & Richtler, T. 2005, A&A, 433, 43
- Edgar & Chevalier (1986) Edgar, R.J., & Chevalier, R.A. 1986, 310, L27
- Faber et al. (1989) Faber, S. M., Wegner, G., Burstein, D., Davies, R. L., Dressler, A., Lynden-Bell, D., & Terlevich, R. J. 1989, ApJS, 69, 763 P., Gunn, J. E., & Tyson, J. A. 1996, AJ, 111, 174
- Jones et al. (2002) Jones, C., Forman, W., Vikhlinin, A., Markevitch, M., David, L., Warmflash, A., Murray, S., & Nulsen, P. E. J. 2002, ApJ, 567, L115
- Mathews & Bregman (1978) Mathews, W. G., & Bregman, J. N. 1978, ApJ, 224, 308
- Mathews & Brighenti (2003) Mathews, W.G., & Brighenti, F. 2003, ARA&A, 41, 191
- Plana et al. (1998) Plana, H., Boulesteix, J., Amram, P., Carignan, C., & Mendes de Oliveira, C. 1998, A&AS, 128, 75
- Ravindranath et al. (2001) Ravindranath, S., Ho, L. C., Peng, C. Y., Filippenko, A. V., & Sargent, W. L. W. 2001, AJ, 122, 653
- Roberts et al. (1991) Roberts, M.S., Hogg, D.E., Bregman, J.N., Forman, W.R., & Jones, C. 1991, ApJS, 75, 751
- Sarazin & Ashe (1989) Sarazin, C.L. & Ashe, G.A. 1989, ApJ, 345, 22
- Schlegel, Finkbeiner, & Davis (1998) Schlegel, D.J., Finkbeiner, D.P., & Davis, M. 1998, ApJ, 500, 525
- Slavin, Shull, & Begelman (1993) Slavin, J.D., Shull, J.M., & Begelman, M.C. 1993, ApJ, 407, 83
- Tonry et al. (2001) Tonry, J. L., Dressler, A., Blakeslee, J. P., Ajhar, E. A., Fletcher, A. B., Luppino, G. A., Metzger, M. R., & Moore, C. B. 2001, ApJ, 546, 681
- van Dokkum & Franx (1995) van Dokkum, P. G., & Franx, M. 1995, AJ, 110, 2027
- Verdoes Kleijn & de Zeeuw (2005) Verdoes Kleijn, G. A., & de Zeeuw, P. T. 2005, A&A, 435, 43
- Voit, Donahue, & Slavin (1994) Voit, G.M., Donahue, M., & Slavin, J.D. 1994, ApJS, 95, 87
- Xu et al. (2002) Xu, H., et al. 2002, ApJ, 579, 600
- Zeilinger et al. (1996) Zeilinger, W. W., et al. 1996, A&AS, 120, 257