Detection of CO+ in the nucleus of M82
Abstract
We present the detection of the reactive ion CO+ towards the prototypical starburst galaxy M 82. This is the first secure detection of this short-lived ion in an external galaxy. Values of [CO+]/[HCO+]0.04 are measured across the inner 650 pc of the nuclear disk of M 82. Such high values of the [CO+]/[HCO+] ratio had only been previously measured towards the atomic peak in the reflection nebula NGC 7023. This detection corroborates that the molecular gas reservoir in the M 82 disk is heavily affected by the UV radiation from the recently formed stars. Comparing the column densities measured in M 82 with those found in prototypical Galactic photon-dominated regions (PDRs), we need 20 clouds along the line of sight to explain our observations. We have completed our model of the molecular gas chemistry in the M 82 nucleus. Our PDR chemical model successfully explains the [CO+]/[HCO+] ratios measured in the M 82 nucleus but fails by one order of magnitude to explain the large measured CO+ column densities (1–41013 cm-2). We explore possible routes to reconcile the chemical model and the observations.
1 Introduction
M 82 is one of the nearest and brightest starburst galaxies. Located at a distance of 3.9 Mpc, and with a bolometric luminosity of 3.71010 L⊙, it has been extensively studied in many molecules. Several studies reveal that the starburst has heavily influenced the interstellar medium in M 82 by producing high UV and cosmic ray fluxes. Recent interferometric observations at millimeter wavelengths (García-Burillo et al., 2001) show that while the chemistry of the molecular gas in the disk-halo interface is dominated by shocks, the chemistry of the molecular gas in the M 82 disk seems to be dominated by the intense UV flux. García-Burillo et al. (2002) obtained a high-angular-resolution image showing widespread enhanced HCO abundance ([HCO]/[H13CO+]3.6) across the whole M 82 disk which was interpreted in terms of a giant PDR of 650 pc size. Fuente et al. 2005 (hereafter Paper I) observed a selected set of PDR tracers (CN,C2H,HOC+ and c-C3H2) in three positions across the M 82 disk. They measured [CN]/[HCN]5 in the inner 650 pc galaxy disk. This large value of the [CN]/[HCN] ratio is only reached in the most heavily exposed layers of a PDR to the UV radiation (Fuente et al., 1993; Fuente & Martín-Pintado, 1997; Sternberg & Dalgarno, 1995; Boger & Sternberg, 2005). Furthermore, we detected the HOC+ 10 line and obtained an [HCO+]/[HOC+] ratio of 40. Such a low [HCO+]/[HOC+] ratio is only expected in highly ionized molecular gas (X(e-)10-5) either by UV photons (PDRs) and/or X-rays (XDRs) (Fuente et al., 2003; Rizzo et al., 2003; Usero et al., 2004).
In this paper we report the CO+ detection in the nucleus of M 82. This is the first secure CO+ detection in an extragalactic object since previously it has only been tentatively detected towards the active galactic nucleus (AGN) Cygnus A (Fuente et al., 2000). CO+ is a reactive ion that can only survive in the highly ionized layers of photon-dominated and X-rays dominated regions (PDRs and XDRs) (see e.g. Sternberg & Dalgarno 1995). In our Galaxy, CO+ has only been detected in a handful of objects which are well known prototypical PDRs (NGC 7027 and M17 SW: Latter et al. 1993, Fuente et al. 2003; the Orion Bar: Störzer et al. 1995, Fuente et al. 2003; NGC 7023: Fuente & Martín-Pintado 1997, Fuente et al. 2003; Mon R2 and G29.96-0.02: Rizzo et al. 2003; S140 and NGC 2023: Savage & Ziurys 2004). In fact, CO+ may be the best molecular tracer of the outermost layers (Av2 mag) of PDRs. In contrast with other molecular PDR tracers like CN and HOC+, CO+ is exclusively formed in these layers by reactions of C+ with OH. The formation of the chemically related ion HOC+ is favored in this region but can also be formed at a smaller rate in molecular clouds. In addition to the CO+ detection, we present observations of the high excitation HCO+ 32, HOC+ 32 and the CH3OH 54 lines.
2 Observations and Results
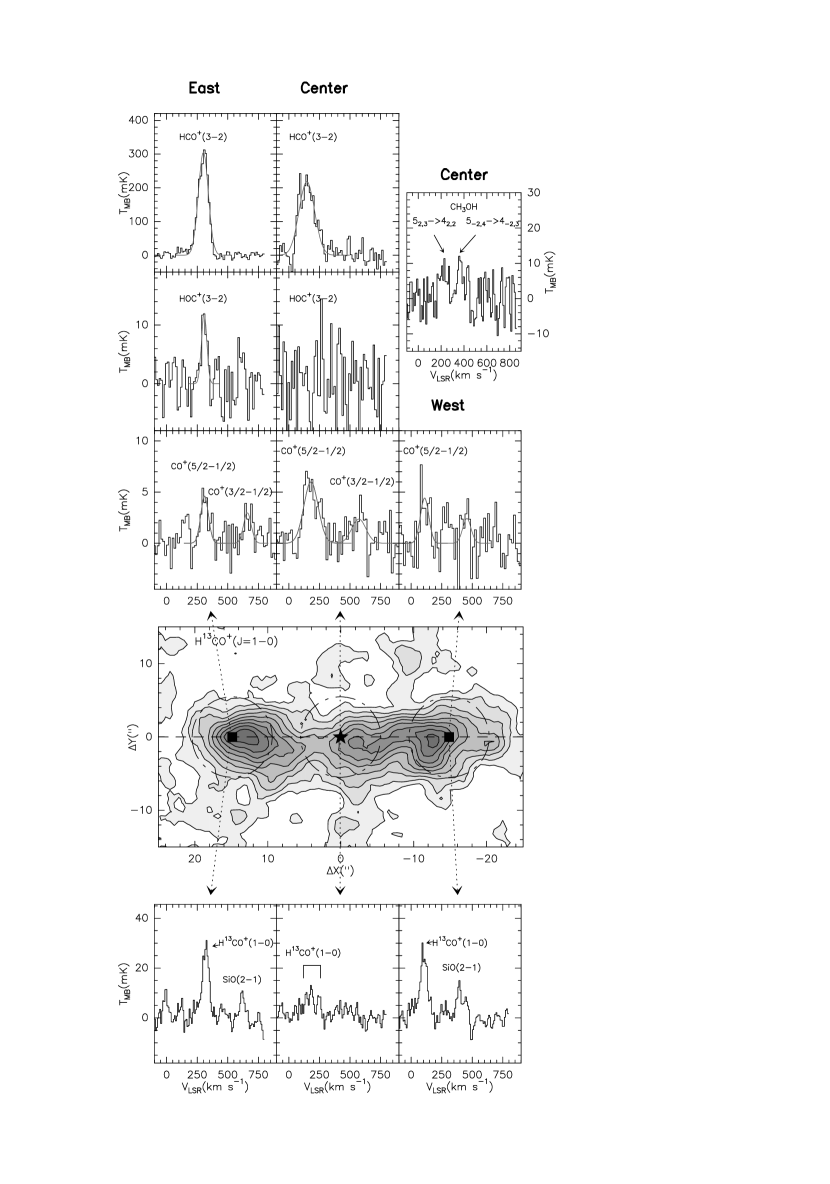
The observations were carried out in June and November 2004 with the IRAM 30m radiotelescope at Pico de Veleta (Spain). We used 2 SIS receivers tuned in single-sideband mode in the 1 mm band. The observed transitions are: HCO+ 32, HOC+ 32, CO+ N=21 J=5/23/2 and J=3/21/2, and CH3OH 5242 and 5-24-2 E . In Fig. 1 we present the observed spectra and the Gaussian fits are shown in Table 1. The intensity scale is main beam brightness temperature. The forward efficiency (), main-beam efficiency () and half-power beam width (HPBW) of the telescope are 0.91,0.52 and 11′′ at 235 GHz and 0.88, 0.46 and 9′′ at 260 GHz. Pointing was checked every two hours by observing a reference source. We observed three positions across the M 82 disk in the CO+ lines: the nucleus (RA(2000): 09h55m51.9s, Dec(2000): 69o04′47.11′′) (hereafter referred to as Center) and the two peaks in the HCO emission [offsets (14′′,5′′) and (14′′,5′′) hereafter referred to as E and W respectively]. Only E and Center were observed in the HCO+ 32 and HOC+ 32 lines. The HOC+ 32 line has been detected towards E. This detection constitutes a further corroboration of the HOC+ 10 detection reported in Paper I. The CH3OH line was only observed towards Center.
2.1 CO+ detection
CO+ has a 2 ground electronic state in which each rotational level is split into two fine-structure levels with J=N1/2. The N=10 rotational line is heavily obscured by the O2 line at 118 GHz and cannot be observed from ground-based telescopes. The most intense transitions of the N=21 rotational spectrum are J=5/23/2 at 236.062 GHz and J=3/21/2 at 235.789 GHz. Since they are very close in frequency, the two lines can be observed simultaneously. In the optically thin limit, the intensity ratio I(236.062)/I(235.789) is 1.8. The detection of the two lines with the expected intensity ratio provides supporting evidence of the reality of the CO+ detection.
The CO+ N=21 J=5/23/2 line has been detected towards E (4) and Center (8) and very tentatively (3) towards W. Furthermore, we have a 3 detection of the weakest component towards Center. The 236.062 GHz CO+ line is blended with the 5-2,44-2,3 and 52,342,2 E lines of 13CH3OH (at 236.062 and 236.063GHz respectively). To confirm the CO+ detection and estimate the possible contamination of the 13-methanol lines, we have observed towards Center the same transitions of the abundant isotope 12CH3OH and obtained TMB10 mK. Assuming a 12C/13C ratio 50 (Mao et al., 2000), the intensity of the CH3OH line should be 0.2 mK towards Center, i.e., at least a factor of 30 lower than the intensity observed in the CO+ spectrum. Therefore, we can conclude that the detected emission at 236.062 GHz corresponds to the J=3/21/2 line of CO+.
2.2 Column density ratios
The physical conditions of the molecular gas are estimated by fitting the intensities of the H13CO+ 10 and HCO+ 32 lines using an LVG code. For these calculations, we assume Tk=50 K (Weiß et al., 2001) and [HCO+]/[H13CO+]=89. The 12C/13C ratio in the M 82 nucleus is not well known. Mao et al. (2000) derived a 12C/13C ratio between 50 and 75 from multiline CO observations using an LVG code. However they obtained a larger value of the 12C/13C ratio when applying a PDR model to the same data. For consistency with Paper I, we adopt the canonical value [HCO+]/[H13CO+]=89. The derived molecular hydrogen densities are 3–8104 cm-3. These densities are in agreement with those derived from the CN and HCN lines in Paper I within the uncertainties inherent to this kind of calculations. Assuming these densities and an emission size of 6 for E, W and Center we obtain the H13CO+ and HOC+ column densities shown in Table 2. The size of the emission towards E, W and Center has been derived from the interferometric HCO and H13CO+ images published by García-Burillo et al. (2002) (see Fig. 1). To calculate the CO+ column density, we assume optically thin emission and use the Local Thermodynamic Equilibrium (LTE) approximation with Trot=10 K. This rotation temperature has been estimated using a LVG code applied to a linear molecule with the same dipole moment as CO+ and n(H2)=105 cm-3. Assuming a size of 6 for the CO+ emission we derive CO+ column densities 1–41013 cm-2 across the M 82 disk.
We can calculate the [HCO+]/[HOC+] ratio towards E using the HCO+ 32 and HOC+ 32 lines. Since both lines lie at the same frequency and have similar dipole moments, [HCO+]/[HOC+]I(HCO+ 32)/I(HOC+ 32) ratio. We obtain [HCO+]/[HOC+]48 in excellent agreement with our previous estimates (Paper I).
In Table 2 we compare the column density ratios in M 82 with those measured in some prototypical Galactic PDRs. The [CO+]/[HCO+] ratio is larger than 0.04 all across the M 82 disk. This is one of the largest values of the [CO+]/[HCO+] ratio measured thus far. Values of the [CO+]/[HCO+] ratio larger than 0.01 are only found towards the atomic peaks in prototypical Galactic PDRs, and such a high value of the [CO+]/[HCO+] ratio has only been measured in the most exposed layers of the PDR associated with the reflection nebula NGC 7023. This result is consistent with the values of the [HCO+]/[HOC+] and [CN]/[HCN] ratios previously measured in the M 82 disk (Paper I). We estimated [HCO+]/[HOC+]40 and [CN]/[HCN]5 across the M 82 nucleus. These values are also similar to those measured in the PDR peak towards NGC 7023. The very favorable geometry of the PDR associated with this reflection nebula allowed us to detect the outermost layers of the PDR (Fuente et al., 1993, 1996a). Our observations suggest that the bulk of the dense molecular gas in M 82 is surviving in a similar environment to that found in the HI/H2 transition layer of this photon-dominated region.
We can also compare the CO+, HOC+ and CN column densities in M 82 with those derived in Galactic PDRs, although the derived column densities are more uncertain than the column density ratios since the former depend on the assumed beam filling factor. In Galactic PDRs, the CO+ column densities are quite uniform taking a value of 1012 cm-2 in all star forming regions regardless of the incident UV field in a range of 3 orders of magnitude. Furthermore, the [CO+] /[HOC+] ratio is 0.5–9 (Rizzo et al., 2003; Savage & Ziurys, 2004). The [CO+]/[HOC+] ratio measured in M 82 is similar to those found in the PDRs associated with star forming regions in our Galaxy (see Table 2). This suggests a similar CO+/HCO+/HOC+ chemistry and a similar origin for the reactive ions. Since the CO+ column density is a factor 20-40 larger in M 82 than in Galactic PDRs, we need about 20-40 PDRs along the line of sight to account for our observations. In the scenario of clouds immersed in a pervasive UV field, this implies about 10–20 clouds along the line of sight which is a reasonable number for an edge-on galaxy.
3 Chemical Model
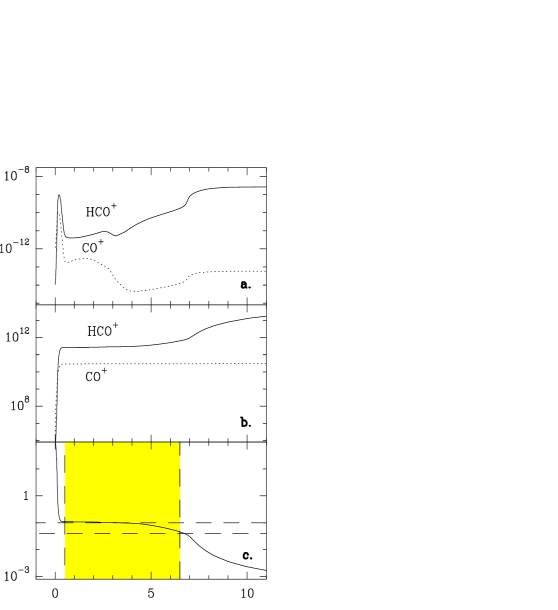
To have a deeper insight into the physics and chemistry of the molecular clouds in M 82, we have modeled their chemistry using the PDR Le Bourlot’s semi-infinite plane parallel model (Le Bourlot et al. 1993) and the same physical conditions as in Paper I: G0=104 in units of Habing field, n=nH+2n=4105 cm-3 and a cosmic ray flux of 410-15 s-1. As discussed in Paper I, this model explains with reasonable success all the molecular abundances observed in M 82 and should therefore account for our CO+ detection.
The model results for CO+ and HCO+ are shown in Fig. 2. The N(CO+)/N(HCO+) ratio (hereafter ) is very high (0.1) for Av0.5 mag. Then, remains constant and equal to 0.1 until Av5 mag. This is because in this range of visual extinction, 0.5Av4.5 mag, is determined by the CO+ and HCO+ abundances in the most external layers (Av1 mag) of the PDR. For higher extinctions, decreases because of the rapid increase of the HCO+ abundance. In our plane-parallel model, the values of observed across the M 82 nucleus (0.04) are found only for Av6.5 mag (see Fig. 2). In an external galaxy, one does not expect to have a single PDR but a population of clouds (or cloudlets) immersed in an intense UV field (Paper I, García-Burillo et al. 2002). In this scenario, our model results imply that the individual cloudlets have Ntot1.3 1022 cm-2. Thus, our CO+ observations corroborate the scenario for the M 82 nucleus proposed in Paper I of a highly fragmented interstellar medium in which the dense cores (n4105 cm-3, Ntot1.31022 cm-2 ) are bathed by an intense UV field (G0=104 Habing fields).
Thus far, we have only compared the observed and model predicted molecular column density ratios. We can also compare the molecular column densities. The predicted CO+ column density is 31010 cm-2 for Av=6.5 mag. This value is a factor of 20–40 lower than the CO+ column densities observed in the prototypical Galactic PDRs. Furthermore it is 3 orders of magnitude lower than the CO+ column densities measured in M 82 and an unrealistic large number of PDRs along the line of sight would be required to explain our CO+ observations. To have a deeper insight into the cause of this discrepancy between theoretical predictions and the observations, we have also compared the predicted CN column densities with the observed ones (see Table 1). Like CO+, CN is a good tracer of PDRs and can be used to estimate the number of PDRs along the line of sight. Our model predicts N(CN)1.51014 cm-2 for Av6.5 mag. This value agrees within a factor of 2 with those observed in prototypical Galactic PDRs like the Orion Bar and NGC 7023. Comparing with the CN column densities observed in the M 82 nucleus, we need about 20-40 individual cloudlets along the line of sight to account for our observations (see also Boger & Sternberg 2005). This is a reasonable number of cloudlets for an edge-on galaxy. Thus, there is a reasonable agreement between model predictions and observations for CN in both, Galactic and extra-galactic PDRs. However, the chemical model falls short by more than one order of magnitude of accounting for the CO+ column densities measured in Galactic PDRs and the M 82 nucleus.
The failure of chemical models to account for the observed reactive ions column densities is a long standing problem (Black, 1998; Fuente et al., 2000). The chemistry of reactive ions is very sensitive to the gas physical conditions in the HI/H2 transition layer. In particular, CO+ is mainly produced via the reaction C++OHCO++H. The production of OH is very dependent on the temperature as O+H2 may come into play at the H/H2 transition region when H2 is abundant and the temperature is still a few hundred K. The corresponding endothermicity is about 3000 K. An increase in the gas kinetic temperature in the HI/H2 interface could have a dramatic effect in the CO+ production.
There are several observational evidences that suggest that chemical models fail to predict the gas kinetic temperature in the HI/H2 region. One of the best studied PDRs is the Orion Bar, which is the paradigm of a Galactic PDR associated to an HII region. Observations of the H2 rotational lines in the Orion Bar by Parmar et al. (1991) revealed the existence of unexpectedly large amounts of warm gas (T400-700 K). They proposed that clumpiness could help to reconcile the observations with chemical models. Recently, Allers et al. (2005) proposed that the dust FUV attenuation cross sections should be reduced by a factor of 3 in order to explain the separation between the ionization front and the H2 emission peak in the Orion Bar. In order to explain the intensities of the H2 ro-vibrational lines they need to re-adjust the photoelectric heating rate. A change in the size distribution of the grains and/or the photoelectric heating rate would produce large variations in the thermal balance of the PDR.
References
- Allers et al. (2005) Allers K.N., Jaffe D.T., Lacy J.H., Draine B.T., Richter M.J., 2005, ApJ 630, 368
- Black (1998) Black, J.H., 1998, Faraday Discuss., 109, 257
- Boger & Sternberg (2005) Boger G.I. & Sternberg A., 2005, ApJ 632, 302
- Fuente et al. (1993) Fuente, A., Martín-Pintado, J., Cernicharo, J., & Bachiller, R. 1993, A&A, 276, 473
- Fuente et al. (1996a) Fuente, A., Martín-Pintado, J., Neri, R., Rogers, C., & Moriarty-Schieven, G. 1996a, A&A, 310, 286
- Fuente et al. (1996b) Fuente, A., Rodríguez-Franco, A., & Martín-Pintado, J. 1996b, A&A, 312, 599
- Fuente & Martín-Pintado (1997) Fuente, A., & Martín-Pintado, J. 1997, ApJ, 477, L107
- Fuente et al. (2000) Fuente, A., Black, J. H., Martín-Pintado, J., Rodríguez-Franco, A., García-Burillo, S., Planesas, P., & Lindholm, J. 2000, ApJ, 545, L113
- Fuente et al. (2003) Fuente, A., Rodríguez-Franco, A., García-Burillo, S., Martín-Pintado, J., & Black, J. H. 2003, A&A, 406, 899
- Fuente et al. (2005) Fuente, A., García-Burillo, S., Gerin, M., Teyssier, D., Usero, A., Rizzo, J. R., & de Vicente, P. 2005, ApJ, 619, L155 (Paper I)
- García-Burillo et al. (2001) García-Burillo, S., Martín-Pintado, J., Fuente, A., & Neri, R. 2001, ApJ, 563, L27
- García-Burillo et al. (2002) García-Burillo, S., Martín-Pintado, J., Fuente, A., Usero, A., & Neri, R. 2002, ApJ, 575, L55
- Latter et al. (1993) Latter, W. B., Walker, C. K., & Maloney, P. R. 1993, ApJ, 419, L97
- Le Bourlot et al. (1993) Le Bourlot, J., Pineau des Forets, G., Roueff, E., & Flower, D. R. 1993, A&A, 267, 233
- Mao et al. (2000) Mao, R. Q., Henkel, C., Schulz, A., Zielinsky, M., Mauersberger, R., Störzer, H., Wilson, T. L., & Gensheimer, P. 2000, A&A, 358, 433
- Parmar et al. (1991) Parmar, P. S., Lacy, J. H., & Achtermann, J. M. 1991, ApJL, 372, L25
- Rizzo et al. (2003) Rizzo, J. R., Fuente, A., Rodríguez-Franco, A., & García-Burillo, S. 2003, ApJ, 597, L153
- Savage & Ziurys (2004) Savage, C., & Ziurys, L. M. 2004, ApJ, 616, 966
- Sternberg & Dalgarno (1995) Sternberg, A., & Dalgarno, A. 1995, ApJS, 99, 565
- Störzer et al. (1995) Störzer, H., Stutzki, J., & Sternberg, A. 1995, A&A, 296, L9
- Suchkov et al. (1993) Suchkov, A., Allen, R. J., & Heckman, T. M. 1993, ApJ, 413, 542
- Usero et al. (2004) Usero, A., García-Burillo, S., Fuente, A., Martín-Pintado, J., & Rodríguez-Fernández, N. J. 2004, A&A, 419, 897
- Weiß et al. (2001) Weiß, A., Neininger, N., Henkel, C., Stutzki, J., & Klein, U. 2001, ApJL, 554, L143
- Wolfire et al. (1990) Wolfire, M. G., Tielens, A. G. G. M., & Hollenbach, D. 1990, ApJ, 358, 116
| Rest Freq.a | TMB | tint | ||||
| Molecule | (MHz) | (K km s-1) | (km s-1) | (km s-1) | (mK) | (min) |
| E. (+14,+5) | ||||||
| CO+ J=5/23/2 | 236062.55 | 0.36(0.08) | 311(8) | 74(19) | 4.6 | 695 |
| HCO+ J=32 | 267557.00 | 31.33(0.45) | 301(1) | 96(2) | 304.7 | 127 |
| HOC+ J=32 | 268451.00 | 0.65(0.13) | 307(5) | 51(12) | 12.0 | 125 |
| H13CO+a J=10 | 86754.33 | 2.05(0.15) | 320(2) | 66(6) | 29.0 | |
| Center (0,0) | ||||||
| CO+ J=5/23/2 | 236062.55 | 0.88(0.11) | 181(9) | 137(19) | 6.0 | 340 |
| CO+ J=3/21/2 | 235789.64 | 0.34(0.09) | 137b | 2.4 | 340 | |
| HCO+ J=32 | 267557.00 | 34.66(1.52) | 147(4) | 149(7) | 218.1 | 12 |
| HOC+ J=32 | 268451.00 | 0.34c K km s-1 | 190 | |||
| H13CO+a J=10 | 86754.33 | 1.21(0.13) | 171(8) | 140(18) | 8.1 | |
| CH3OH Jk=52,342,2d | 241904.63 | 0.92( 0.27) | 222(13) | 85(27) | 10.0 | 70 |
| W. (-14,-5) | ||||||
| CO+ J=5/23/2 | 236062.55 | 0.38(0.10) | 111(8) | 81(21) | 4.4 | 390 |
| H13CO+a J=10 | 86754.33 | 1.94(0.15) | 103(3) | 73(7) | 24.8 | |
a Spectra obtained from the interferometric H13CO+ image reported by (García-Burillo et al., 2001) by convolving to a Gaussian resolution of HPBW=11”.
bGaussian fit obtained by fixing the velocity and linewidth.
c3 limit with v=50 km s-1
d The line Jk=5-2,44-2,3 at 241904.15 MHz is overlapped with this.
| Molecule | M821 | Orion Bar2 | NGC 70233 | Mon R24 | ||
|---|---|---|---|---|---|---|
| E. | (0,0) | W. | IF | PDR peak | IF | |
| N(CN) | 6.31015 | 8.81015 | 1.11016 | 2.41014 | 2.41014 | |
| N(CO+) | 1.51013 | 3.71013 | 1.61013 | 8.01011 | 1.61012 | 4.41012 |
| N(HOC+) | 2.51013 | 4.31013 | 2.51013 | 4.01011 | 1.31011 | 1.41012 |
| CN/HCN | 6 | 8 | 7 | 3 | 4–8 | … |
| HCO+/HOC+ | 44 | 36 | 30 | 166 | 50–120 | 460 |
| CO+/HCO+ | 0.04 | 0.1 | 0.04 | 0.01 | 0.01–0.11 | 0.005 |
1 Assuming a size of 6 and data from Paper I and this paper.
2 Assuming that the bar fills half of the beam and data from Fuente et al. (1993,1996b).
3 Assuming a filament of 6 and data from Fuente et al. (1993,2003).
4 Assuming the size of the radio continuum emission at 6 cm, 10, and data from Rizzo et al.(2003).