Oscillations of starless cores
Abstract
If the split, asymmetric molecular spectral line profiles that are seen in many starless cores are interpreted as indicative of global collapse or expansion of the core then one possible implication is that most starless cores have short lifetimes on the order of the collapse or sound crossing time scale. An alternative interpretation of the line profiles as indicative of perturbations on an underlying equilibrium structure leads to the opposite implication, that many cores have long lifetimes. While evidence suggests that some cores are collapsing on a free-fall time scale, we show that observations of some other starless cores can be reproduced by a model of non-radial oscillations about the equilibrium configuration of a pressure-bounded, thermally-supported sphere (Bonnor-Ebert sphere). We model the oscillations as linear perturbations following a standard analysis developed for stellar pulsations and compare the column densities and molecular spectral line profiles predicted from a particular model to observations of the Bok globule B68.
Introduction
Observations of starless cores such as the Bok globule Barnard 68 (B68) suggest that these isolated, small, dark, molecular clouds are well described as discrete, self-gravitating, dynamical entities with an approximate internal balance of thermal and gravitational forces (Bok, 1948; Alves, Lada, & Lada, 2001; Keto & Field, 2005; Tafalla et al., 2004). In particular, although most of the cores are elliptical or otherwise not strictly spherical, their internal density structure is reasonably approximated by that of a hydrostatically supported sphere confined by an external pressure. In the isothermal case, these spheres are generally referred to as Bonnor-Ebert (BE) spheres which are described by a truncated solution of the Lane-Emden equation (Bonnor, 1956), the same equation used to describe the internal density structure of stars (Chandrasekhar, 1939). The column density through the B68 core, derived from observations of dust extinction (Alves, Lada, & Lada, 2001) azimuthally averaged, shows a remarkable correspondence with that predicted by the Lane-Emden equation.
Many, but not all, starless cores show non-Gaussian spectral line profiles indicating gas velocities within the core typically at a fraction of the sound speed (Zhou et al., 1994; Wang et al., 1995; Gregersen et al., 1997; Launhardt et al., 1998; Gregersen & Evans, 2000; Lee, Myers, & Tafalla, 1999, 2001; Lada et al., 2003; Lee, Myers, & Plume, 2004; Redman et al., 2004, 2006). Many cores have spectral lines with a characteristic split, asymmetric profile that can be interpreted as indicating global collapse or expansion depending on the sense of the asymmetry. The B68 core is also observed to have split asymmetric spectral line profiles but in a pattern suggestive of both inward and outward motions in different sectors of the cloud, reminiscent of the small-amplitude pulsations observed in stars (Lada et al., 2003; Cox, 1980). In the theory of stellar structure, such pulsations are described as perturbations on the equilibrium solution of the Lane-Emden equation (Cox, 1980). Here we explore the possibility that the velocity structure of the starless cores such as B68 may be due to perturbations from oscillations about the equilibrium configuration of a Bonnor-Ebert sphere.
We model one particular realization of non-radial oscillations chosen to match observations of the dust extinction and molecular spectral line observations of B68. We find that non-radial density perturbations due to oscillations can produce elliptical shapes as are often seen in continuum observations of dust emission and extinction from starless cores (Ward-Thompson, Motte, & Andre, 1999; Bacmann et al., 2000; Alves, Lada, & Lada, 2001). The rich variety of possible perturbed velocity fields due to oscillations is capable of producing a variety of spectral line profiles and velocity patterns that match the split asymmetric spectral line profiles characteristic of many starless cores. Thus non-spherical shapes and complex spectral line profiles can be found in model cores that although perturbed are still in equilibrium.
The possibility that models of clouds in perturbed equilibrium can have shapes and spectral line profiles similar to those of non-equilibrium models of global expansion or collapse introduces some ambiguity into the interpretation of observations of starless cores. Some well-studied cores show several indications of one-way gravitational collapse (e.g. L1544 or L1521F, Caselli et al., 2002a; Keto et al., 2004; Keto & Field, 2005; van der Tak et al., 2005; Crapsi et al., 2004). Similarly from several points of view, the core B68 appears to be stable. However, in other cores the possibility of perturbed equilibrium raises the question of whether inferences on the evolution and lifetimes of the starless cores may be drawn from limited observations. In particular, spectral line profiles that indicate inward or outward motion may sometimes be interpreted as implying either a short-lived evolution ending in collapse or dissolution or alternatively a long-lived evolution in oscillations such as a breathing mode.
This study expands the results of our previous study of the hydrodynamics of starless cores in which we modeled the oscillations of starless cores by numerical methods (Keto & Field, 2005). That earlier study offers some suggestions to reduce the ambiguity of the interpretation of observations of starless cores. For example, in the gravitational collapse of BE spheres with densities beyond critical, the inward velocities increase with decreasing radius throughout most of the volume of the sphere. In a breathing mode oscillation the higher velocities tend to be at larger radii toward the outside of the sphere. Thus spectral observations that resolve a core or can measure the difference in width of the spectral line profiles from the central and the outer regions of the core may provide additional information to help resolve the ambiguities.
1 The Hydrodynamic Model
The starless cores, particularly those that are of relatively low mass and density, such as B68, may be modeled as isothermal, pressure supported clouds. The temperature of the gas in starless cores is set by the equilibrium between heating by absorption of cosmic rays and cooling by radio frequency molecular line emission. In addition if the gas density is high enough ( cm-3) the gas may be collisionally coupled to the dust which is itself heated by the external radiation field of starlight in the Galaxy and cooled by thermal emission in the far infrared. (Larson, 1973, 1985; Evans et al., 2001; Shirley, Evans, & Rawlings, 2002; Zucconi, Walmsley, & Galli, 2001; Stamatellos & Whitworth, 2003; Goncalves, Galli, & Walmsley, 2004; Keto & Field, 2005). Detailed modeling of starless cores shows that the gas temperature in all the starless cores varies by no more than 50% about a mean temperature of 10 K. In smaller cores such as B68, with masses less than a few and densities less than cm-3, the gas is sufficiently transparent to molecular line radiation and sufficiently poorly coupled to the dust that the temperature variation is less than a few degrees. Thus for the purposes of our study of perturbations of the equilibrium structure of starless cores, we may approximate the gas temperature as isothermal. With the additional assumption that the equilibrium configuration of the cores is spherical, the unperturbed cores may be modeled as isothermal Bonnor-Ebert spheres.
The general theory of stellar pulsations is discussed in a number of references (see, e.g., Cox, 1980), and thus will only be summarized here. The eigenmodes of the oscillations are found by solving the linearized mass, energy, and momentum conservation equations subject to the constraints of regularity at the center of mass, continuity of the gravitational potential, and the vanishing of the comoving pressure variation at the surface. Since the time scale for temperature equilibrium due to dust continuum and molecular line radiation is short in comparison to the typical oscillation periods (Keto & Field, 2005), the perurbations, as well as the equilibrium configuration, may be assumed to be isothermal. The equations for the density and velocity perturbations are separable and the eigenmodes may be written in terms of spherical harmonics as
| (1a) | |||
| (1b) | |||
where and are the standard angular quantum numbers, is the radial unit vector, , and are the radial eigenfunctions which define the oscillation mode, and is a third quantum number corresponding to the number of radial nodes in (see the Appendix for more details). The density and velocity field is then a linear combination of the eigenmodes:
| (2a) | |||
| (2b) | |||
where is the unperturbed equlibrium density profile and are dimensionless mode amplitudes.
In general a large number of modes of oscillation exist, increasing in angular and radial complexity with increasing , and . In this study, we restrict ourselves to the simplest mode which can reproduce the observed features of B68, i.e., one that can simultaneously produce two velocity reversals across the cloud and a single reversal in radius. This is the , mode, for which the radial perturbation eigenfunctions are shown in figure 1. In order to produce the split asymmetric line profiles characteristic of the observations, the velocity perturbations must be a significant fraction of the sound speed. We chose a dimensionless amplitude of . This is quite large for the assumption of linear perturbations, as can be seen in figure 3, in which the perturbed and equilibrium density profiles are compared. Nevertheless, because the calculation is intended as an example to show how a model of oscillations could explain the observations, a linear analysis is sufficient for the purposes.
Our model cloud is scaled to a specific mass, size, and density chosen to approximate the properties of B68 as derived from observations. The model cloud has a total mass of 1.0 M⊙, a central density of cm-3, and temperature of 10 K. The maximum velocity due to the oscillations is approximately 0.1 kms-1.
2 Comparison with observations
Our knowledge of the structure of starless cores comes primarily from observations of both dust extinction and emission which trace the dust column density, and observations of molecular spectral lines which trace the gas column density and velocity structure of a cloud. We calculate the predicted column density and spectral line profiles of certain molecules for comparison with observations.
2.1 Column density
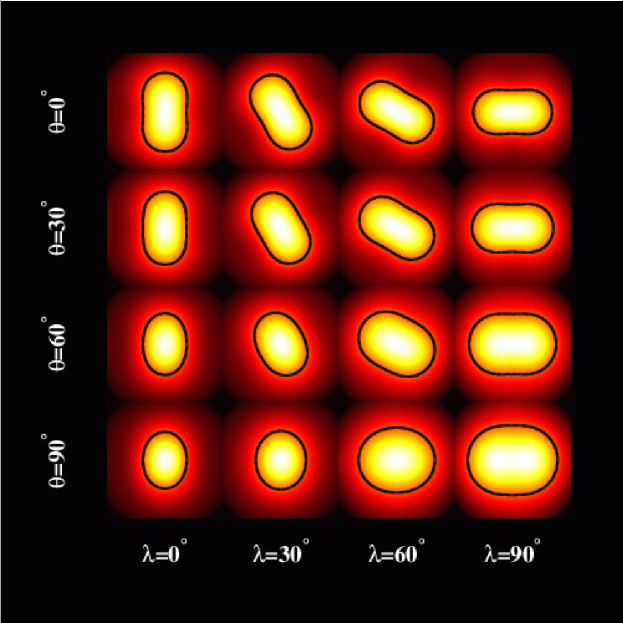
The column density through the starless cores, usually derived from observations of dust extinction or emission, is often shown in two different presentations: as two-dimensional spatial surface density maps and as a radial surface density profiles usually azimuthally averaged around the peak of the column density distribution. The two-dimensional map of gas column density of our perturbed model sphere is shown for various viewing orientations in figure 2. The viewing angles are those of a standard right-handed coordinate system with in the x-y plane and off the z-axis. The observer looks from the positive x-axis. As can be seen in figure 2, a cloud with perturbations of sufficient amplitude may show a morphology with an aspect ratio in column density of about 2:1 depending on viewing angle. The column density as a function of distance from the cloud center is shown in figure 3. The shaded envelope shows the range of variation of the run of column density with distance for different directions about the cloud center. The solid line in the middle of the shaded envelope shows the equilibrium configuration. Figures 2 and 3 may be compared to maps and plots of the column density as in the observations of Alves, Lada, & Lada (2001), Bacmann et al. (2000), and Ward-Thompson, Motte, & Andre (1999).
2.2 Spectral lines
Molecular spectral line profiles as would be observed from the model core have been computed by a non-LTE accelerated iteration (ALI) radiative transfer code (Keto et al., 2004). The core is assumed to be at 150 pc, the distance to the Taurus star-forming region and assumed to be observed with a telescope with a beam width of 20′′. The radiative transfer calculations are done in three dimensions to capture the asymmetric structure of the density and velocity perturbations.
To compute the spectral line profiles we also need to know the gas phase abundances of our tracer molecules. In the cold dense interiors of the dark cloud cores, molecules freeze out of the gas phase onto the surfaces of dust grains at different characteristic densities according to their different volatilities (Brown, Charnley, & Millar, 1988; Willacy & Williams, 1993; Hasegawa, Herbst, & Leung, 1992; Hasegawa & Herbst, 1993; Caselli et al., 1999, 2002a, 2002b; Bergin et al., 2002; Tafalla et al., 2002; Bergin, Langer, & Goldsmith, 1995; Aikawa et al., 2001; Caselli et al., 2002c). We follow Bergin et al. (2001), Tafalla et al. (2002), and Tafalla et al. (2004) and approximate the dependence of the abundance on the density, , as an exponential.
| (3) |
For CS we use an undepleted abundance of and critical density of cm-3. A more complete treatment of the molecular abundances of the starless cores derived from detailed chemical modeling is discussed in Lee, Bergin & Evans (2004).
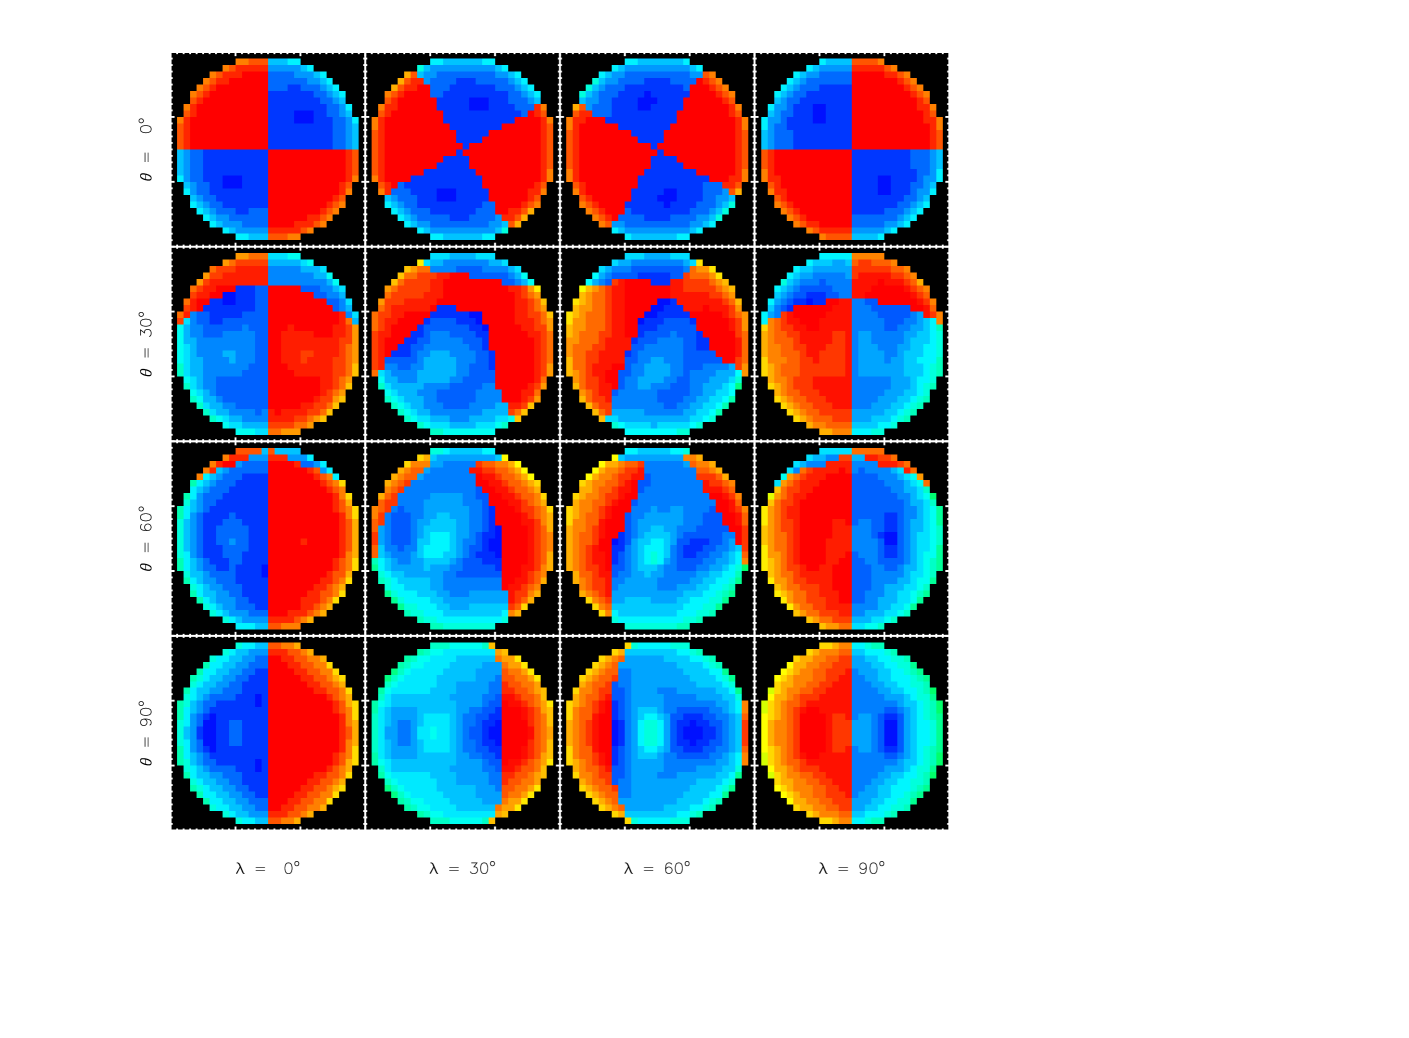
Figure 4 depicts the velocity of the peak of the profile of the CS(1-0) spectral line for the same viewing orientations as in figure 2. This presentation of the spectral line velocity is the same as in the observations of B68 (figures 6 and 7 of Lada et al., 2003). In particular, the map at the orientation is similar to that observed in B68 in that the modeled and observed velocity maps show two reversals of sign across the face of the cloud. Such double reversals cannot be explained by models of simple rotation, contraction, or expansion. The velocity fields of some of the orientations shown in figure 4 are similar to those produced by models of simple infall, contraction, and rotation. For example, ignoring the very weak emission at the boundary of the cloud, the map at has a velocity pattern similar to that produced by rotation, while that at appears similar to the velocities of a continuous expansion leading to dissolution. Because the pattern of perturbations in the mode (1,2,2) model has a two-fold symmetry about the z-axis (), a view of the model at would appear the same as that at (expansion) except that the velocities would be reversed and would therefore appear similar to the velocities of continuous contraction as in the early stages of gravitational collapse. Figures 5 and 6 show the spectral line profiles for the viewing orientations with and which are similar to those of rotation and expansion, or contraction if the velocities of the latter figure are reversed. These maps of spectral line profiles may be compared with the maps of observed spectral line profiles from starless cores which have been interpreted as dominated by rotation (figure 4 of Redman et al., 2004) and infall (figure 2 of Williams et al., 1999). Figure 7 shows the spectral line profiles for the orientation with which is similar to the pattern observed in B68.
When viewed from different orientations, our model for B68 shows different patterns for the velocities of the emission peak and different aspect ratios in column density. The prevalence of each of these patterns in an ensemble of identical clouds is determined by the symmetry of the particular mode of oscillation. Because our chosen model for B68 with mode (1,2,2) oscillations has a two-fold symmetry, at viewing angles along the equator the cloud will appear to be primarily contracting or expanding on views separated by . At intermediate viewing angles, the cloud will show a single reversal in the observed velocity and in the sense of asymmetry in the spectral line profile. Viewed at intermediate latitudes between the equator and the pole, the cloud will show more complex velocity patterns, for example the two reversals seen in figure 7. These simple considerations suggest that for the (1,2,2) mode, velocity patterns that are similar to those of radial flow, either contraction or expansion, should occur at roughly 40% of the viewing angles. Patterns similar to rotation would be seen in another 40% of the angles with complex patterns as seen in B68 making up the remaining 20%. While these quantitative estimates apply only to the particular (1,2,2) mode, the implication is that complex motions such as those seen in B68 might be seen in a minority, but still significant, number of observations of randomly oriented cores.
Oscillations of molecular clouds have a very long damping time and therefore should be long-lived and easily observable. Hydrodynamic models of one-dimensional oscillations in starless cores indicate that the damping time due to radiative losses is many crossing times (Keto & Field, 2005). Thus unless the clouds have lifetimes of many tens of crossing times and remain unperturbed for most of their lives, observations should commonly detect oscillations of starless cores. Oscillations that are of low order should be more commonly identified in observations than high order oscillations. First, cores dominated by low order oscillations would be more prevalent because the low order modes dissipate more slowly. Second, the spectral line shapes and patterns of the low order modes would be more easily recognized as coherent patterns and less likely to be confused with observational noise.
3 Conclusions
Our study suggests that oscillating, otherwise stable, starless cores may be more common than previously supposed. The density and velocity structure produced by a model of oscillations within a molecular cloud in pressure-supported equilibrium explains many of the observations of starless cores. In particular, an oscillation model can produce self-reversed, asymmetric line profiles with differing patterns of contraction and expansion across the face of a cloud core. These patterns can include simple spatial variations such as spherically symmetric contraction or expansion as well as more complex patterns with spatially alternating infall and outflow signatures. The nature and complexity of the pattern depends on both the orientation of the core to the line-of-sight and the complexity of the mode (or modes) of the oscillation. Thus, globules or starless cores in oscillation can be characterized by velocity fields that otherwise mimic global infall (contraction) or expansion or even simple rotation. The implication is that some cores that have been thought to be collapsing or rotating may be instead oscillating cores in disguise. Indeed, our modelling indicates that if oscillating cores in equilibrium are relatively common, then some starless cores should be found to display global expansion that would be otherwise difficult to understand. Moreover, additional examples of cores with alternating contraction and expansion patterns across the face of the core, such as B68, should also be detected in future surveys. Such starless cores may have lifetimes significantly longer than their sound crossing times.
Appendix A Non-Radial Isothermal Oscillation Modes
General non-radial oscillations are discussed in a number of references (see, e.g., Cox, 1980), and thus the method by which we constructed the isothermal oscillation modes are only summarized here. The equations governing small, non-radial oscillations are the linearized mass, momentum and energy conservation equations. Prior to presenting these, it is necessary to be explicit about the type of perturbation under consideration. Eulerian perturbations at a position are defined relative to the stationary unperturbed quantity,
| (A1) |
and commute with time and spatial derivatives. Alternatively, Lagrangian perturbations are defined relative to the advected unperturbed quantity,
| (A2) |
(where is the unperturbed positions of the fluid element) which commute with the convective derivative . These are not independent, related by
| (A3) |
and hence linear Lagrangian perturbations correspond to linear Eulerian perturbations and vice-versus.
Energy conservation gives generally
| (A4) |
where is the heating rate and
| (A5) |
are given by their standard definitions (in which is the specific entropy). The perturbed energy equation is given to linear order by
| (A6) |
where it was assumed that the equilibrium configuration is stationary (eq. 5.34a in Cox 1980). ¿From the ideal gas law it is straightforward to show that the Lagrangian perturbation to the heat flow required to maintain a constant temperature in spite of compressional heating is given by
| (A7) |
and hence the linearized energy equation may be integrated to yeild
| (A8) |
for oscillations in an isothermal ideal gas.
The linearized continuity and Euler equations are given by
| (A9) |
where is the gravitational potential (eqs. 5.29a & 5.31 in Cox 1980). These may be combined with the energy equation and the first law of thermodynamics to yield
| (A10) |
This is simply the equation for the non-radial adiabatic oscillations of a gas (cf. Cox, 1980), which is not unexpected as adiabatic varations of the gas are also isothermal. Coupled with the Poisson equation for the gravitational potential, this provides four equations for the components of , and .
In practice, it is more convenient to solve for the Dziembowski variables (Dziembowski, 1971):
| (A11) |
where is the gravitational acceleration. Since equation (A10) is separable in angle, it is useful to expand the Dziembowski variables in spherical harmonics, i.e., . In terms of the , equation (A10) and the Poisson equation are given by
| (A12a) | |||
| (A12b) | |||
| (A12c) | |||
| (A12d) | |||
where the dimensionless Chandrasekhar structure variables (, , and ) are defined in terms of the underlying equilibrium state by
| (A13) |
in which and are the mass and radius of the core, respectively.
These must be supplemented with boundary conditions. Regularity at the origin gives
| (A14) |
Continuity of the gravitational acceleration at the surface gives
| (A15) |
Finally, the requirement that the Lagrangian variation in the pressure at the surface vanish gives
| (A16) |
These boundary conditions together with the equations (A12d) define an eigenvalue problem for the .
Given the solutions to equations (A12a–A12d), it is possible to reconstruct the physically interesting perturbed quantities. In terms of the Dziembowski variables, the perturbation velocity is given by
| (A17) |
where the factor of is due to the phase shift between the velocity and displacement. The Eulerian density perturbation may be obtained from this using the linearized continuity equation, which after some simplification is
| (A18) |
References
- Alves, Lada, & Lada (2001) Alves, J., Lada, C., & Lada, E. 2001, Nature, 409, 159
- Aikawa et al. (2001) Aikawa, Y., Ohashi, N., Inutsuka, S., Herbst, E., & Takakuwa, S. 2001 Ap J, 552, 632
- Bacmann et al. (2000) Bacmann, A., Andre, A.P., Puget, J.-L., Abergel, A., Bontemps, S., & Ward-Thompson, D. 2000, A&A, 361, 555
- Bergin, Langer, & Goldsmith (1995) Bergin, E., Langer, W., & Goldsmith, P. 1995, Ap J, 441, 222
- Bergin et al. (2001) Bergin, E., Ciardi, D., Lada, C., Alves, J., Lada, E., 2001, Ap J, 557, 209
- Bergin et al. (2002) Bergin, E., Alves, J., Huard, T., & Lada, C. 2002, Ap Jl, 570, L101
- Bok (1948) Bok, B., 1948, Centennial Symposia, Harvard Observatory Monographs No. 7, Harvard-College Observatory, Cambridge
- Bonnor (1956) Bonnor, W., 1956, MNRAS, 116, 351
- Brown, Charnley, & Millar (1988) Brown, P., Charnley, S., & Millar, T., 1988, MNRAS, 231, 409
- Caselli et al. (1999) Caselli, P., Walmsley, C., Tafalla, M., Dore, L., & Myers, P. 1999, Ap Jl, 523, 165
- Caselli et al. (2002a) Caselli, P., Walmsley, C., Zucconi, A., Tafalla, M., Dore, L., & Myers, P. 2002a, Ap J, 565, 331
- Caselli et al. (2002b) Caselli, P., Walmsley, C., Zucconi, A., Tafalla, M., Dore, L., & Myers, P. 2002b, Ap J, 565, 344
- Caselli et al. (2002c) Caselli, P., Benson, P., Myers, P., & Tafalla, M., 2002c, Ap J, 572, 238
- Chandrasekhar (1939) Chandrasekhar, S., 1939, Stellar Structure, Univ. Chicago Press
- Cox (1980) Cox, J. P., 1980, Theory of Stellar Pulsation, Princeton University Press, Princeton, NJ, Princeton
- Crapsi et al. (2004) Crapsi, A., Caselli, P., Walmsley, C., Tafalla, M., Lee, C., Bourke, T., Myers, P., 2004, AA 420, 957
- Dziembowski (1971) Dziembowski, W., 1971 Acta Astron., 21, 289
- Evans et al. (2001) Evans, N., Rawlings J., Shirley, Y., & Mundy, L. 2001, Ap J, 557, 193
- Hasegawa, Herbst, & Leung (1992) Hasegawa, T., Herbst, E. & Leung, C., 1992, Ap Js, 82, 167
- Hasegawa & Herbst (1993) Hasegawa, T., & Herbst, E., 1993, MNRAS, 261, 83
- Goncalves, Galli, & Walmsley (2004) Goncalves, J., Galli, D., Walmsley, M., 2004, A&A, 415, 617
- Gregersen et al. (1997) Gregersen, E., Evans, N., Zhou, S., Choi, M., 1997, Ap J, 484, 256
- Gregersen & Evans (2000) Gregersen, E., Evans, N., 2000, Ap J, 538, 260
- Keto & Field (2005) Keto, E. & Field, G., 2005, ApJ in press, astro-ph/0508527
- Lada et al. (2003) Lada, C., Bergin, E., Alves, J., Huard, T., 2005, Ap J 586, 286
- Launhardt et al. (1998) Launhardt, R., Evans, N., Wang, Y., Clemens, D., Henning, T., Yun, J., 1998, Ap Js, 119, 59
- Larson (1973) Larson, R. 1973, Fundam. Cosmic Phys., 1, 1
- Larson (1985) Larson, R. 1985, MNRAS, 214, 379
- Lee, Bergin & Evans (2004) Lee, J., Bergin, E., Evans, N., 2004, Ap J, 617, 360
- Lee & Myers (1999) Lee, C.W. & Myers, P.C. 1999, Ap Js, 123, 233
- Lee, Myers, & Plume (2004) Lee, C.W., Myers, P., Plume, R., 2004, Ap Js, 153, 253
- Lee, Myers, & Tafalla (1999) Lee, C., Myers, P., & Tafalla, M. 1999, Ap J, 576, 788
- Lee, Myers, & Tafalla (2001) Lee, C., Myers, P., & Tafalla, M. 2001, Ap Js, 136, 703
- Keto et al. (2004) Keto, E., Rybicki, G., Bergin, E., Plume, R., 2004, Ap J, 613, 355
- Redman et al. (2004) Redman, M., Keto, E., Rawlings, J., Williams, D., 2004, MNRAS, 352, 1365
- Redman et al. (2006) Redman, M., Keto, E., Rawlings, J., Williams, D., 2006, MNRAS, submitted
- Shirley, Evans, & Rawlings (2002) Shirley, Y., Evans, N., & Rawlings, J., 2002 Ap J, 575, 337
- Stamatellos & Whitworth (2003) Stamatellos, D., & Whitworth, A., 2003, A&A, 407, 941
- Tafalla et al. (1998) Tafalla, M., Mardones, D., Myers, P., Caselli, P., Bachiller, R., Benson, P., 1998, Ap J, 504, 900
- Tafalla et al. (2002) Tafalla, M., Myers, P., Caselli, P., Walmsley, C., & Comito, C. 2002, Ap J, 569, 815
- Tafalla et al. (2004) Tafalla, M., Myers, P., Caselli, P., Walmsley, M., 2004, A&A, 416, 191
- van der Tak et al. (2005) van der Tak, F., Caselli, P., Ceccarelli, C., 2005, AA, 439, 135
- Wang et al. (1995) Wang, Y., Evans, N., Shudong, Z., Clemens, D., 1995, Ap J, 454, 742
- Ward-Thompson, Motte, & Andre (1999) Ward-Thompson, D., Motte, F., & Andre, P. 1999, MNRAS, 305, 143
- Willacy & Williams (1993) Willacy, K., & Williams, D., 1993, MNRAS, 260, 635
- Williams et al. (1999) Williams, J., Myers, P., Wilner, D., Di Francesco, J., 1999, Ap J, 513, L61
- Zhou et al. (1994) Zhou, S., Evans, N., Wang, Y., Peng, R., Lo, K., 1994, Ap J, 433, 131
- Zucconi, Walmsley, & Galli (2001) Zucconi, A., Walmsley, C., & Galli, D. 2001, A&A, 376, 650