Proper Motion of the Crab Pulsar Revisited
Abstract
It has been suggested that the Crab pulsar’s proper motion is well aligned with the symmetry axis of the pulsar wind nebula. We have re-visited this question, examining over 6 years of F547M WFPC2 chip 3 images to obtain a best-fit value of mas/yr at PA . At to the nebula axis, this substantially relaxes constraints on the birth kick of this pulsar. Such misalignment allows the momentum to be imparted over 1s timescales.
1 Introduction
Pulsars are fast-moving objects with space velocities up to an order of magnitude larger than their progenitors. It has long been suggested that this is the result of a momentum kick at birth. One way to probe the kick physics is to compare the pulsar’s velocity and spin axis orientations. The kick timescale is constrained by the alignment between the two vectors. For the Crab pulsar, stunning images from the Chandra X-ray Observatory reveal the torus-like pulsar wind nebula. The symmetry axis indicates the 3D orientation of the pulsar spin axis, and more interestingly, suggests an alignment with the proper motion. Ng & Romani (2004) fitted the pulsar wind torus and derived a quantitative measurement of the spin axis at position angle (PA) or . In contrast, the pulsar’s proper motion is not as well measured. Previous works by Wychoff & Murray (1977) and Caraveo & Mignani (1999) (hereafter CM99, ) have large uncertainties. The former examined photographic plates over 77 years and obtained the result of mas/yr, at PA . CM99 performed relative astrometry on the Wide Field Planetary Camera 2 (WFPC2) images from the Hubble Space Telescope (HST) and found a proper motion of mas/yr at using dataset spanning 1.9 years.
The high angular resolution cameras on board the HST make it possible to determine the pulsar proper motion in a short period of time. In the past few years, many new observations of the Crab pulsar have been collected with HST. The HST archive in fact contains WFPC2 Crab images spanning some 7 years, and new Advanced Camera for Surveys (ACS) images are now being taken. Also, recent studies have improved our understanding of the WFPC2 camera’s geometric distortions (Anderson & King, 2003, hereafter AK03). Thus, with a longer timebase and improved calibration, this study aims to update CM99’s estimate of the Crab pulsar’s proper motion.
2 The Datasets
Using HST/WFPC2 images, relative astrometry can be made to an accuracy of for objects on the same chip (Baggett et al., 2002, section 5.4). We have searched the Multi-mission Archive at Space Telescope (MAST) and found more than 70 WFPC2 observations of the pulsar from 1994 to 2001, making this the best instrument for the proper motion study. These images were taken using a variety of optical filters. However, as plate scales and geometric distortion vary slightly for different filters, we restrict our analysis to a single one. The F547M filter is the best choice, having the most observations and the longest time span of 7 years. Table 1 lists all the observations with this filter; epochs with similar pointing parameters are grouped. Obs 8a, which is observed with the POLQ filter, is also listed in the table as it is used in CM99. We have included the first ACS observation in the table as well.
| Obs. | Date | Exp. (s) | Detector | # Ref. Stars | Roll Angle | Chip x | Chip y | Group |
|---|---|---|---|---|---|---|---|---|
| 1 | 1994-03-09 | 2000 | WF2 | 11 | -116.8 | 463 | 160 | |
| 2 | 1995-01-06 | 1600 | WF3 | 8 | -51.2 | 163 | 130 | 1 |
| 3 | 1995-01-06 | 2000 | WF3 | 7 | -51.2 | 151 | 118 | 1 |
| 4 | 1995-08-14 | 2000 | PC | 5 | -48.7 | 470 | 371 | |
| 5 | 1995-11-05 | 2000 | PC | 2 | -25.3 | 340 | 300 | |
| 6 | 1995-12-29 | 2000 | PC | 4 | 128.7 | 297 | 600 | 2 |
| 7 | 1996-01-20 | 2000 | PC | 4 | 128.7 | 297 | 601 | 2 |
| 8 | 1996-01-26 | 2000 | PC | 4 | 128.7 | 297 | 603 | 2 |
| 8a | 1996-01-26 | 2000 | WF2 | 13 | -153.3 | 495 | 546 | |
| 9 | 1996-02-01 | 2000 | PC | 4 | 128.7 | 297 | 601 | 2 |
| 10 | 1996-02-22 | 2000 | PC | 4 | 128.7 | 297 | 602 | 2 |
| 11 | 1996-04-16 | 2000 | PC | 4 | 128.9 | 266 | 599 | 2 |
| 12 | 2000-02-06 | 2200 | WF3 | 15 | -47.3 | 373 | 273 | 3 |
| 13 | 2000-02-15 | 2200 | WF3 | 15 | -47.3 | 372 | 273 | 3 |
| 14 | 2000-02-26 | 2200 | WF3 | 15 | -47.3 | 371 | 271 | 3 |
| 15 | 2000-03-07 | 2200 | WF3 | 15 | -47.3 | 372 | 272 | 3 |
| 16 | 2000-03-17 | 2200 | WF3 | 15 | -47.3 | 373 | 273 | 3 |
| 17 | 2000-08-07 | 2300 | WF4 | 6 | -136.7 | 63 | 136 | 4 |
| 18 | 2000-08-18 | 2400 | WF4 | 6 | -136.7 | 63 | 136 | 4 |
| 19 | 2000-08-29 | 2400 | WF4 | 6 | -136.7 | 64 | 136 | 4 |
| 20 | 2000-09-09 | 1837 | WF3 | 8 | 132.7 | 217 | 342 | 5 |
| 21 | 2000-09-21 | 2071 | WF3 | 8 | 132.7 | 219 | 342 | 5 |
| 22 | 2000-10-01 | 1854 | WF3 | 8 | 132.7 | 217 | 342 | 5 |
| 23 | 2000-10-12 | 2400 | WF3 | 8 | 132.7 | 217 | 341 | 5 |
| 24 | 2000-10-23 | 2007 | WF3 | 8 | 132.7 | 217 | 342 | 5 |
| 25 | 2000-11-15 | 1927 | WF3 | 8 | 132.7 | 217 | 342 | 5 |
| 26 | 2000-11-25 | 2300 | WF3 | 8 | 132.7 | 226 | 334 | 5 |
| 27 | 2000-12-06 | 2100 | WF3 | 8 | 132.7 | 217 | 340 | 5 |
| 28 | 2000-12-18 | 2100 | WF3 | 15 | -47.3 | 372 | 274 | 6 |
| 29 | 2000-12-28 | 2100 | WF3 | 15 | -47.3 | 372 | 273 | 6 |
| 30 | 2001-01-09 | 2400 | WF3 | 15 | -47.3 | 378 | 275 | 6 |
| 31 | 2001-01-19 | 2400 | WF3 | 15 | -47.3 | 388 | 276 | 6 |
| 32 | 2001-01-30 | 2400 | WF3 | 15 | -47.3 | 388 | 276 | 6 |
| 33 | 2001-02-10 | 2400 | WF3 | 15 | -47.3 | 384 | 278 | 6 |
| 34 | 2001-02-21 | 2400 | WF3 | 15 | -47.3 | 388 | 276 | 6 |
| 35 | 2001-03-04 | 2400 | WF3 | 15 | -47.3 | 389 | 275 | 6 |
| 36 | 2001-03-15 | 2400 | WF3 | 15 | -47.3 | 390 | 275 | 6 |
| 37 | 2001-03-26 | 2400 | WF3 | 15 | -47.3 | 390 | 275 | 6 |
| 38 | 2001-04-06 | 2400 | WF3 | 15 | -47.3 | 390 | 275 | 6 |
| 39 | 2001-04-17 | 2400 | WF3 | 15 | -47.3 | 390 | 276 | 6 |
| 40 | 2001-04-19 | 2400 | WF2 | 6 | -137.6 | 133 | 41 | |
| 41 | 2003-08-08 | 2200 | ACS | 14 | -92.6 |
3 Data Reduction
To start, we attempted to reproduce the CM99 results. We used the same images (obs 1, 4 & 8a) and the same reference stars and attempted to follow their analysis as closely as possible. The data retrieved from the MAST are processed with the On-The-Fly Reprocessing (OTFR) system to ensure up-to-date calibration. The task crrej is employed to remove the cosmic rays and co-add images for each epoch. Geometric distortion is then corrected by remapping the images, using the task wmosaic in the STSDAS package. Coordinates of the pulsar and the four reference stars are obtained from a 2D Gaussian fit with the task fitpsf in IRAF. Finally, the best-fit positions are rotated according to the roll angles in image headers and the frames are offset to align the reference stars with obs 1.
By following CM99’s procedure in this way, we obtain
i.e. no significant detection of the proper motion. This is obviously inconsistent with CM99. The extremely large uncertainty is caused by star 1, which suffers a relative shift of 2 pixels from obs 1 to obs 8a. Comparison with other field stars shows that the shift is systematic and due to large changes in the field distortion caused by the extra polarizer filter POLQ used in obs 8a. This underscores the fact that different filters are incompatible and should not be compared directly without filter-specific distortion maps. If we exclude frame 8a and fit only the first two images, the star residuals after frame alignment are 7.6 mas. With four reference stars, the formal statistical uncertainty on frame alignment is half as large, but as systematic distortions dominate the alignment error, the pulsar astrometry is no better than the 7.6 mas level. We feel that this is a more realistic assessment of the astrometric errors in these data than the CM99 values. This gives a rather low significance detection of the Crab proper motion. In any case, we see no way to avoid large errors in star astrometry and frame registration with simple Gaussian fits to only a few star images.
3.1 Our Approach
Since many F547M frames are now available, we can make a more careful assessment of the proper motion, restricting to a single filter configuration and examining similar telescope pointings. Also, we should avoid performing distortion corrections with the task wmosaic, which degrades the resolution by re-sampling the image. Instead, we followed an approach similar to Kaplan, van Kerkwijk, & Anderson (2002) that involves no re-sampling of the data. Star coordinates are first measured on the chip reference frame. These pixel positions are then corrected for geometric distortion, followed by the standard transformation for frame alignment.
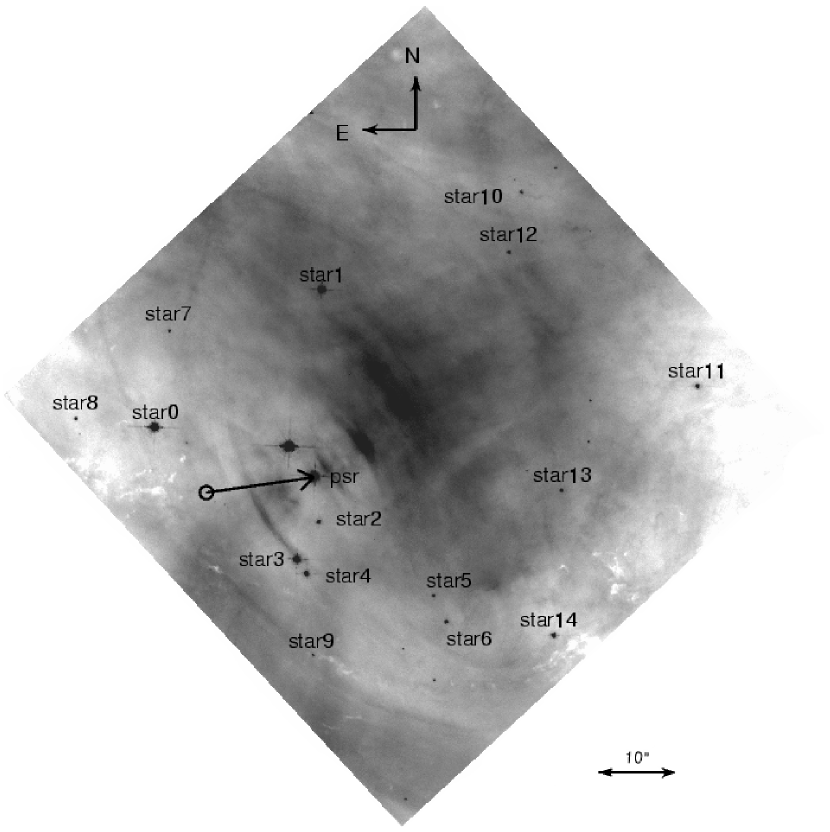
As labeled in figure 1, 15 stars with high signal-to-noise ratio (S/N) are chosen as reference points. After cosmic ray removal, images for the same epoch are co-added. Then we employed 2D Gaussian fit with the task fitpsf for centering the objects. We found that the pulsar position is not sensitive to the knot at the SE, since the former is much brighter. More generally, the nebular background does not appear to significantly affect the astrometry of the bright stars used here, as tested by variation in the extraction region and background fitting algorithm. On the other hand, the pulsar and a few of the brightest reference stars are saturated in these exposures. To test whether this saturation affects our Gaussian fit astrometry, we attempted fitting with saturated pixels masked using the Data Quality Files. We found that the changes to individual star positions are much smaller than the estimated error in our astrometry (§ 3.4) and the residuals in frame alignment are in fact slightly lower without masking. Therefore, we did not mask out any pixels in the fit.
3.2 Distortion Correction
After the star coordinates are obtained, we must correct for geometric distortion before frame alignment. The tasks metric and wmosaic in the STSDAS package are commonly used for geometric distortion correction of the WFPC2. However, in addition to the degradation resulting from re-sampling, the geometric corrections are based on Gilmozzi, Ewald, & Kinney (1995), with an rms residual of 10 mas. We clearly need higher accuracy for the proper motion measurement. The recent study of AK03 gives a much better solution with accuracy better than 0.02 wide field (WF) pixels, i.e. 2 mas. It is argued in Kaplan et al. (2002) that the chromatic variation in the distortion is modest for filters at similar wavelengths, so we applied the AK03 solution for the F555W filter in our analysis. The pixel coordinates are first corrected for the 34th row defect (Anderson & King, 1999), then the geometric distortion is removed using the third-order polynomials in AK03.
3.3 Frame Alignment
To proceed to relative astrometry, each frame is aligned to a common sky position, measuring four fitting parameters (scale, x-, y-shift and rotation). The reference star positions and proper motions (which even for typical 10 km/s local Galactic velocity dispersion can be detectable over the full data span) are not, of course known a priori, and so are also determined in the global fit to the data frames. All parameters are fitted simultaneously by global minimization. If we attempt to use all F547M data (table 1), we find large reference star residuals for frames with different roll angles and when the pulsar is present in different camera chips (figure 2). This is almost certainly due to residual uncorrected geometric distortion. Thus in order to minimize the systematic errors, we have to further limit the fit to a subset of the data with similar pointing parameters. Groups 3 & 6 are the place to start, since they have identical roll angles and contain most of the frames. However, we also included group 1 in the fit since it has a similar roll angle with groups 3 & 6 and the very long (6 year) time base can help overwhelm residual distortion errors from the somewhat different chip placement of the pulsar in these frames.
3.4 Sources of Error
Before discussing the results, it is important to have a quantitative estimate of the uncertainties in the star astrometry. The main sources of error are star position measurement and residual geometric distortion.
The formal statistical errors in measuring the star centroids are essentially negligible (1mas) since all the stars have high S/N. Also, as noted above, the results are quite insensitive to the background fitting method. Following CM99, we used different aperture sizes, but found that the best-fit positions only varied by 1 mas for apertures the full width half-maximum (FWHM). Of course the true errors in star centroiding are much larger than that suggested by the centering algorithm , since the PSF is substantially under-sampled by the WFPC2 pixels, giving large Poisson fluctuations at the peak. The true astrometric uncertainty is in fact best measured by comparing star pixel coordinates among group 6 frames, since these (many) frames have an identical telescope pointing and thus residual image distortion cannot introduce position shifts between frames. This exercise gives an rms variance in each coordinate of 4.3 mas, our best estimate of the single star centroiding error.
Simple Gaussian fit could in principal dominate this error, so we tried a different centering method using Tiny Tim (Krist, 1995) simulated point-spread functions (PSFs). The results are very similar to the Gaussian astrometry. For example comparison of obs 35 & obs 37 shows rms scattering of 3.2 & 4.6 mas for Gaussian and PSF fit respectively. This suggests that Gaussian fits do not significantly degrade the accuracy of the centroiding of these bright stars (although they do not, of course capture systematic PSF-dependent centroid shifts).
As mentioned, a simple fit to all of the F547M data shows that frames with different telescope pointings do not match well. This implies that some residual geometric distortion remains even after applying the AK03 solution. Of course, we do not expect to recover their full accuracy since our dataset is taken with another filter. Also, their study used an effective PSF (ePSF) determined from the actual exposures (of Centauri). Since the centroiding depends on the PSF used, the distortion map is specific to a particular ePSF scheme. Unfortunately, the Crab frames contain too few stars to build up a local ePSF.
To probe the level of astrometric error introduced by the residual distortion, we compared star positions measured from exposures with different roll angles. As an example, we consider obs 23 (from group 5) & obs 37 (from group 6), which have a 180 relative rotation. Superposition of the two frames gives a rms variance of 10 mas for the 8 common reference stars. However, we noticed that some bright stars exhibit large systematic residuals. In particular, star 0 & star 3 are shifted for 20 & 15 mas respectively in the y-direction after alignment. A comparison of the pulsar positions in the two exposures also yields a similar amount of shift in this direction. Given that the brightness of the pulsar is comparable to star 0, we speculate that the systematic error is due to some fine structures in the PSFs of the bright stars. To further characterize the shift, we performed the same analysis on other frames between the two groups and found that the pulsar, star 0 & star 3 always have large systematic residuals in the same direction. To check if a realistic model PSF fitting could improve the results (as the position-dependent model PSF is plausibly closer to the true PSF), we repeated the same process with centroiding using the Tiny Tim simulated PSFs. However, comparison of obs 23 with obs 37 gives a larger rms variance of 14 mas and the systematic shifts in the pulsar, star 0 & star 2 persist. Clearly the detailed structures that cause systematic errors of the bright stars are unmodeled by the simulated PSFs. We conclude that Tiny Tim PSF fit is not an improvement over Gaussian fit for our case.
On the other hand, comparison of frames in the same group shows small variance in the star positions, although the offset in telescope pointings are as large as 20 pixels within a group. This argues against saturation or PSF under-sampling effects dominating the shifts and suggests that the position-dependent PSF distortions are more moderate. Furthermore, AK03 found that their distortion solution is stable over a period of years and the orbital effects such as jitter and breathing induce scale variations less than (i.e. 1 mas for our relative star positions). We therefore suspect that the large roll angle-dependent residuals are due to non-axisymmetric structures in the bright star PSFs, not modeled in the Gaussian or Tiny Tim fits. However, group 1 is at a very similar roll angle to groups 3 & 6 and should therefore avoid the relative shift found in the bright-star PSFs. We thus included it in our fit, even though it may contain residual position-dependent PSF distortions. We estimated this residual distortion by discarding star 0 in the frame comparison. This reduces the scatter to 7.6 mas when obs 23 is compared with obs 37. After removing the astrometric error in quadrature, this implies that residual distortion contributes 6 mas to the uncertainty when the AK03 correction is applied to Gaussian-fitted star positions under the F547M filter. To conclude, groups 1, 3 & 6 have sufficiently similar telescope pointings such that the residual distortion is minimal; group 5 is at a very different roll angle and groups 2 & 4 use different chips. They thus have large, uncorrected residual distortions and we must exclude them from the fit.
To remove this residual distortion, the full effective PSF approach (Anderson & King, 2000) would be required. Unfortunately, the dearth of field stars makes it difficult to build a useful PSF library. We therefore proceed with Gaussian fits to seek the best current results. However, as this study was being completed, we learned that Anderson and colleagues are attempting a full ePSF study of the Crab field and we expect that this can provide additional astrometric accuracy.
4 Results
Figure 2 shows the pulsar positions at different epochs, with the star positions and proper motions fixed from the groups 1, 3 & 6 fit and frame registration determined by standard transformations of individual epochs. The uncertainties are given by rms scatterings of the reference star coordinates in the corresponding epoch. In each case we re-scale the errors accounting for the number of degrees of freedom absorbed by the fitted parameters. Since there are only two independent frames in group 1, a substantial fraction of the position uncertainty is absorbed by the reference star proper motion terms in the fit. In addition, for group 1 the pulsar position on the chip differs substantially (although the observation roll angle is similar) so residual geometrical distortions almost certainly affect the pulsar astrometry, as described above. Thus the re-scaled statistical errors (solid error flags) are likely significantly too small. So we add, in quadrature, the 4.3 mas centroiding error and the 6 mas residual distortion error estimated above for a more realistic 7.4 mas error estimate (dashed error flags). This gives a more conservative error in the proper motion fit.

Linear regression is employed to determine the pulsar’s proper motion. The best-fit result
is plotted by the solid line in the graph. While is consistent with previous studies, is about 5 times smaller, resulting in a significantly different position angle for the proper motion. (For reference, we obtained if the statistical errors of group 1 are used).
We also checked the fit with only group 3 & 6 data, since residual distortion cannot affect our astrometry in these images. For this restricted data set, the proper motion
is shown by the dotted line in the figure 3. The errors are of course larger with the shorter time base, but systematic errors cannot contribute significantly. Note that differs by 1.7. is not significantly changed, and still differs substantially from previous estimates.

The best-fit pulsar proper motions (two years’ position offsets) with the associated uncertainties are shown by dashed, solid and dotted arrows in the graph for CM99 and the two above cases, respectively. The proper motion directions in our two fits are in excellent agreement, with a posiiton angle . For comparison, the CM99 best-fit value (which is similarly uncorrected to the local standard of rest) lies 5.7 away, although given their much larger errors the measurements only disagree at the 1.6 level.
To convert the proper motion to its local standard of rest, Galactic rotation and solar peculiar motion corrections must be applied. Here a flat rotation curve is assumed, with km/s and kpc (Fich, Blitz, & Stark, 1989) and the solar constants are taken to be , & km/s (Dehnen & Binney, 1998). Applied to our group 1, 3 & 6 fit, this gives our final result of
or
At the nominal distance of 2 kpc, this gives the pulsar’s space velocity as km/s . For reference, the group 3 & 6 solution has at PA in its local standard of rest.
5 Discussion
Our study, using WFPC2 observations spanning 6 years, improved geometric distortion corrections and a more realistic assessment of errors, suggests a new value for the Crab pulsar’s proper motion differing from that of previous studies. We have not been able to reproduce the estimate of CM99. We believe that the errors were substantially underestimated in their proper motion study which used only four stars in three data frames spanning 1.9 years. We must conclude that our new position angle measurement supersedes this earlier estimate.
This is important, since the apparent alignment of the Crab pulsar’s proper motion and spin axis (as measured from the pulsar wind nebula) has significantly driven thinking about the linear momentum-angular momentum correlations expected in different models of the birth kick. Indeed, as the index case, the Crab pulsar has suggested that many pulsars may have spins and kicks aligned at birth. A simplified interpretation (Spruit & Phinney, 1998; Romani, 2005) suggests that during core collapse, the momentum imparted by the kick is rotationally averaged, resulting in alignment between velocity and spin vectors. Hence the alignment angle is an important observational parameter that places constraints on the characteristic timescale of the kick. Ng & Romani (2004) derived the Crab pulsar’s spin axis at PA (equivalent to ) by pulsar wind torus fitting. Comparing with the best-fit proper motion leads to a misalignment of , which is substantially larger than the previously suggested value. This is also greater than that of several other pulsars, including the Vela pulsar (Ng & Romani, 2004). Note that the measured angle is the projection on the sky plane of the true 3D alignment angle. The latter cannot, of course, be deduced unless the pulsar’s radial velocity is known. However, using the 3D orientation of the nebula’s symmetry axis (Ng & Romani, 2004), simple geometry shows that for a random pulsar radial velocity between -500 km/s to 500 km/s, there is only 8% chance to obtain a 3D alignment angle smaller than the projected value. In fact, the 3D mis-alignment is always greater than for any value of the radial velocity. The large alignment angle relaxes the constrains on pulsar kick during core collapse. Since the initial spin period for the Crab pulsar is about 19 ms, our result suggests that a short kick timescale is allowed, possibly much less than 1s. Of course, a more detailed treatment of the spin induced by the off-center kick can complicate the interpretation (Spruit & Phinney, 1998, Ng and Romani, in preparation).
Our analysis is clearly not the last word on the important question of the Crab pulsar’s proper motion. Improved astrometry, with more accurate distortion correction, and an improved time base employing newly scheduled ACS images should allow the use of all the HST images and further reduce the proper motion errors. Perhaps a final measurement with the WFPC2, with the pointing parameters of group 1 would also be useful, ensuring the minimal sensitivity to systematic errors. Pursuit of such measurement is quite important since our result, at a minimum, calls in to question the widely accepted alignment of the Crab pulsar’s spin and velocity.
References
- Anderson & King (1999) Anderson, J., & King, I. R. 1999, PASP, 111, 1095
- Anderson & King (2000) Anderson, J., & King, I. R. 2000, PASP, 112, 1360
- Anderson & King (2003) Anderson, J., & King, I. R. 2003, PASP, 115, 113
- Baggett et al. (2002) Baggett, S., et al. 2002, in HST WFPC2 Data Handbook, v. 4.0, ed. B. Mobasher (Baltimore: STScI)
- Caraveo & Mignani (1999) Caraveo, P. A., & Mignani, R. P. 1999, A&A, 344, 367
- Dehnen & Binney (1998) Dehnen, W., & Binney, J. J. 1998, MNRAS, 298, 387
- Fich, Blitz, & Stark (1989) Fich, M., Blitz, L. & Stark, A. 1989, ApJ, 342, 272
- Gilmozzi, Ewald, & Kinney (1995) Gilmozzi, R, Ewald, S. & Kinney, E. 1995, WFPC2 Instrument Science Report 95-02 (Baltimore: STScI)
- Kaplan et al. (2002) Kaplan, D. L., van Kerkwijk, M. H., & Anderson, J. 2002, ApJ, 571, 447
- Krist (1995) Krist, J. 1995, in ASP Conf. Ser. 77, Astronomical Data Analysis Software and Systems IV, ed. R. A. Shaw, H. E. Payne, & J. J. E. Hayes (San Francisco: ASP), 349
- Ng & Romani (2004) Ng, C.-Y., & Romani, R. W. 2004, ApJ, 601, 479
- Romani (2005) Romani, R. W. 2005, in ASP Conf. Ser. 328, Binary Radio Pulsars, ed. F. A. Rasio & I. H. Stairs (San Francisco: ASP), 337
- Spruit & Phinney (1998) Spruit, H. & Phinney, E. S. 1998, Nature, 393, 139
- Wychoff & Murray (1977) Wychoff, S., & Murray, C. A. 1977, MNRAS, 180, 717