∎
Tel.: +39-06-94188870
Fax: +39-06-94188870
22email: paolo.giommi@asi.it 33institutetext: S. Colafrancesco 44institutetext: INAF - Osservatorio Astronomico di Roma
Tel.: +39-06-94286418
Fax: +39-06-9447243
44email: Sergio.Colafrancesco@mporzio.astro.it
Non-thermal Cosmic Backgrounds and prospects for future high-energy observations of blazars
Abstract
We discuss the contribution of the blazar population to the extragalactic background radiation across the electromagnetic (e.m.) spectrum with particular reference to the microwave, hard-X-ray and -ray bands. Our estimates are based on a recently derived blazar radio LogN-LogS that was built by combining several radio and multi-frequency surveys. We show that blazar emission integrated over cosmic time gives rise to a considerable broad-band non-thermal cosmic background that dominates the extragalactic brightness in the high-energy part of the e.m. spectrum. We also estimate the number of blazars that are expected to be detected by future planned or hypothetical missions operating in the X-ray and -ray energy bands.
Keywords:
galaxies: active - galaxies: blazar: BL Lacertae surveys1 Introduction
Active Galactic Nuclei (AGN) are well known to dominate the high-energy (soft-X-ray and beyond) high Galactic latitude sky. Their radiation integrated over cosmic time can explain most, if not all, the extragalactic background radiation (e.g. Giacconi62 ; Rosati02 ; Moretti03 ; Giommi06 ). Historically, AGN have been classified in many, sometime inconsistent or confusing. ways, depending on how they appeared in surveys performed in different energy bands and flux limits, often determined by the technology available at the time of the survey, or depending on some observational parameter like e.g. the flux ratio between radio and optical emission, the equivalent width of their emission lines, etc.
In the following we use the widely accepted standard paradigm where AGN are powered by accretion onto a super-massive black hole, e.g. Urry95 ; Urry2003 ; Vellieux2003 , to divide this class of sources. into two broad categories defined by their intrinsic emission mechanism.
-
•
AGN whose power is dominated by radiation of thermal origin produced by matter that is strongly heated in the inner parts of a disk of matter falling onto the super-massive black hole and illuminates the circumnuclear matter that is responsible for the broad line emission. We call these objets Thermal Emission Dominated AGN or TED-AGN.
-
•
AGN whose power is dominated by Non-Thermal radiation (or NTED-AGN) where most of the emission is generated through non-thermal processes like the synchrotron and the inverse Compton mechanism by particles accelerated in a jet of material that moves at relativistic speed away from the central black hole. The jet itself if formed converting part of the accretion energy in a way that is presently not well understood.
Within this general definition the class of blazars corresponds to the small subset of NTED-AGN that are viewed at a small angle w.r.t. the jet axis (for this reason their emission is strongly amplified by relativistic effects bla78 ; Urry95 ), whereas Radio Galaxies are those NTED-AGN that are viewed at a large angle w.r.t. the jet axis. Here we do not distinguish between line-less objects, or BL Lacs, and broad-line Flat-Spectrum Radio Quasars, or FSRQs.
When the accretion and jet emission coexist in the same object and produce similar amounts of radiation we have AGN that are a mixture of the TED and NTED type that appear like broad-line radio galaxies (e.g. 3c120).
The overall cosmic background energy has two well understood components: the primordial black body emission peaking at microwave frequencies, or CMB, and the X-ray apparently diffuse emission arising from the accretion onto super-massive black holes in AGN integrated over cosmic time, or CXB. We will show that blazars add a third non-thermal component that at low frequencies contaminates the CMB fluctuation spectrum and complicates its interpretation giocol04 , while at the opposite end of the e.m. spectrum it dominates the extragalactic background radiation Giommi06 .
In the following we estimate the contribution of blazars to non-thermal cosmic backgrounds starting from a recently derived deep radio LogN-LogS. The broad-band electromagnetic spectrum of a blazar is composed of a synchrotron low-energy component that peaks [in a representation] between the far infrared and the X-ray band, followed by an Inverse Compton component that has its maximum in the hard X-ray band or at higher energies, depending on the location of the synchrotron peak, and extends into the -ray or even the TeV band. Those blazars where the synchrotron peak is located at low energy are usually called Low energy peaked blazars or LBL, while those where the synchrotron component reaches the X-ray band are called High energy peaked blazars or HBL P95 . LBL sources are the large majority among blazars Pad03 and are usually discovered in radio surveys, while HBL objects are preferentially found in X-ray flux limited surveys, since at these frequencies they are hundreds, or even thousands, of times brighter than LBLs of similar radio power.
2 The radio LogN-LogS of blazars and their contribution to extragalactic cosmic backgrounds
The deep blazar radio (5GHz) LogN-LogS shown in Fig. 1 has been recently derived by Giommi06 who showed that it can be described by a broken power law with parameters defined in eq. (1):

| (1) |
Once the LogN-LogS of a population of sources is known in a given energy band it is possible to estimate their emission in other parts of the electromagnetic spectrum, provided that the flux ratio between the two bands is known. In this section we deal with flux ratios and Spectral Energy Distributions (SED) of blazars that will be used to estimate the contribution to cosmic backgrounds at microwave frequencies and in the X-ray and -ray bands.
The distribution of flux ratios shown in Fig.2 (see Giommi06 for details) spans about four orders of magnitudes implying that the X-ray flux of blazars with the same radio flux can be different by up to a factor 10,000!


In the following we estimate the blazar contribution to the cosmic backgrounds basing our calculation on the radio LogN-LogS of Fig. 1 and on flux ratios in different bands (Fig 2) or on observed blazar SED.
2.1 The Cosmic Microwave Background
The contribution of blazars to the CMB has been estimated in the past from different viewpoints (e.g. toff98 ; giocol04 ). Here we calculate the integrated microwave background intensity as follows
| (2) |
where dN/dS is the differential of eq. (1). The minimum integration flux of 0.1 mJy for is likely to be conservative, since blazars with radio flux near or below 1 mJy are already included in the Einstein Medium Sensitivity Survey BL Lac sample Rec00 . The integrated intensity is converted from 5GHz to microwave frequencies by convolving the flux value with the observed distribution of spectral slopes between 5GHz to microwave frequencies, as estimated from the 1Jy-ARN sample (see giocol04 for details).
The fractional contamination, of blazars to the CMB intensity () and the corresponding apparent temperature increase at frequency of 90-300 GHz has been derived by Giommi06 . Blazars also contribute to the temperature anisotropy spectrum of the CMB with a spectrum
, where
| (3) |
The quantity on the right hand side in eq. (3) is the usual Poisson shot-noise term, Peebles80 ; Tegmark96 and we neglect here the clustering term, , which adds to the Poissonian term since there is not a clear estimate of the blazar clustering yet. Note, however, that the inclusion of clustering significantly increases the amount of contamination, especially at large angular scales Gonzales05 .
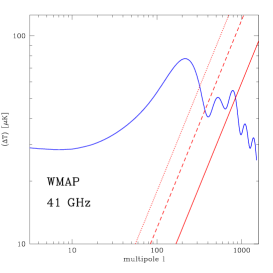
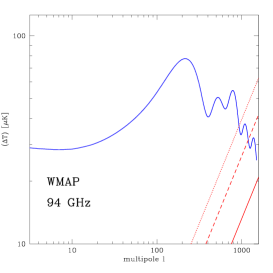
For the blazar population described by the LogN-LogS given in Fig. 1, we found at 41 GHz and at 94 GHz. When translated into temperature units (see giocol04 ) we found a value at 41 GHz and at 94 GHz. We show in Fig. 4 the quantity ()blazar and compare it to the CMB fluctuation power spectrum which best fits the available data. These values (shown as solid lines) have to be considered as a definite lower limit for , since they neglect the contribution of steep-spectrum sources at low frequencies which flatten at these frequencies (41 and 94 GHz, dashed lines) and the effect of flux variability (dotted lines).
The blazar flux variability at millimeter wavelengths may be substantial (higher than factors 3-10 on time scales of weeks to years seen at cm wavelengths) and could increase the amount of contamination of CMB maps when these are built over long integration periods.
The contamination level shown in Figs. 4 is the one expected in the case where no blazars are removed from the CMB data. We expect that a correct procedure to derive the CMB power spectrum that takes into account the full point-like source contribution implied by our LogN-LogS, would both influence the shape of the expected power spectrum and increase the statistical uncertainties of the WMAP data points, especially at high multipoles, where the blazar contribution is larger.
The previous calculations we performed neglecting the blazar clustering and thus they must again be considered as a lower limit to the realistic angular power spectrum contributed by these sources. The effects of clustering on the CMB fluctuation spectrum has been partially estimated by some authors: (e.g. Gonzales05 ; Scott99 ). Expectations for the clustering effect strongly depend both on the adopted model for the source counts and on their clustering model. Based on the correlation function of Loan97 on that for the SCUBA sources Scott99 , and on our blazar LogN-LogS, we expect that the contamination of the first peak of the fluctuation spectrum (at the WMAP 41 GHz channel) is at a level in the range 20-25 %. This estimate does not include possible variability effects and additional core-dominated radio sources
2.2 The Soft X-ray background
We estimate the contribution of blazars to the CXB at 1 keV using two methods: i) converting the integrated radio flux calculated with Eq. (2) into X-ray flux with the observed distribution of flux ratios in Fig. 2; and ii) converting the integrated blazar contribution to the CMB (at 94 GHz) to X-ray flux using the distribution of , the microwave (94 GHz) to X-ray (1keV) spectral slope, estimated from the subsample of blazars detected by WMAP in the 94 GHz channel, for which an X-ray measurement is available (see Fig. 9 in Giommi06 ). The first method gives a total blazar contribution to the X-ray background of erg cm-2s-1deg-1 (about 70% of which is due to HBL sources with erg cm-2s-1Jy-1 ) in the ROSAT 0.1-2.4 keV energy band. Assuming Giommi06 an average blazar X-ray energy spectral index of = 0.7, this flux converts to erg cm-2s-1deg-1 in the 2-10 keV band or 11% of the CXB, which is estimated to be erg cm-2s-1deg-1 perri00 .
The distribution of has an average = 1.07 and a standard deviation of 0.08 corresponding only to about a factor 3 in flux. This distribution is much narrower than the one between the radio and X-ray band (Fig. 2), while the dispersion is comparable to that expected from blazar variability at radio and especially at X-ray frequencies. The X-ray flux can therefore be estimated simply as =1.4 (see, e.g., Giommi06 ).
Since the blazar integrated emission at 94 GHz is CMB94GHz or 0.64 Jy/deg2 and the cosmic X-ray background is erg cm-2s-1 perri00 in the 2-10 keV band (equivalent to 2.31Jy/deg2 at 1 keV), we have that f1keV = 0.09 Jy/deg2 or 3.9% of the CXB for =0.64Jy/deg2 . Considering that the distribution of Giommi06 only includes LBL objects and that HBL sources make up two thirds the total contribution to the CXB, the percentage scales to about 12% which is very close to the 11% obtained with the previous method. Both results are in good agreement with the independent estimate of Galbiati04 , who find that the radio loud AGN content of the CXB is 13% in the XMM-Newton bright serendipitous survey.
2.3 Hard X-ray – soft -ray Background
The number of sources detected at energies larger than soft X-rays is still rather low, so building reliable distributions of flux ratios between radio or microwaves and the Hard X-ray/-ray fluxes is not currently possible. Thus, in order to estimate the blazar contribution to high energy Cosmic Backgrounds (E100 keV), we therefore followed a different approach: we extrapolated the predicted blazar integrated intensity at microwave frequencies (eq. 2) to the hard X-ray and soft -ray band using a set of hypothetical SSC spectral energy distributions.
Figure 5 (left panel) shows the CMB, CXB, and CGB together with three predicted SEDs from a simple homogeneous SSC models whose parameters are constrained to 1) be consistent with the expected integrated flux at 94 GHz, 2) have the slope equal to the mean value of the WMAP blazars ( = 1.07), and 3) possess a radio spectral slope equal to the average value in the WMAP sample. The three curves, so constrained, are characterized by synchrotron peak frequencies of = , , and Hz. A high value of largely overestimates the observed hard-X-ray to soft -ray ( Hz or 500 keV-10 MeV) cosmic background, whereas a too low value of predicts a negligible contribution (see Fig. 5, left panel). The case = Hz predicts 100% of the cosmic background. Since the Log( ) values of blazars in the WMAP and other catalogs peak near 13.5 and range from 12.8-13.7 within one sigma from the mean value, we conclude that blazars may be responsible for a large fraction (possibly 100%) of the hard-Xray/soft -ray cosmic background.
2.4 -ray Background
The SSC distributions of Fig. 5 predict a negligible blazar contribution to the extragalactic -ray Background above MeV. Nevertheless, it is well known that blazars are the large majority of the extragalactic -ray (E 100 MeV) identified sources detected by the EGRET experiment Hartman99 ; therefore they are likely to contribute to the -ray background in a significant way. Indeed, P93 concluded that blazars should make a large fraction, if not the totality, of the extragalactic -ray background. However, these early calculations relied upon a very small sample and had to assume no strong variability, a characteristic that was later demonstrated to be extremely common in -ray detected blazars.
Figure 11 in Giommi06 compares the energy distribution of the CMB, CXB, and CGB to the SED of 3C 279, a well-known bright blazar detected by EGRET, scaled to the integrated blazar flux intensity as calculated with eq. (2). Taking into account the strong variability of blazars seen across the whole e.m. spectrum Giommi06 show that while the contribution to the CXB can range from a few percent to over 10% in the higher states, the predicted flux at -ray frequencies ranges from about 100% to several times the observed cosmic background intensity. Such large excess implies that either sources like 3C279 are not representative of the class of blazars or their duty cycles at -ray frequencies are very low. A way of quantifying the ratio between the -ray intensity predicted by assuming that the source is representative of the entire population and the actual background intensity is to use the microwave (94 GHz) to -ray (100 MeV) slope = -.
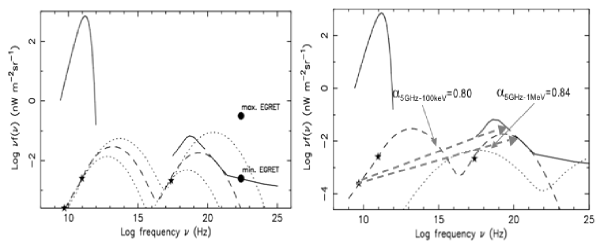
For comparison, we defined as the of a hypothetical source that would produce 100% of the CGB if representative of the entire class. Any real source with flatter than would then predict an integrated flux in excess of the observed -ray background if representative of the entire population; alternatively, its duty cycle must be lower than 100%. Fig. 5 (left) shows the minimum and maximum values of among the sources detected by the EGRET experiment.
2.5 TeV background
All blazars detected so far at TeV energies are of the HBL type, therefore we estimate the blazar contribution to the TeV background as in the case of the soft -ray Background but only considering the HBL component and not the entire blazar population. These extreme objects have been estimated to be about 0.1 % of the blazar population Giommi06 . Using the SED of the well known TeV blazar MKN421 normalized at 94 GHz (see Fig.13 in Giommi06 ), so that the flux is scaled to 0.1% of the intensity produced by the entire population of blazars, we see that, despite HBLs are a tiny minority, their integrated X-ray flux makes up a fairly large fraction of the CXB and that their TeV emission may produce a significant amount of extragalactic light. We note, however, that since extreme HBLs, such as those of the Sedentary survey, are very rare (one object in several thousand degrees with flux above a few mJy), the extragalactic light at TeV energies should be very patchy, associated to single sources, rather than a diffuse light resulting from the superposition of many unresolved discrete sources.
3 Prospects for future high-energy observations of blazars
We have seen that blazars, and in general NTED-AGN, emit non-thermal radiation across the entire electromagnetic spectrum. A clear understanding of the blazar content of the extragalactic high-energy sky is necessary as new missions are planned or are studied by European and other space agencies to explore in more detail the hard X-ray and -ray bands and to open the last energy windows (e.g. the few hundred keV-few MeV region) that for technical difficulties have so far remained almost unexplored but that are extremely important for the understanding of the physical processes powering NTED-AGN.
In the following we apply the same method used in the previous sections to estimate the number of blazars that could be detected by future microwave, X-ray and -ray observatories. We report the results in Table 1 where column 1 gives the energy band considered, column 2 gives the limiting sensitivity reached in that energy band, column 3 gives the corresponding 5GHz flux, and column 4 gives the number of blazars expected in the high Galactic latitude sky ().
Figure 2 shows that the distribution of ratios is extremely broad reflecting the fact that the flux in the X-ray region is deeply affected by the position of the synchrotron peak in plots. Blazars where the peak is located in the far infrared (LBL) have very little X-ray flux whereas extreme HBL objects can be thousands of times brighter at X-ray frequencies than LBLs of the same radio flux. Figure 2 implies that a survey as deep as erg cm-2s-1 would detect the whole distribution of blazars with 5GHz flux larger than 10 mJy, corresponding to well over 100,000 sources in the high Galactic latitude sky. From Fig. 5 (right panel) we can see that the average slope between the 5GHz radio flux and the hard-X-ray band and the soft -ray band is 0.85 and 0.84 respectively. Since the ratio between the radio flux and these energy bands is not expected to have a large spread around the mean value like , the average slopes can be directly converted to predict the hard-X-ray and the soft -ray fluxes. We have reported these predictions in column 2 of Table 1
| Energy band | Flux limit | Flux limit | No. of sources |
| (energy band) | (5GHz) | at high b | |
| (25,000 ) | |||
| Micro-wave | 70 mJy | 100 mJy | 5000 |
| (100 GHz) | 7 mJy | 10 mJy | 100,000 |
| Soft X-Ray | erg cm-2s-1 | 0.1-10 mJy | 100,000 |
| (0.12.4 keV) | |||
| Hard X-Ray | erg cm-2s-1 | 1000 mJy | 130 |
| keV | erg cm-2s-1 | 20 mJy | 70,000 |
| Soft -ray | ph cm-2s-1 | 1000 mJy | 130 |
| MeV | ph cm-2s-1 | 200 mJy | 2000 |
| -ray | ph cm-2s-1 | Monte Carlo | |
| MeV-GeV | ph cm-2s-1 | simulation |
A deep all sky survey in the soft X-ray band: 0.1-10 keV. From Table 1 we see that a deep all-sky X-ray survey in the soft X-ray band would allow us to build a sample of 100,000 blazars that are expected to be above the limiting sensitivity of PLANCK. Given the significant impact of the blazar foreground emission on the CMB power spectrum it is important to remove this contaminating component from the CMB as much as possible. An efficient way to achieve this is to exploit the fact that the spectral slope distribution between microwave and soft X-ray flux of LBLs is very narrow (see Fig. 9 of Giommi06 ) with a dispersion that is probably mostly due to intrinsic variability. The soft X-ray flux of LBLs (that is 90% of the blazar population) is therefore a very good estimator of the flux at microwave frequencies and could be used to locate and remove foreground blazars from the PLANCK and other CMB missions.
The extremely large sample of blazars produced by such a survey could also be used to study the statistical properties of blazars in great detail, including the spatial correlation function, and would identify a very large number of targets for the next generation of -ray observatories such as AGILE, GLAST, and future instruments operating in the still poorly explored MeV spectral region.
The expected number of blazars at -ray energies above 100 MeV cannot be estimated with a simple extrapolation of the 5GHz flux (see Sect. 2.4) and therefore we have calculated the preliminary expectations listed in the last row of Table 1 through a Monte Carlo method that makes use of the radio luminosity distribution of blazars and predicts -ray fluxes taking into account the distribution of EGRET detected blazars. This method is currently under development as part of our contribution to the GLAST project.
Acknowledgements.
It is a pleasure to thank the Organizing and Advisory Committee of this meeting for the invitation to present our results in the context of the planned and future gamma-ray experiments.References
- (1)
- (2) Aharonian, F. A., Akhperjanian, A. G., Barrio, J. A., et al. 2002, APh, 17, 459
- (3) Blandford, R. D. & Rees, M. J. 1978, in Pittsburgh Conference on BL Lac Objects, Ed. A. M. Wolfe (University of Pittsburgh, Pittsburgh), 328
- (4) Galbiati, E., Caccianiga, A., Maccacaro, T., et al. 2004, a&A, in press, astro-ph/0410432
- (5) Giacconi, R., Gursky, H., Paolini, F., & Rossi, B. 1962, Phys.Rev.Lett., 9, 439
- (6) Giommi, P. & Colafrancesco, S. 2004, A&A, 414, 7
- (7) Giommi, P., Menna, M. T., & Padovani, P. 1999, MNRAS, 310, 465
- (8) Giommi, P., Colafrancesco, S., Cavazzuti, E., Perri, M., & Pittori, C. 2006, A&A, 445, 843
- (9) Gonzales-Nuevo, J., Toffolatti, L., & Argueso, F. 2005, ApJ, 621, 1
- (10) Gruber, D. E., Matteson, J. L., Peterson, L. E., & Jung, G. V. 1999, ApJ, 520, 124
- (11) Hartman, R. C., Bertsch, D. L., Bloom, S. D., et al. 1999, ApJS, 123, 79
- (12) Kappadath, S. C. 1998, ph. D. Thesis, University of New Hampshire, USA.
- (13) Kushino, A., Ishisaki, Y., Morita, U., et al. 2002, PASJ, 54, 327
- (14) Loan, A. J., Wall, J., & Lahav, O. 1997, MNRAS, 286, 994
- (15) Lumb, D. H., Warwick, R. S., Page, M., & De Luca, A. 2002, A&A, 389, 93L
- (16) Marshall, F. E., Boldt, E. A., Holt, S. S., et al. 1980, ApJ, 235, 4
- (17) Mather, J., Fixsen, D., Shafer, R. A., Mosier, C., & Wilkinson, D. T. 1999, ApJ, 512, 511
- (18) Moretti, A., Campana, S., Lazzati, D., & Tagliaferri, G. 2003, ApJ, 588, 696
- (19) Padovani, P., Ghisellini, G., Fabian, A., & Celotti, A. 1993, MNRAS, 260, L21
- (20) Padovani, P. & Giommi, P. 1995, ApJ, 444, 567
- (21) Padovani, P., Perlman, E., Landt, H., Giommi, P., & Perri, M. 2003a, ApJ, 58, 128
- (22) Peebles, P. 1980, in The Large Scale Sturcture of the Universe, Ed. P. U. P. Priceton
- (23) Perri, M. & Giommi, P. 2000, MNRAS, 362, L61
- (24) Rector, T. A., Stocke, J. T., Perlman, E. S., Morris, S. L., & Gioia, I. M. 2000, AJ, 120, 1626
- (25) Rosati, P., Tozzi, P., Giacconi, R., et al. 2002, ApJ, 566, 667
- (26) Scott, D. & White, M. 1999, A&A, 346, 1
- (27) Sreekumar, P., Bertsch, D. L., Dingus, B. L., et al. 1998, ApJ, 494, 523
- (28) Strong, A., Moskalenko, I., & Reimer, O. 2004, ApJ, 613, 956
- (29) Tegmark, M. & Efstathiou, G. 1996, MNRAS, 281, 1297
- (30) Toffolatti, L., Argueso Gomez, F., de Zotti, G., et al. 1998, MNRAS, 297, 117
- (31) Urry, C. M. & Padovani, P. 1995, PASP, 107, 803
- (32) Urry , C. M. 2003 ASPC, 290, 3
- (33) Vecchi, A., Molendi, S., Guainazzi, M., Fiore, F., & Parmar, A. N. 1999, A&A, 349, L73
- (34) Vellieux , S. 2003 ASPC, 290, 11